Streaking with Phil Hughes
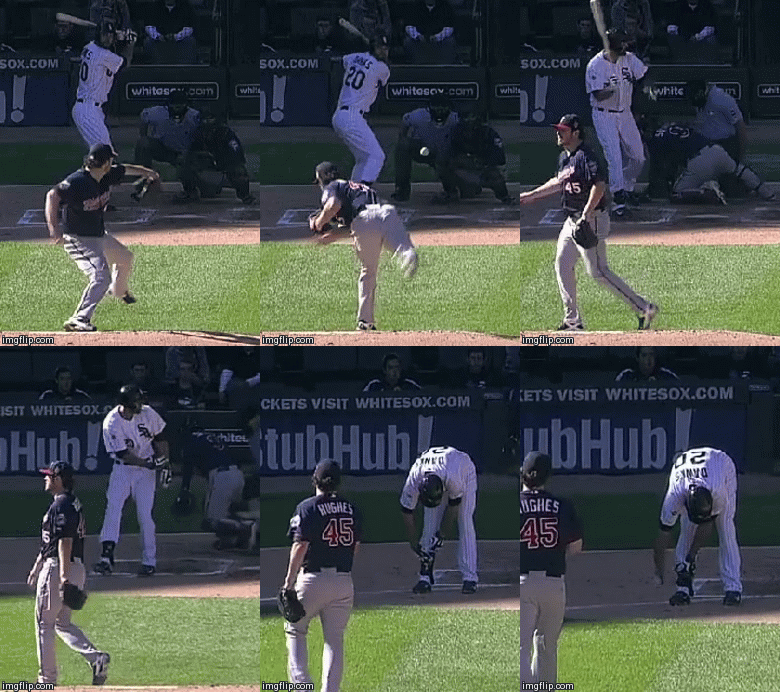
Phil Hughes is currently enjoying his most fruitful season as a starter. Indeed, he has already received considerable attention for his improved control and refined repertoire. Nonetheless, several recent feats merit additional attention. Indeed, Phil Hughes’ most recent start against the Chicago White Sox saw several notable streaks come to an end.

Hughes certainly wasn’t pleased with himself, and for good reason: he had just issued a free pass and put a runner on first base. Perhaps Hughes grasped the historic implications of that BB — he hadn’t issued a walk since August 10th against the A’s. That streak spanned 160 consecutive batters faced, including five walk-free games. Hughes pitched 37 innings without giving up a walk over those five games — the average MLB starting pitcher, posting a BB/9 of 2.7, would have walked over 11 batters during that span.
Hughes’ streak certainly appears impressive, but exactly how does it compare to his peers? Well, no other starting pitcher has managed such a streak this season… except for Phil Hughes. That’s right — Hughes had already posted a streak of 178 consecutive batters faced without a walk. Spanning from April 20th to June 1st, that streak included six walk-free games!
Hughes’ refusal to issue walks puts him in some pretty elite company. Observe the table below:
Table 1: For Starting Pitchers from 1969-2014, Longest Consecutive BB-Free Game Streaks, Sorted by IP.
| Rk | Name | Strk Start | End | IP | Games | W | GS | CG | H | ER | BB | SO | HR | ERA | HBP | Tm |
| 1 | Greg Maddux | 6/25/2001 | 8/7/2001 | 65.1 | 9 | 8 | 9 | 1 | 69 | 22 | 0 | 45 | 3 | 3.03 | 0 | ATL |
| 2 | Randy Jones | 5/21/1976 | 6/18/1976 | 60 | 7 | 5 | 7 | 5 | 53 | 16 | 0 | 14 | 5 | 2.4 | 0 | SDP |
| 3 | Greg Maddux | 8/3/2007 | 9/13/2007 | 53.2 | 9 | 5 | 9 | 0 | 56 | 19 | 0 | 30 | 2 | 3.19 | 1 | SDP |
| 4 | David Wells | 9/6/2002 | 4/16/2003 | 53 | 7 | 6 | 7 | 2 | 42 | 11 | 0 | 36 | 4 | 1.87 | 4 | NYY |
| 5 | Javier Vazquez | 5/1/2005 | 6/4/2005 | 50 | 7 | 3 | 7 | 2 | 51 | 19 | 0 | 41 | 4 | 3.42 | 3 | ARI |
| 6 | Greg Maddux | 6/9/1995 | 7/6/1995 | 47 | 6 | 4 | 6 | 2 | 39 | 5 | 0 | 36 | 1 | 0.96 | 0 | ATL |
| 7 | Bob Tewksbury | 6/20/1993 | 7/17/1993 | 44 | 6 | 4 | 6 | 0 | 43 | 12 | 0 | 21 | 2 | 2.45 | 1 | STL |
| 8 | David Wells | 8/24/2004 | 9/18/2004 | 41 | 6 | 5 | 6 | 0 | 36 | 14 | 0 | 28 | 6 | 3.07 | 0 | SDP |
| 9 | Phil Hughes | 4/26/2014 | 5/27/2014 | 40.1 | 6 | 4 | 6 | 0 | 38 | 7 | 0 | 30 | 1 | 1.56 | 0 | MIN |
| 10 | Paul Byrd | 5/4/2007 | 5/30/2007 | 40 | 6 | 4 | 6 | 0 | 49 | 16 | 0 | 21 | 6 | 3.6 | 1 | CLE |
| 11 | Randy Jones | 4/23/1980 | 5/16/1980 | 39.1 | 5 | 3 | 5 | 3 | 26 | 4 | 0 | 17 | 1 | 0.92 | 0 | SDP |
| 12 | Bob Tewksbury | 6/20/1992 | 7/9/1992 | 38.2 | 5 | 3 | 5 | 2 | 37 | 4 | 0 | 17 | 1 | 0.93 | 0 | STL |
| T-13 | LaMarr Hoyt | 7/13/1983 | 8/7/1983 | 38.1 | 6 | 5 | 6 | 1 | 44 | 18 | 0 | 24 | 6 | 4.23 | 0 | CHW |
| T-13 | Brian Anderson | 8/28/1998 | 9/19/1998 | 38.1 | 5 | 3 | 5 | 1 | 37 | 12 | 0 | 13 | 5 | 2.82 | 0 | ARI |
| T-15 | Cliff Lee | 9/23/2012 | 4/9/2013 | 37.2 | 5 | 2 | 5 | 0 | 30 | 7 | 0 | 37 | 5 | 1.67 | 0 | PHI |
| T-15 | Moose Haas | 4/16/1982 | 5/10/1982 | 37.2 | 5 | 1 | 5 | 0 | 37 | 12 | 0 | 19 | 2 | 2.87 | 2 | MIL |
| T-17 | Phil Hughes | 8/16/2014 | 9/6/2014 | 37 | 5 | 3 | 5 | 0 | 31 | 9 | 0 | 31 | 3 | 2.19 | 2 | MIN |
| T-17 | Curt Schilling | 5/13/2002 | 6/3/2002 | 37 | 5 | 4 | 5 | 0 | 26 | 9 | 0 | 47 | 1 | 2.19 | 2 | ARI |
| 19 | Brad Radke | 4/19/2005 | 5/10/2005 | 36.2 | 5 | 2 | 5 | 2 | 41 | 12 | 0 | 24 | 6 | 2.95 | 0 | MIN |
| T-20 | Brian Tollberg | 7/16/2001 | 8/22/2001 | 36.1 | 6 | 3 | 6 | 0 | 44 | 19 | 0 | 24 | 6 | 4.71 | 2 | SDP |
| T-20 | Curt Schilling | 8/20/2004 | 9/10/2004 | 36.1 | 5 | 5 | 5 | 0 | 28 | 9 | 0 | 34 | 3 | 2.23 | 1 | BOS |
Since the mound was lowered 45 years ago, Hughes’ streaks rank 9th and T-17th respectively. Notice the other pitchers who have multiple streaks in the top 20: Greg Maddux, David Wells, Randy Jones and Curt Schilling. For a guy who signed for $8M/year, that’s some impressive company (and Randy Jones). While Phil Hughes certainly isn’t Greg Maddux, his ability to limit walks has helped him post an xFIP of 3.17 this year, giving the Twins the closest thing to a true No. 1 starter they’ve had since Johan Santana.
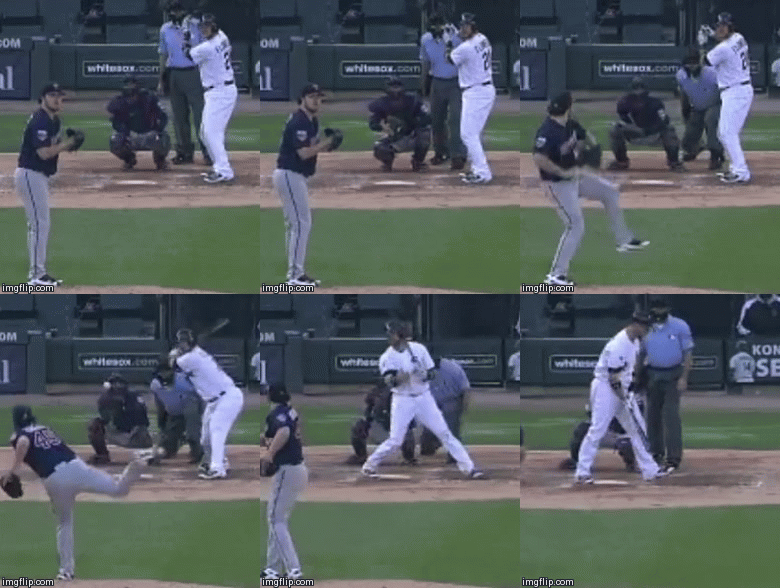
Interestingly enough, Hughes made even more history against the Chicago White Sox, this time snapping a team-wide streak for the Minnesota Twins.

At first glance, there is hardly anything remarkable about this outcome. Hughes has struck out 175 other batters faced this season, and Tyler Flowers has struck out in 152 other plate appearances. This, however, was Hughes’ 10th strikeout of the day — an arbitrary but nonetheless impressive feat.
With this punch-out, Hughes finally put an end to an ugly streak in Twins’ recent history: a Twins’ starting pitcher hadn’t fanned 10 batters in an outing since Francisco Liriano’s 10K performance against the Baltimore Orioles on July 18th, 2012. The Twins’ streak of 379 games without 10 punch-outs from a starting pitcher was the longest active streak in the league. During that 379-game drought, starting pitchers from the league’s 29 other teams amassed a total of 497 10-strikeout performances.
It’s no secret that Twins’ starters have been remarkably inept at missing bats in recent history. The table below depicts the depth of their woes over the past five seasons.
Table 2: From 2009-2014, Starter K/9 Including Mean & Standard Deviation
| Rank | Team | K/9 |
| 1 | Giants | 7.85 |
| 5 | Cubs | 7.38 |
| 10 | Braves | 7.23 |
| Mean | – | 6.96 |
| 15 | Marlins | 6.93 |
| 20 | Angels | 6.81 |
| 25 | Athletics | 6.64 |
| 29 | Orioles | 6.28 |
| 30 | Twins | 5.84 |
| σ | – | 0.44 |
At more than 2.5 standard deviations below the mean K/9, Twins’ starting pitchers have been tremendously poor at striking hitters out over the last five seasons. Whether or not this has been a function of design or merely ineffectiveness, the Twins’ rotation has severely hurt the team, posting an ERA of 4.88 during that period. Within this context, Hughes’ outing is truly shocking.
Perhaps Hughes’ outing is a sign of better fortunes to come for the Twins. Perhaps it was an anomaly. Both Hughes (11K) and Quintana (13K) set career-high strikeout totals in their respective starts. At one point, the never-prone-to-hyperbole White Sox broadcast team proclaimed, “You give Chris Sale this visibility, starting every game at home…he would re-write the strikeout record book.”
Regardless of the game conditions, Hughes’ start featured several remarkable feats. Ironically, while Hughes’ lone walk (a negative outcome) allows us to appreciate his greatness, his 10th strikeout (a positive outcome) allows us to contextualize the Twins’ incompetence. Here’s to you, Phil.
Editor’s Note: As I conclude this article, the Twins’ Trevor May has just fanned 10 batters in his Sunday start against the White Sox. Here’s to you as well, Trevor.
Statistics courtesy of FanGraphs, historical data courtesy of Baseball-Reference, and gifs courtesy of MLB.TV.
Ben Cermak lives in Manhattan and spends far too much time thinking and writing about baseball. You can contact him via email at bcermak14@gmail.com
Ben Cermak (UPenn '14) lives in Manhattan and spends far too much time thinking about baseball. You can reach him via email at bcermak14@gmail.com
This title has all the makings of a Notgraphs post.
How dare I forget to mention #KeepNotgraphs?
Ben, how do you account for Phil Hughes dramatic improvement in limiting home runs? (I understand this is perhaps a question to be answered in columnar form).
That’s a good question. The first element I’d point to is his fly ball rate– down from 46.5% last year to 39.8% this year. While Hughes’ profile still leans toward that of a fly ball pitcher, he’s allowing hitters fewer chances to elevate the ball and park one in the cheap seats.
Of course, maybe the most obvious answer is a change in venue. Going from a park that augments HRs to a park that suppresses them is a huge step, especially for a guy who induces his fair share of fly balls. Strangely enough, looking at his home/away splits, Hughes has given up homers at a higher rate at home than on the road (albeit still at a pace below league average)…
All in all, he’s probably due for some regression- a 6.4 HR/FB% is hard to sustain. But given his reduced fly ball rate and new park environment, I wouldn’t be surprised if he continued to allow homers at a rate below league average.
Right, thanks! I think his abandonment of the change up has probably helped lower that FB% as well.