StatCast Playoff Data Breakdown
Now that the baseball season is over I thought I would throw together a little data breakdown of the 2014 playoffs according to the public StatCast records available. I created a rough relational database that will allow me to run a few simple queries to give us an idea of what information the new system will be able to spit out on a daily basis (fingers crossed, next season). I built the database with the anticipation of adding to the records next year as more data is released. I hope, eventually, there will be complete statistics available for each play because in the current format there are many null values which drives me nuts, but it is what it is.
Seven tables make up the database that is designed to catch each play in it’s entirety. The four main tables are BATTING, FIELDING, PITCHING, and RUNNING. This is where all of the new fancy data is stored. Now as to not get further into the weeds lets take a look at what we got.
BATTING
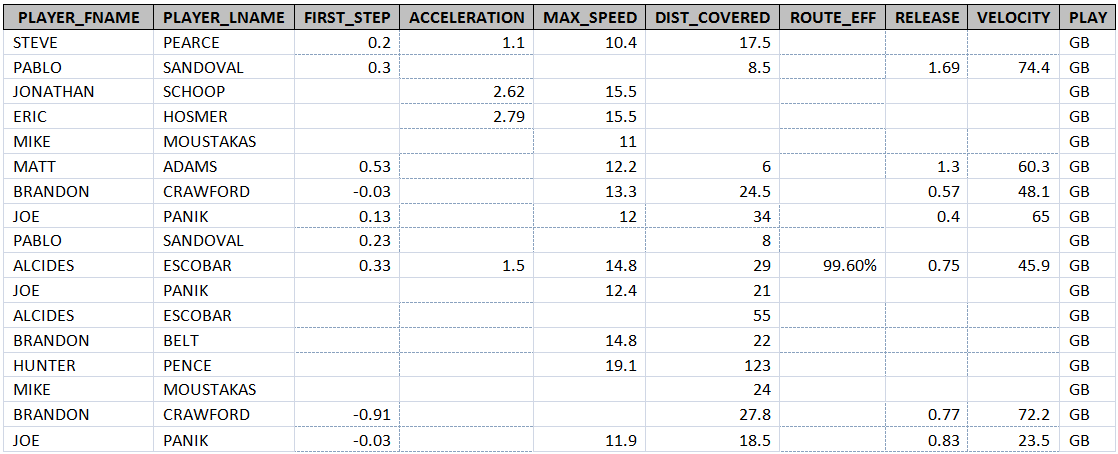
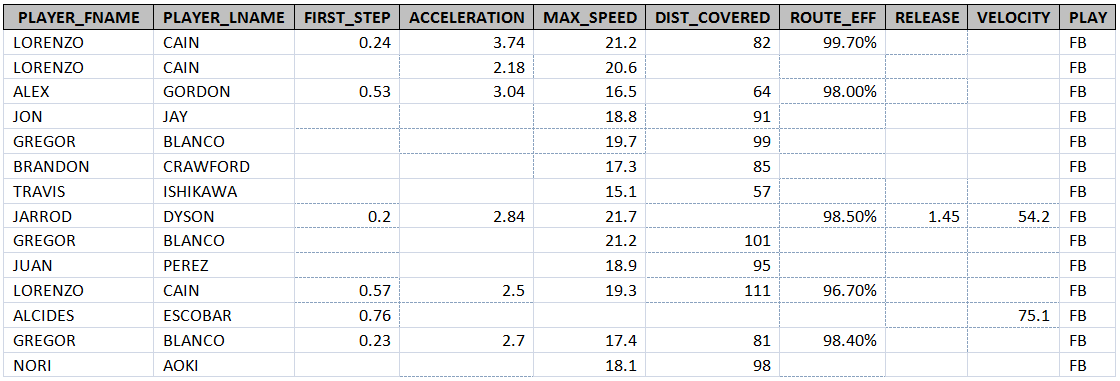
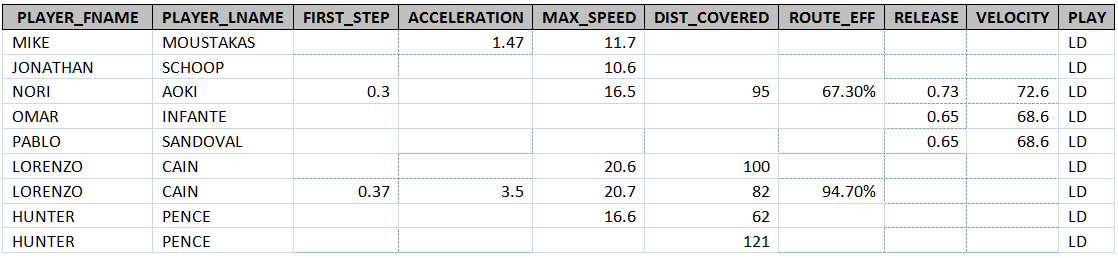
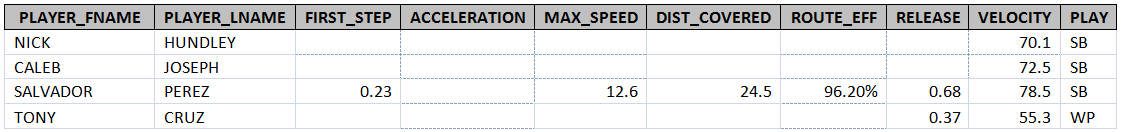
First, lets look at the batting statistics for each play in the playoffs monitored by StatCast (and revealed to the public) sorted by batted ball type. Please note each row is an individual play that was tracked and recorded during a given playoff game.
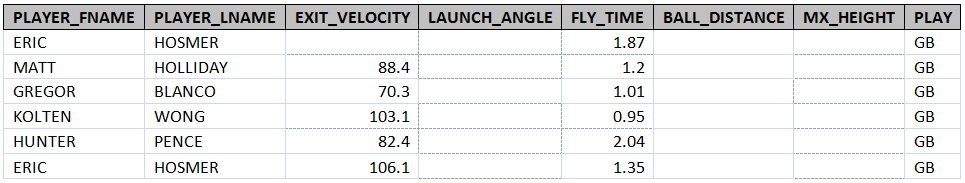
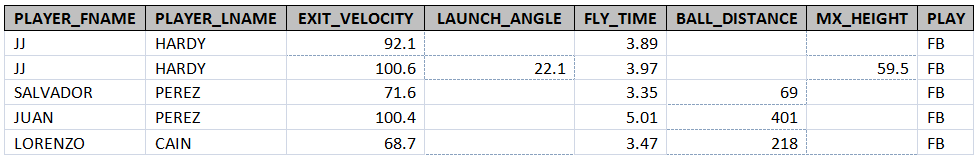
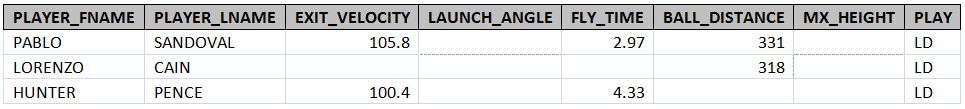
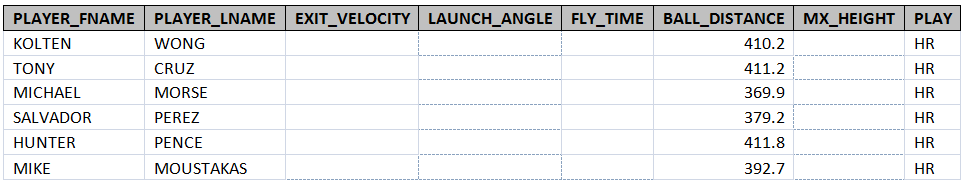
I purposely left the null values in the tables to demonstrate the inefficiencies that exist due to the lack of data for each play.
FIELDING
This is were the data starts to get a little more thorough. Once again the tables are sorted by batted ball type and each row represents a particular fielders input on a given play.
Rather than bore you to death with more tables I will just summarize the other two entities, PITCHING and RUNNING. To date, the RUNNING (base running) entity contains more records than any other aspect of the game. MLBAM has been extremely fond of recording players peak running speeds, which I find to be the least informative of the current metrics recorded. What intrigues me about the RUNNING aspect of StatCast are statistics such as a player’s average lead length on a steal and how that might correlate with SB% or which player has the quickest “first step” when stealing a base. I’m sure all of you have thought of countless other ways to utilize StatCast for base running so I wont go into a brainstorming session. Here are just a few quick facts about the base runners of the 2014 playoffs:
The average lead length by all runners was 10.89 feet.
The average secondary lead was 16 feet.
The player who reached the highest max speed rounding the bases was Jarrod Dyson at 22.3 mph.
Jarrod Dyson also had the fastest first to third speed at 21.1 mph.
The quickest first step came on a sac fly tag up by Hunter Pence. It registered at -.17 sec. I wonder if this means he left early?
For all of the talk about KC’s running game, the Giants actually had an average team lead length higher than KC during the playoffs and there was a decent number of records for each to substantiate it. (50 records for KC, 49 records for SFN)
SFN Average lead length in playoffs 11.1 feet
SFN Average secondary lead length in playoffs 16.4 feet.
KC Average lead length in playoffs 10.9 feet.
SFN Average secondary lead length in playoffs 15.8 feet.
The PITCHING entity is by far the most complete, but contains little data. As of today, MLBAM has used StatCast to track four pitching measurements, Extension, Actual Velocity, Perceived Velocity, and Spin Rate. To be honest I have never thought about two of these metrics and how they could affect a pitchers performance; those two being extension and spin rate. Extension might simply need to be recorded for each pitcher so that we could analyze trends. Say a pitcher’s average extension starts to decrease. What steps need to be taken to correct it? Could this be a sign of an injury? and so on. Fun fact, Yusmeiro Petit has had the longest extension recorded by StatCast at 92 inches. There is only one pitcher who has multiple records. Yordano Ventura has an extension of 60 inches and 68 inches. I wonder what the average extension range is for pitchers? It would be interesting to find what affect the spin rate of the pitch had on batters. With more data, I might first start to analyze the correlation between spin rate and batted ball type. Currently, there is not enough public data available to be able to do this accurately.
I hope this was not too boring and at the least will spark your enumerative imaginations for this off-season.
Correction notice: It should be KC Average secondary lead length in playoffs 15.8 feet NOT SFN. Sorry.
Hunter Pence’s first step at -0.17 seconds doesn’t mean he left early. It just means his body started moving before the ball was caught – his foot left the bag after he started moving.
Extension is related to the difference between actual and perceived velocity. Roughly, each additional foot of extension increases perceived velocity by about 2 mph.