Starting Pitchers Aren’t Leaning On Their Best Pitches

The title of this post does not exactly mince words. Should that be all the context you need (TL;DR), it would be fair to move on. However, for those looking for a greater explanation, qualifications and nuance abound in what follows as justification for such a statement.
The impetus for doing some digging and eventually choosing this topic (and title) is pretty simple; I wondered whether starting pitchers, over the course of a long season, throw their best pitches more often than their less effective pitches.
Starters were the focus for a reason. Relievers, who most often face mere subsets of an opposing lineup (and face that subset crucially just once) in any given outing, are likely more inclined to defer to their strongest offerings at higher rates. Starting pitchers, meanwhile, often have to grapple with the phenomenon of diminishing returns on pitch usage. Should an opposing hitter see that “best” pitch over and over, what made it effective in the first place loses some of its value to a hitter’s heightened recognition. Starting pitchers, it turns out, probably should practice some moderation.
Let me offer a quick outline of the data included below. Baseball Savant provided pitch data on all pitchers who threw >2,000 pitches in 2021 (essentially filtering for those players who most often started games) and grouped pitches by pitch types. I then pulled swinging strike data from Baseball Savant for each pitcher, again grouping by pitch types. Joining those datasets offered a view of each qualifying pitcher’s individual pitch usage (% of pitches) and that pitch’s corresponding swStr%.
As an aside, swinging strike percentage serves as a proxy for “best” pitch in this case. There are legitimate arguments that could be made for other measures (wOBA against, for instance), but for better or worse, swStr% was the poison I picked.
As one more filter, I removed all pitch data for pitches thrown <3% of the time, believing this data would create sample size issues, thus potentially painting an unrealistic picture of pitch performance. Lastly, for each pitcher, the correlation between pitch usage and pitch swStr% was calculated. This correlation served as the primary measure for indicating to what degree these pitchers relied on their “better” pitches relative to their lesser offerings.
As an example, here is an extreme example of a pitcher in 2021 who did not rely, proportionally speaking, on his better pitches.
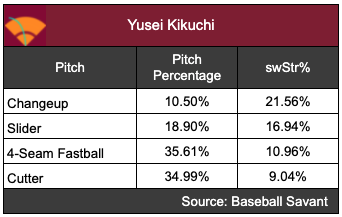
The correlation between Yusei Kikuchi’s pitch percentages and swStr% in 2021 was -0.98, the lowest among the 92 pitchers who threw >2,000 pitches in 2021. His changeup, which had far and away the highest swStr% in his arsenal, was employed far and away the least often. On the other end of the spectrum, his two fastball variations made up ~70% of his offerings with considerably lower swStr%. Might Kikuchi benefit from leaning into his offspeed/breaking offering more frequently in 2022?
Intuitively, the table above makes sense. Starting pitchers especially rely on their fastballs to get ahead in counts, induce contact, and set up those pitches that more fundamentally dip, dive, duck, and dodge the barrels of bats. But Kikuchi takes that logic to an extreme.
Not all pitchers lean away from their high-miss offerings. Below is a leaderboard for 2021 pitchers which sorts by the highest correlations between pitch percentages and swStr%.
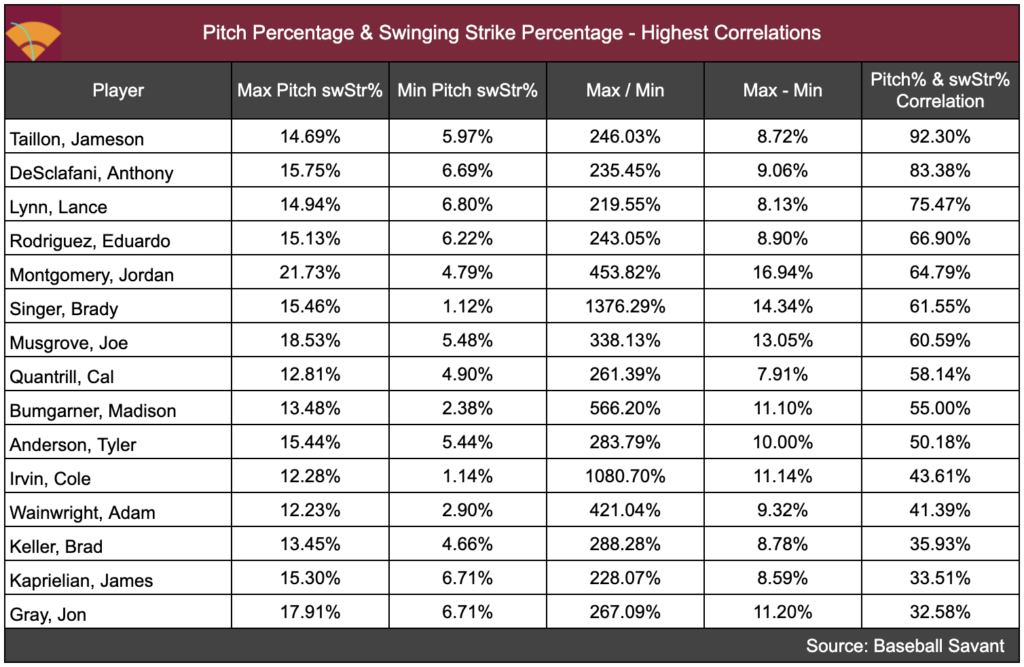
Very generally speaking, it seems as though pitchers on this top-15 board get good mileage (in swStr%) out of their fastballs. Jameson Taillon and Lance Lynn, for instance, both get the highest swStr% from their fastballs, which they also happen to throw most often among their pitches. Anthony DeSclafani as a counterexample, leaned most heavily on his slider in 2021, which also happened to be his toughest offering for hitters to connect with.
Next are those pitchers who most regularly spurned their high swing-and-miss offerings for those contact-oriented pitches in 2021.
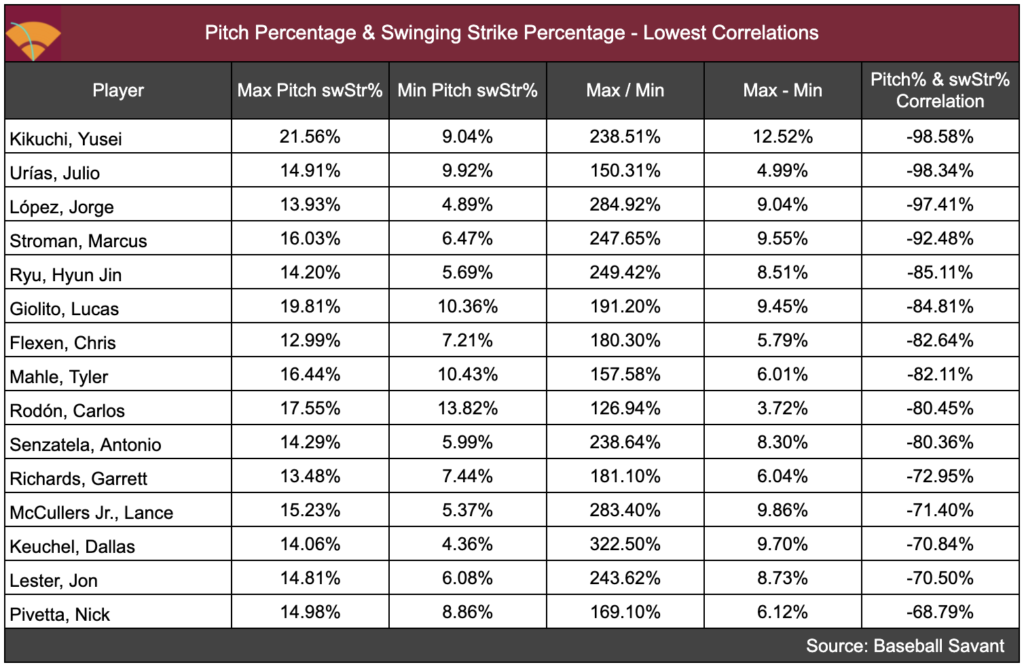
It is tough to say whether pitchers like these should pitch more off of their high swStr% offering; clearly there are a lot of very successful pitchers among this group. Still, in a climate of shrinking starter workloads and fewer trips through the order, one wonders (or at least I do) the value that could come from deferring to those high swStr% a bit more often.
In order to provide a bit more context for 2021 pitchers altogether, the histogram below depicts the correlations between Pitch% & swStr% among all pitchers examined.
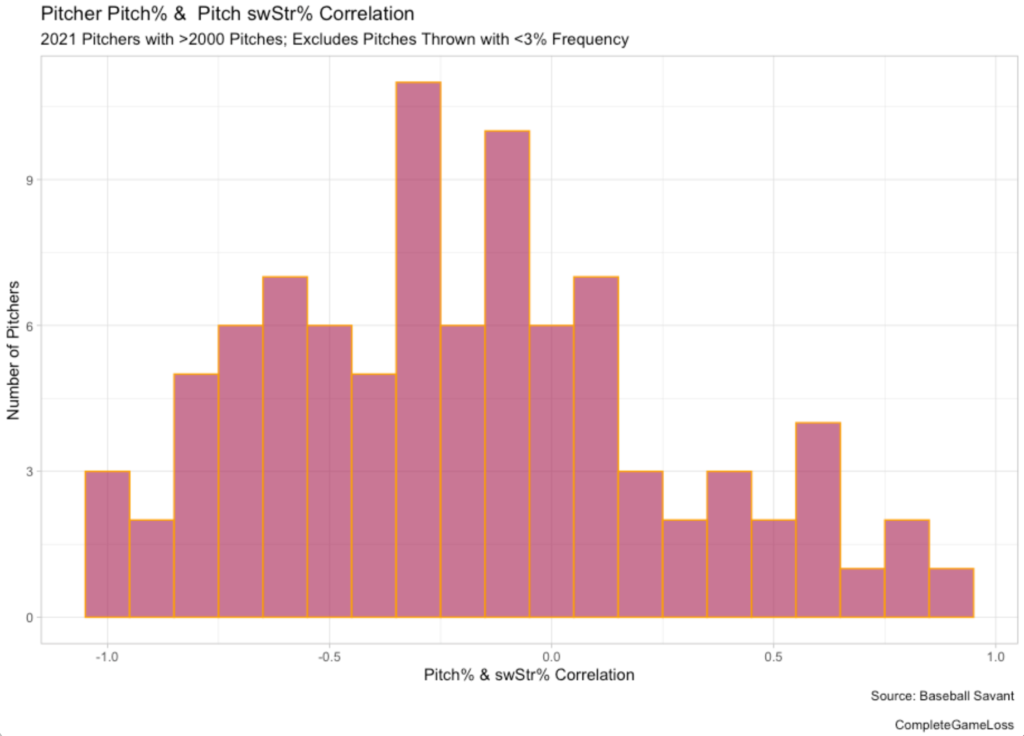
Of the 92 pitchers included, 64 had negative correlations between their pitch usages and those pitches’ swStr%. Digging a bit deeper, only 11 pitchers of 92 threw their highest swStr% offering more than any of their other pitches.
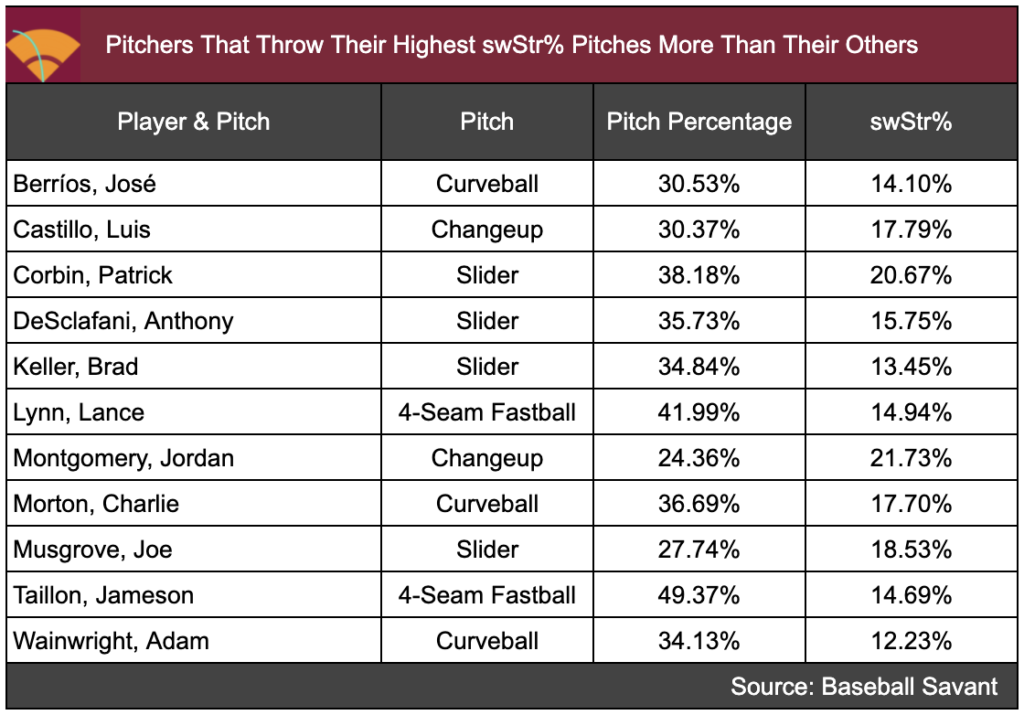
In several cases above, like that of Joe Musgrove for instance, breaking pitches ranked first due primarily to pitchers deploying 2+ types of fastballs.
This exercise was a descriptive one rather than prescriptive: it highlighted occurrences from 2021 but has nothing to say regarding how best to mix pitches. Should I have to guess though, given the rise in pitch engineering, the emphasis on strikeouts, fewer times through the lineup for starters, and increased willingness of pitchers to leave the strike zone, it seems that over time these correlations will rise. Therefore, the number of pitchers with negative correlations will in theory over time become more proportional with those with positive-correlation pitchers. That said, only time will tell.
This post was originally published on my personal blog.
Excellent. Thank you.