Revisiting Changes in Spin Rate and Spin-Surgers
Why I Care About Spin (and You Should, Too)
After last week’s deep dive on Gerrit Cole’s release point change and resulting spin increase, I decided it was time to brush off the old physics textbooks and try to identify a causal link between the two. Before I get into the results, I’ll warn you that the second part of this article where I talk about which mechanical changes correspond to the trends we see in the data is almost entirely guesswork. I’m in way over my head on this stuff and you should consider most of it wild speculation in the hopes of provoking the interest of people who can write “biomechanics” without a spell-checker. But as my dad (who happens to be a mathematician himself) has said, “sometimes asking the right questions is more important than finding the answer yourself (Forman, 2018)”.
I think it’s important to explain to readers why I decided to revisit the question of release point and spin. Up to this point, baseball Research and Development departments and private labs like Driveline have learned an incredible amount about the effects of spin on a baseball; however, how to increase one’s own spin rate remains to be understood.
The significance of this research should not come as a surprise to anyone who has been paying attention to baseball since the public dissemination of Trackman data. As noted in last week’s piece, Trevor Bauer has spent five years of his life trying to naturally boost his spin rate and I’m guessing he’s not the only pitcher going down that rabbit hole. If this link between release point and spin truly exists and is widely generalizable, breakout pitchers could be identified long before their true talent level is shown in their ERA and WHIP. Observers could test the sustainability of a pitcher’s success just by looking at changes in their release point. As this summer’s historically slow free-agent market has demonstrated, teams are starting to turn inward to their player development systems for a cheap, alternate talent pool. If this research is confirmed, teams could unlock the true spin potential of their own players, consequently spiking the talent level of the entire field (which fans of the game like myself love to see).
More than anything, this research question makes me excited about the future of baseball. I see a baseball future in which pitchers intentionally vary their fastball spin rate to high and low extremes to get maximum separation on their four-seam lift and sinker drop. One where hitters take batting practice off of virtual reality AI replications of pitchers with realistic spin patterns and pitch physics so their first time facing the pitcher feels like the third time through the order. Harnessing spin rate is not just another tool to which the rest of the league will soon respond. It is an entire framework for understanding the game we all love that changes the nature of the competition itself. Now, how do we get there?
Gerrit Cole’s Adjustment
First, data was scraped from Baseball Savant on every pitch Gerrit Cole has thrown in the 2018 and 2017 season. Because we want to examine within-pitch spin variation, a subset was created containing only four-seam fastballs. A simple linear regression was run using all available release point coordinates and release velocity. We use the variables “release_pos_x,” “release_pos_y,” and “release_pos_z” as regressors. X-axis release point is measured from the center of the rubber from the perspective of the catcher, so right-handed pitchers will have negative values. Z-axis release point measures the height of the release point using the bottom of the rubber as a baseline. Y-axis release point tracks the extension of the pitcher. All measurements are in feet.
Velocity***0.230.020.00
| Regressor | Estimate | Standard Error | P-Value |
|---|---|---|---|
| X-Axis | 0.03 | 0.14 | 0.80 |
| Y-Axis*** | 0.55 | 0.09 | 0.00 |
| Z-Axis*** | 1.19 | 0.15 | 0.00 |
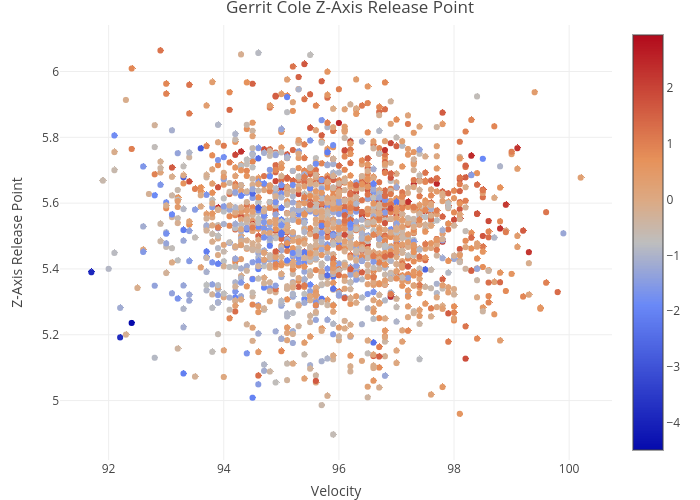
First, the estimates suggest that there is a positive relationship between an increase in y-axis release point and the spin rate of that pitch. The plot below demonstrates this. Velocity is listed on the x-axis because it is such an important predictor of spin rate. To see the effect of y-axis release point, pick any given velocity value and look at the difference in spin between a point with a relatively small y-value and a large one. The results are pretty jarring:

The color of the points represents how many standard-deviations away from Cole’s mean spin-rate that pitch was. Because spin-rate varies so much from pitcher-to-pitcher, we should look to see how changes in release point affect within-pitcher spin variation.
This same observation between y-axis release (extension) and spin has been documented previously in Nagami et al., as follows:
“The angle at which the fingertips reached forward over the ball during the top-spin phase was highly correlated with ball spin rate. In other words, ball spin rate was greater for the pitchers whose palm was facing more downward at the initiation of the back-spin phase.”
Because the angle between the palm and ground increases as release position along the y-axis increases, we can confirm our intuition: the longer you hold onto the ball, the more spin it has. Can this be used to help transform pitchers with mediocre fastball spin to elite rotation anchors as has been seen with Gerrit Cole this year? To answer that, we need to have a more sophisticated understanding of the biomechanical process of spinning the baseball.
Again, Nagami et al. has an answer,
“The greater the ball speed, the more downward it must travel. To accomplish this, pitchers with a faster speed would need to hold the ball longer, which means that the palm would have to face more downward at the initiation of the back-spin phase. This would result in a longer period for acceleration to produce spin, and thus produce a higher ball spin rate.”
This suggests that because higher velocity pitches have to be thrown at a steeper angle downward [because downward acceleration due to gravity has less time to act on the pitch], the pitcher then holds the ball longer as it is traveling down the y-axis and thus has more time to impart spin on the ball. Work is force times distance. If we want to transfer more energy into an object, we can either increase the magnitude of the force or apply it across a larger distance vector. We already knew that higher velocity pitches have higher spin. The results of our regression, however, suggest that even after controlling for velocity, release position along the y-axis (that is, releasing the ball further in front of the rubber) has a statistically significant effect on the spin rate. This means that for two pitchers with equivalent velocity, a one-foot increase in y-axis release increases the spin rate of that pitch by half a standard deviation. While no pitcher can actually extend his release point by an entire foot, small adjustments in spin can have career-altering results. In combination with a velocity increase and z-axis release point increase, it seems Gerrit Cole has found his optimal release point for maximizing spin. If this isn’t his peak, the MLB better look out.
Next, there is the problem of accuracy. Can an individual pitcher adjust his y-axis release position to improve the spin rate of his fast ball to a significant extent while still throwing strikes? The answer seems to be yes. As the spin rate of a pitch increases with fixed action of rotation, the deflection force increases orthogonal to the velocity vector of the ball. It speeds the air above the ball, which decreases the air pressure relative to the air below it. The air below it travels upward, pushing the ball along with it and generating “lift”. This is referred to as the Magnus effect. Not only does this means pitchers can spin the ball more without sacrificing strikes, but the Magnus effect alone makes pitchers more effective for two reasons. First, because hitters cannot optically track the ball in the last few milliseconds of the pitch, their brain oftentimes has to linearly extrapolate the trajectory and guess where the ball will end up at the point of contact. This means a small amount of lift can create the perception of a “rising fastball” in the batter’s mind. Second, vertical ball movement decreases the area of pitch-plane and bat-plane intersection. More simply put, the ball is harder to hit with upward movement.

Why is a Higher Release Point Better?
Second, and perhaps more surprisingly, a higher z-axis release point was significantly correlated with spin rate. Last week I forgot to mention that clicking on these plots takes you to my official “plotly” page where the graphs are all cool and interactive, so try it out if you’re interested.
I tried to find a convincing explanation for why the estimate for the z-axis was positive without any luck. A few potential explanations come to mind. First, the higher you hold the ball, the more gravitational potential energy it has. Conservation of energy and the fact that the ball is thrown downward suggests that extra potential energy could be transferred to rotational kinetic energy, which is directly proportional to angular velocity. One of the problems with this theory is that, in general, the gravitational potential energy is not large enough to have a significant impact on spin compared to the overwhelming kinetic energy the pitcher is transferring to the ball.

The second (and more likely) potential explanation I came up with is that when pitchers throw with a three-quarters delivery, they decrease the component of force that they exert orthogonal to the moment arm on the ball. This is the only force that matters for torque (and the resulting rotational acceleration). When managers say the pitcher throws “through” the ball instead of “around” it, this is what they’re talking about. The rest gets transferred as translational kinetic energy, which is applied to the center of mass and contributes to what we call “velocity”. However, theoretically the math does not change along with the arm angle. The only thing that would change is the spin axis, which means the Magnus effect would have less of an upward component and would push the ball sideways. Because Trackman calculates spin regardless of the axis, this should not affect our estimate. The change would have to be a mechanical quirk that could be picked up on a high-speed camera.

We have to keep in mind, however, that not all spins are equal. For example, throwing over-the-top has the same transverse spin rate but adds gyro-spin. Gyro spin is the spin of a projectile which is rotating around a spin axis that is parallel with the direction of the velocity vector (as shown in the picture below). This is sometimes referred to by those within the industry as “not useful” spin, due to the fact that it does not trigger the Magnus effect. This change would again have to be due to another mechanical quirk at the release point that are beyond my abilities to track as a college undergrad who has no biomechanical experience and a Khan-academy video’s worth of knowledge. Answering the question of why z-axis release height is correlated with spin rate really should be left to a dedicated biomechanical researcher who has access to a lab.

Is this true for everyone?
Our next task is to test whether or not this trend is generalizable. This is a little easier said than done. In order for release point to be a useful regressor, it has to be variable so that we can test the effects of a change. The problem is that release point consistency is also a skill that Major League teams prioritize both for command and tunneling (making two distinct pitch-types seem alike until the very last second). Ideally, we’d have release point data distributed as a Gaussian, but for now we will have to make do with release point varied as a conscious effort by the pitcher. That causes another problem: if our regressors covary with a variable that correlates with spin rate and that variable is erroneously left out of the regression, it will create an endogeneity problem. This is especially prevalent with release point data that is roughly constant until a conscious correction is made, meaning the release point varies with time (along with potentially velocity, a different pitch-mix, stride length, workout regimen, etc.). This means a study of multiple pitchers will have time-variant error. We are using a fixed effects model, meaning that we time de-mean both the regressors and variables of interest (as shown below). Data on every four-seam fastball thrown by this year’s starting pitchers over the last two years was collected and spin was regressed on the release point. For those following along at home, we used the absolute value of the X-axis release position so we get the measure of sideways extension for both left-handed pitchers and right-handed pitchers.

Velocity***0.080.000.00
| Regressor | Estimate | Standard Error | P-Value |
|---|---|---|---|
| X-Axis*** | -0.06 | 0.00 | 0.00 |
| Y-Axis*** | 0.27 | 0.01 | 0.00 |
| Z-Axis*** | 0.16 | 0.01 | 0.00 |
I’m going to give you a taste of one of the applications of this research. We can calculate predicted change in spin rate by using the regression coefficients above. If we weigh changes in release point, multiply them by the standard deviation in spin, and add them together, we should be able to get an idea of which pitchers making mechanical changes and (more importantly) how important those changes are in terms of spin rate. Below is a list of pitchers who rank the highest in “weighted release point change” based on recorded changes in release point from 2017 to 2018.
| Name | Weighted RP Change | 2017 Spin Rate (RPM) | 2018 Spin Rate (RPM) |
|---|---|---|---|
| Kyle Hendricks | 36.2 | 2021 | 2073 |
| Clayton Richard | 27.1 | 2085 | 2132 |
| Reynaldo Lopez | 16.2 | 2119 | 2099 |
| Mike Foltynewicz | 13.6 | 2258 | 2369 |
| Dallas Keuchel | 12.9 | 2041 | 2089 |
| Stephen Strasburg | 10.4 | 2175 | 2100 |
| Daniel Mengden | 9.6 | 2092 | 2110 |
| Gio Gonzalez | 9.4 | 2220 | 2177 |
| Andrew Cashner | 9.2 | 2099 | 2129 |
| Gerrit Cole | 8.6 | 2155 | 2326 |
First thing’s first, while this isn’t the most important thing in the world, it is comforting to see Gerrit Cole’s name near the top of the list in the metric we created with his spin change in mind. Full disclosure, I was only going to show the first ten pitchers but realized he was sitting at 11th. Still pretty good. Second, there are a lot of interesting names accompanying him. Mike Foltynewicz has made drastic strides this year in limiting hard contact, which has been reflected in his ERA and WHIP. I like Daniel Mengden quite a bit this year. He has had flashes of brilliance including his most recent outing where he limited the Red Sox to 1 earned run over 6 innings. Also, it is interesting how a lot of the guys listed here are known as extreme low-spin pitchers (Dallas Keuchel is a great example). This can also have a tactical advantage by exploiting the flip-side of the Magnus effect. The lower your transverse spin, the more drop you have relative to the rest of the league. For them it might be disadvantageous to be on this list. As a result, it might be worth examining the rate of return a pitcher gets from arm angle changes at different ends of the spin spectrum. We note that some pitchers our model predicts would increase spin rate actually experience a decline in spin rate which demonstrates the complexities of the biomechanical process of spinning a baseball. It should be kept in mind that our model is relatively simple, that our model should be used as a general guideline for understanding mechanical changes and not the last word on spin rate, and that release point should not be studied independent of other factors. For example, more complex models might start by examining the interaction effects of release point changes and velocity to determine diminishing or increasing marginal returns to mechanical tweaks as velocity increases.
Where do we go from here?
As mentioned earlier, the study of spin rate and the relationship between spin and release point has wide applications for internal baseball research and development departments along with casual observers wondering if a short-term spike in spin rate is sustainable. While I realize I’m getting into the habit of ending articles by saying smarter people should take a look and see if this is a real thing, the next step is figuring out exactly why we are seeing these trends in the data. Then, we will finally have a strong basis for answering the question of which factors contribute to a pitcher changing his own spin rate.
I bet your dad is very proud of you.