Reds Pitchers Are Setting Records in Fastball Futility
Entering the 2017 season, projections were not particularly friendly to the Cincinnati Reds. FiveThirtyEight projected a 70-win season for the team, and FanGraphs was even more pessimistic, predicting just 68 wins and the league’s second-worst run differential. They also projected the Reds to allow 5.02 runs per game — trailing only the Coors Field-dwelling Colorado Rockies — so it’s fair to conclude that expectations for the Reds’ pitching staff were low coming into the season.
And, really, why wouldn’t expectations have been low? Last season, the Reds’ pitching staff really struggled; as Dan Szymborski noted in his pre-season ZiPS preview, Reds starting pitchers produced the lowest WAR among all major-league rotations, and their relief corps owned the second-worst bullpen WAR since 2000. After trading Dan Straily to the Marlins over the offseason, the outlook for this year wasn’t much better — of all Reds starting pitchers, ZiPS expected only Anthony DeSclafani and Brandon Finnegan (both currently on the 60-day disabled list) to accumulate a WAR over 1.0. The remaining three members of their Opening Day rotation – Homer Bailey, Scott Feldman, and Robert Stephenson — were all projected a WAR of somewhere between -0.3 and 0.6.
The winter projections hadn’t set a very high bar for the Reds to clear, but so far, they haven’t been able to do so. As it happens, Cincinnati’s 2017 starting rotation has been even worse than advertised. Consider these facts, all current as of August 12:
- Reds starting pitchers have a collective ERA of 5.98. If this number was to stand, it’d be the worst since the 2005 Royals.
- The team’s starters have also combined for a FIP of 5.75, which would be the highest since the 2000 Angels.
- Cincinnati starters have accumulated a WAR of 0.1. If this number holds steady for the last six weeks of the season, it would be the lowest WAR figure – by far – of any starting rotation ever. The 2007 Nationals’ starters, currently the worst in that field, still managed to put up nearly one win above replacement.
That’s not all, though — on the x-axis of the following chart, we see each team since 2002 ordered by fastball runs per pitch (wFB). The dark blue dots in the back represent each team’s total wFB, and the lighter blue dots show each team’s standardized wFB (known as wFB/C). Note that for the purposes of showing both sets of values on the same scale, I standardized both teams’ wFB and their wFB/C using R’s scale() function. For the purposes of the following chart, then, wFB/C can be interpreted as the standardized standardized runs per pitch.
As illustrated below, the correlation between wFB/C and wFB begins to moderately weaken about halfway through the ranked order, but in general, the relationship between the two is strong:
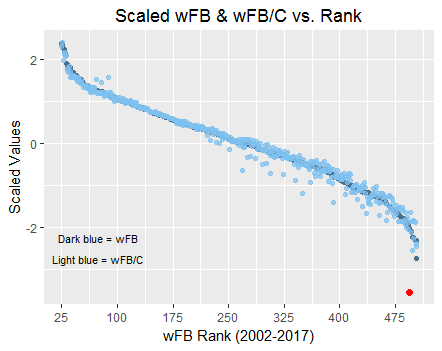
There is, however, a notable outlier. Draw your attention to the lower-right corner of the graph, and you’ll see the 2017 Cincinnati Reds’ wFB/C, highlighted (appropriately enough) in red. The point’s position along the x-axis illustrates just how unsuccessful the Reds’ fastballs have been this year. Out of the 480 individual team seasons since 2002, the Reds’ starters currently rank 470th in wFB. Even worse, there are still six weeks left in the season, so Cincinnati is likely to eventually overtake the 2002 Rangers’ -118.4 wFB for worst in recorded history.
Further, the Reds’ wFB/C, as shown on the y-axis, is historically low; no other team — including the ten teams with lower wFB figures — comes anywhere close to the 2017 Reds’ vertical position in the graph. For additional context, the White Sox currently own the second-lowest wFB/C in the league at -0.80; Reds starters’ wFB/C is -1.72. There’s also an enormous discrepancy between Cincinnati’s 2017 wFB/C (the red point) and wFB (the corresponding dark blue point). As illustrated above, no team’s rotation in the last 15 years has ever had a season with such a large difference. Interestingly, deviations like this are far more present in sliders and slightly more so in changeups, but standardized wFB and wFB/C are generally very close to each other.
For the 2017 Reds, this means that although they’ve thrown far fewer fastballs than teams whose statistics comprise a full 162-game season, their average fastball’s run expectancy has been detrimental enough to already give them the tenth-worst wFB since 2002. I should note that pitches’ linear weights are descriptive rather than predictive, as explained on FanGraphs’ Linear Weights page, An awful pitch value doesn’t necessarily mean that the pitch itself is equally bad, so Cincinnati starters’ historically terrible collective wFB/C isn’t evidence that each of them throws a similarly terrible fastball. And to be fair, the Reds’ rotation hasn’t been helped out much by Tucker Barnhart and Devin Mesoraco’s -2.9 and -3.0 FRAA figures, which are ranked 67th and 68th, respectively, out of 90. But it’d be hard to argue that the Reds rotation’s historically low wFB figure isn’t meaningful.
I didn’t notice anything particularly unusual about the usage, velocities, or movements of the Reds’ fastballs themselves, which fits with the “descriptive, not predictive” note above. The team’s starters have thrown the 20th-highest percentage of fastballs in the league, and their fastballs’ average velocity ranks similarly. Instead, I interpret their horrific wFB/C as more of a general indication of the state of the Reds’ rotation, which (as their ERA and FIP also suggest) leaves much to be desired.