A One-Man Marte Partay Between the Bases

This article originally appeared on the Pirates blog Bucco’s Cove.

“Speed kills.” –Al Davis

Starling Marte is having a hell of a season stealing bases and this is one of the things that should have propelled him into the All Star Game without needing the stupid final vote. He is the top baserunner in the NL this year, he’s second in the league with 25 stolen bases, and he has a better percentage than the leader Jonathan Villar.

A recent game against the Cardinals gave a strong piece of evidence of Marte’s preternatural baserunning ability when he stole second base with Carlos Martinez pitching in the sixth inning:

The Pirates’ announcers commented on the fact that people very rarely steal off of Martinez. I went to look at the numbers: in 399 2/3 innings since entering MLB, Martinez has yielded only 10 stolen bases in 19 attempts. I think the 19 attempts is really indicative of his abilities to control the running game; people just don’t even try to run on Carlos Martinez. Martinez ranks 36th among all pitchers in SB/IP who have thrown at least 200 innings since 2013, which is decent. However, if we limit ourselves to looking at only righty starters over this time period (since it is much harder to steal against lefties and game circumstances are a bit different between starters and relievers), Martinez ranks 13th among pitchers with the same innings restrictions. (I’m not including tables for all of these stats, but if you want to see for yourself, mosey on over to the Baseball Reference Play Index, where all of this data comes from.)

Martinez has really shut down the running game since becoming a full-time starter in 2015, however. Over that time period, he ranks fourth among all pitchers (lefty, righty, starter, and reliever alike) having at least 250 innings in SB/IP, yielding only four SB in nine attempts over 282 innings.

Rank Player SB IP SB/IP
1 David Price 1 336.2 0.00297
2 Wade Miley 2 281 0.00712
3 Yordano Ventura 3 250.2 0.01199
4 Carlos Martinez 4 282 0.01418
5 Chris Tillman 4 279.1 0.01433
6 Wei-Yin Chen 5 290 0.01724
7 Danny Salazar 5 284 0.01761
8 Johnny Cueto 6 334.1 0.01796
9 Chris Sale 6 328.2 0.01828
10 R.A. Dickey 6 324 0.01852

(Note: If you bump this down to 150 innings to get more relievers on the list, Martinez is still in the top 10 for SB/IP.)

Of the four pitchers ahead of him in the table, two are lefties. (Sidebar: How the hell is R.A. Dickey on this list given the fact that he throws a knuckleball? It seems like it should be really easy to steal on him given that.) Martinez is similarly ranked (fifth) if you look at SB/Total Baserunners over the same period; in short, Martinez is really, really good at controlling the running game.

Furthermore, reigning eight-time Gold Glove winner Yadier Molina was behind the dish attempting to throw Marte out. Molina ranks first among all catchers since 2002 in his ability to control the running game by the defensive metric rSB. Obviously Martinez’s ability to prevent the stolen base is helped by having Molina behind the dish, but the combination of these two has been deadly over the past season and a half, making Marte’s accomplishment all the more impressive.

The Martinez/Molina duo (and Martinez in general) has only allowed one other stolen base this season so far. Who was it? None other than Bartolo Colon! Actually, I’m kidding, it was Starling Marte, which is almost as crazy! He has the only two stolen bases this season against a guy who only gave up two all of last season. These are also the only two attempts against Martinez all season. On May 6, after a bunch of false starts, pickoff moves, foul balls, and laughs between Molina and Marte, he finally got his stolen base:

The thing I find most entertaining is how loose everyone seems, goofing off and laughing about the play that just happened, which seems relatively rare in this day of boring interviews and generic soundbites. Molina had a good laugh about that one, but he was pretty upset about the more recent stolen base.

There’s nothing to be mad about, though; Martinez and Molina simply got burned by the best baserunner in the game right now.


Kris Bryant Continues to Hit

Ever since he was taken with the second pick in the 2013 draft, the spotlight has continually followed Kris Bryant. After mashing his way through the minors in less than two years, Bryant had a spectacular rookie season with a slash line of .275/.369/.488 with 26 homers and a 136 wRC+. Deservedly, he was rewarded with the NL Rookie of the Year award. Although he did strike out over 30 percent of the time, he showed great plate discipline along with immense power. His 6.5 WAR ranked 10th among major league hitters. However, this year he has taken his production a step further.

With his league-leading 25 home runs to go along with his slash line of .278/.370/.578, one major change sticks out. Although his average and on-base percentage remain around the same as his 2015 totals, his slugging percentage has taken a huge jump. Halfway through the season, he is one home run shy of last year’s total and around half of his hits have gone for extra bases (44 out of 87). He’s also cut down on his strikeouts while making even more hard contact than he did last year — shown by his 42% hard-hit rate which will allow him to continue to tap into his power.

One noticeable change sticks out in his batted-ball profile. Although his ground-ball, line-drive, and fly-ball rates remain relatively constant, Bryant has pulled the ball more in his second big-league season. This has caused more of his fly balls to leave the park. Taking a look at his 2016 home-run spray chart, you can see that all of his home runs have been pulled.

bryant-2016

Source: FanGraphs
Next take a look at his 2015 home-run spray chart.

bryant-2015

Source: FanGraphs
Most of his home runs have been in the same general area with the exception of a few opposite-field home runs to right. Since he has been pulling the ball with more authority in 2016, the balls that he pulls in this sweet spot to left will allow him to continue to leave the yard at a ridiculous rate. With his picturesque swing to go along with his strong hands and 6-foot-5, 230-pound frame, swings like this

Kris Bryant Homer

…will continue to be common for Cubs fans to see from Kris Bryant.

However, it would be foolish to simply call Bryant a home-run hitter when in fact what makes him so special is his all-around hitting ability to go with this insane power. He walks, hits the ball hard, and his only flaw is his propensity to strike out — and even that he has improved upon this year. A two-time All Star already with 4.3 WAR this season, he ranks fourth among major-league hitters and first among NL hitters in WAR while also possessing a 149 wRC+. At this point, if the NL MVP is going to go to a player not named Clayton Kershaw, Kris Bryant deserves to be the one holding up the trophy. But the trophy most important to him is the one won at the end of October. With the Cubs holding a comfortable lead atop the NL Central, Bryant looks destined to lead them on a deep playoff run with the hope of finally shattering their 108-year-old curse.


Meet the Matz: Of Bone Spurs, Paychecks, and Pennants

On June 30, Mets manager Terry Collins sent left-hander Steven Matz to the mound to face the Chicago Cubs. Matz turned in a modest performance, striking out six in 5 1/3 innings while surrendering two homers. Not a terrible outing, but a club as offensively challenged as the Mets can only afford so many starts like this. What made the outing of more than the usual interest was that this was Matz’ first appearance after the world learned he had a bone spur in his left elbow.

Bone spurs are not generally in and of themselves debilitating, but they can inflict significant pain. And since pain is your body’s way of saying “don’t do that again, you stupid git,” the pain a bone spur causes may in turn cause other changes to the pitcher’s usage patterns and delivery. Those changes might end well, or they might not. A cascade of other injuries and mechanical problems can follow.

So a bone spur presents player and team with a choice: the player can pitch through the injury, at reduced and perhaps increasingly decaying effectiveness, or opt for surgery, which resolves the problem but sidelines the player for several months. In Matz’ case, surgery could doom his season.

If Matz were an entirely independent actor, surgery would seem the rational choice. Like all players, Matz’ overriding goal is to get The Contract: the multiyear 7-8 figure deal that will provide financial independence for Matz and his family for as long they subsist on this benighted orb. (Matz will tell you his overriding goal is to win a World Series, but that’s probably number two on his list.) By skipping the rest of this season and coming back healthy next year, Matz probably boosts the odds of making it to The Contract before critical elements of his body begin to rebel.

But Matz is not truly independent: the Mets organization, his teammates, and Baseball Tradition all exert substantial influence. Peer pressure may play a significant role here. Even John Smoltz, one of the most intelligent minds in baseball broadcasting today, discussed Matz’ bone spur (and Noah Syndergaard’s apparently smaller one) in a recent Fox broadcast with the quit-whining-and-rub-some-dirt-on-it machismo that would hardly have been out of place a century ago.

Smoltz said the pitchers can deal with bone spurs by changing their pitch selection, and there is some evidence Matz is doing just that. He used his slider at a 15% clip in April and May; in June he abandoned it. His velocity, however, is essentially unchanged, and he’s using his other pitches more or less as he always has.

So maybe Matz is reacting to the pain, maybe not. But he would certainly pay a price if he seemed to be reacting in a highly visible way. For all the analytical advancements of the past quarter-century, players are still expected to suffer in silence. Those who don’t may “lose the manager’s trust,” and have fewer opportunities to establish that they merit The Contract. I’m no fan of conformity, but it is sometimes the economically rational decision.

Mets’ GM Sandy Alderson views the Matz dilemma through a substantially different risk-assessment prism. As long as the Mets have a good shot at the playoffs, Alderson has little incentive to see Matz hit The List for any significant length of time, at least unless and until his performance seriously deteriorates. The supposedly pitching-rich Mets have nothing behind their current top five starters. No, not even Rafael Montero, who is putting up a 6+ ERA in Las Vegas this year. What stinks in Vegas stays in Vegas.

Further concentrating Alderson’s mind are the Mets’ playoff odds. This is a borderline playoff team; FanGraphs says the Mets have a 56% chance of making the playoffs, but most of that 56% just puts the Mets in the wild card. Still, that’s a five-point jump from last Wednesday, before the Mets ripped off a four-game sweep of the 1927 Yan– er — I mean, the Cubs. But sadly for the Mets, the division-leading Nationals have also been swatting aside opponents with cavalier disregard — most of the Mets’ playoff gain came at the expense of the Fighting Lorians.

Like Matz, Alderson faces a tough decision: how to balance the future against the now. The Mets are neither clearly bad enough to play for next year, nor clearly good enough to play for this one. Their roster is largely set for the near future; of their significant contributors only Neil Walker will walk at the end of the season, likely to be replaced by Dilson Herrera. The Mets are ninth in attendance, 14th in local television revenue, and 16th in payroll. They are also first in BMI (Bernie Madoff Influenza). This isn’t a team that can likely add a lot of payroll, particularly if they intend eventually to fork over some major bitcoin for at least some of the current starting rotation.

The Mets have three prospects in MLB’s top 100, but just one (Dominic Smith) in the top 50, and Smith barely clears that hurdle at #45. Although showing some increased power this year, Smith threatens to develop into the next James Loney, a threat so grave that Alderson fended it off (momentarily at least) by bringing in the current edition to fill in for the wounded Lucas Duda at first. Young shortstop Gavin Cecchini is raking at AAA to the tune of an .871 OPS, but he only recently found the rake in the back of his garage behind the broken foosball table; his career minor-league OPS is a pedestrian .745. Alderson is showing his faith in Cecchini by filling the Mets’ yawning chasm at third with an incipient public relations disaster.

Alderson has a little time. Playoff chances can swing wildly during the season, as he discovered last year. In three weeks he’ll have a better idea of where the Mets stand, and can then make a decision regarding Matz. If the Mets collapse, then the incentives for both team and pitcher come into alignment, and Matz will likely have surgery. If the Mets surge (they did, after all, finally find Nimmo), then he’ll ask Matz to shut the hell up and rub some dirt on it. Unlike some of his co-rotationists, Matz isn’t a superhero. He’ll do what he’s told, while watching with trepidation as The Contract recedes into the future.


The Good and the Bad: David Price Isn’t Sinking

You know his story: David Price is a $217-million man with a 4.74 earned run average, and the people of Boston aren’t happy. It’s another Crawford-Sandoval-Ramirez waste of money. Things are headed downhill for the 31-year old veteran. Or are they?

First, the bad news: the 2016 version of David Price has been worse than the 2015 David Price, and way worse than the top-caliber pitcher Boston signed him to be. And the ERA shows it.

The suspect is pitch selection, and the culprit is a sinker that doesn’t sink. Price has a two-seam fastball that over his seven-year career he has thrown some 30% of the time. In his prime, it clocked in at 94-95 mph, but since then he’s dropped almost two mph.

Usually, that level of velocity leak wouldn’t be a big deal, because if there’s enough movement and deception, batters will be fooled either way. But Price’s sinker is different.

Brooks Baseball reports that “His sinker has well above-average velocity, but has little sinking action compared to a true sinker and results in more fly balls compared to other pitchers.” Uh-oh. “Little sinking action?” There needs to be at least some element of vertical movement for a sinker to be fully effective, or, in Price’s case, a little extra velocity. But now he has neither.

The results show it. Last month, he surrendered 10 home runs, more than the previous two months combined. Also in June: 31% of his pitches were sinkers, nearly 10% more than the month before. Coincidence? I think not. He’s also allowing a .241 Isolated Power on sinkers, only three points less than Mike Trout this season. And maybe the most convincing statistic: hitters are pulling the ball 10% more than they did last year, which means they are making more solid contact and not having to stay back on his fastball. Price’s pitches are slower, and it’s making a difference.

Why is he losing velocity? There’s two possibilities and they point in completely opposite directions. The first is age. Price is 31 and he’s nearing the point where most starting pitchers start to fall on the aging curve and eke velocity. If this is the case, it’s going to be a long seven years for the Red Sox. But there is another possibility. Price has played in Tampa Bay for most of his career, where the temperatures are never 40 degrees like Boston in April. It’s entirely possible that the cold ‘froze’ him up this spring and as the season continues, he’ll regain his speed. Most likely, it’s a combination of both. But either way, it’s never a good sign when pitchers slow down.

Price has always gotten away with leaving sinkers up in the zone because they showed 94-95 mph on the radar gun. But now hitters are seeing 92mph fastballs fly straight down the middle of the plate and stay there.  Why doesn’t he just put the ball on a tee? Nine out of 10 major-league hitters will knock that pitch into the stands every time. Just look at the stats: He’s surrendered just two fewer home runs than he did last season even though he’s pitched 112 fewer innings (2015: 17, 2016: 15), and he’s allowed an average of 1.25 home runs per nine innings, which is 32 percent worse than his career average (0.84). Sinkers are sending the man to his grave.

They’re also killing his ERA. 38% of his earned runs are from home runs, and if you set his home runs to eight instead of 17, his ERA would be 4.01 instead of 4.74, a 0.73 difference. (8 is the number he had allowed last year at this point in the season.) In fact, his strikeout and walk totals are even better than last season, but the home runs negate all of it.

But we can’t blame everything on the sinker, either. Price has definitely been unlucky this season. His home run to fly ball ratio is 15.5%, an unsustainable mark, his .323 BABIP .035 more than his career average, and his LOB% 10 percent less than the 2016 league average. These will balance out in time. But his sinker is the real problem.

The only way to truly limit home runs is to limit fly balls, and for Price, the only way to limit fly balls is to stop throwing sinkers that don’t sink. The solution is (1) throw harder, or (2) find another pitch to replace his sinker. Option one is still TBD. Option two could be filled with either a change or slider — two pitches that he has used to complement his fastball but never to the level that he uses his sinker. The outlook is grim either way.

Price is still a very experienced pitcher, and once his HR/FB, LOB%, and BABIP rates come down to earth, things will even out. But if he wants to be successful for the Red Sox for the entirety of his stay, there’s a longer-term issue at stake, and if his velocity continues to leak, I’m not sure what type of David Price we’ll be looking at a year from now.


Inverse Clayton Kershaw

Clayton Kershaw is great. Really really great. Maybe hurt — but definitely great. But I’m not interested in examining Clayton Kershaw; I’m interested in examining Inverse Clayton Kershaw. I want to find the pitchers that have been most unlike Kershaw during the last calendar year. Kershaw has been the best — I want to find the worst.

Clayton Kershaw vs. League Average – Past Calendar Year
ERA FIP xFIP K% BB% HR/9 SwStr%
Clayton Kershaw 1.50 1.56 2.08 33.8% 2.9% 0.36 16.1%
League Average 4.13  4.11 4.07 20.8% 8.5% 1.11 10.0%
Difference -2.63 -2.55 -1.99 13.0% -5.6% -0.75 6.1%
Inverse Kershaw 6.76 6.66 6.06 7.8% 14.1% 1.86 3.9%
Data pulled 6/29/16

So wow. Did I mention Kershaw is great? Anyway, time to find Inverse Kershaw. First, I want to point out that the players below are still incredible at baseball. They are some of the most elite in the world, way better than all of us. Caveat aside, I’ll now examine the pitchers over the past calendar year who are most unlike Kershaw in each of the stats above — i.e. if Kershaw’s ERA is 2.63 below league average, whose is 2.63 above league average. When in doubt, I’ll defer to the guy with the most IP. At the end, I will name the Inverse Kershaw!

ERA

So, whose ERA has been a whopping 2.63 runs above league average? Coming in with an ERA of 6.75 we have Carlos Contreras. Contreras pitched 18.2 innings within the last year for the Reds out of the bullpen. You probably expected some 2016 Reds relievers to qualify, but Contreras posted these numbers exclusively in 2015 and then did not make the 2016 Reds bullpen. Yikes.

FIP

Noe Ramirez has worked to a 6.65 FIP in 24 IP for the Red Sox over the last year. Prior to 2016, then lead prospect analyst Dan Farnsworth said of Ramirez, “his stuff likely isn’t good enough to be more than bullpen filler.” Maybe not even that good.

xFIP

Well I’ll be damned. With 18.2 IP with an xFIP of 6.05 out of the Reds bullpen we have…Carlos Contreras.

K%

With a K% of exactly 7.8%, we find the final 13 IP of Dodger right-hander Carlos Frias‘ 2015 season (he hasn’t pitched yet in 2016). As a Cistulli darling, I imagine this is just a speed bump in Frias’ journey to becoming a Cy Young winner.

BB%

In 39.2 IP, Elvis Araujo of the Phillies has walked 14.0% of batters faced. In related news, Araujo was optioned to Triple-A Lehigh Valley on June 26.

HR/9

Matching our criteria exactly with 1.86 HR/9 allowed in 67.2 IP is Toronto starter Drew Hutchison. This figure doesn’t factor in his excellent work in Triple-A (.77 HR/9 allowed), and according to the Toronto Sun, Hutchison figures to be called up soon. Hopefully he can get the gopheritis under control and contribute for the Jays down the stretch.

SwStr%

I made a judgement call here. The pitcher with the most IP within 0.2% of the required 3.9% SwStr% is Jon Moscot and his 4.1% SwStr%. Moscot has posted that rate across 21.1 IP in five starts for the…gulp…Reds this year. Poor Reds fans.

The Inverse Kershaw

It is all fine and good (bad) to post inverse Kershaw numbers in one category, but I wanted to know the single pitcher that was most unlike Clayton Kershaw. More accurately, I wanted to find the pitcher whose performance has been as far below average as Kershaw’s has been above average. To do this, I began with a sample of all pitchers appearing in MLB over the last calendar year. I then calculated the number of standard deviations each of their component statistics were from the Inverse Kershaw numbers in the table above. The pitcher with the lowest sum of standard deviations will be named the Inverse Kershaw. This is exactly the methodology used by Jeff Sullivan for his pitch comps.

And the winner (loser?) is….Matt Harrison, formerly of the Texas Rangers, currently of the Phillies Disabled List. You may remember Harrison as the salary dump portion of the Cole Hamels to the Rangers trade. You will hopefully now remember him as the past calendar year’s Inverse Kershaw. The final numbers are below.

Clayton Kershaw vs. Matt Harrison – Past Calendar Year
ERA FIP xFIP K% BB% HR/9 SwStr%
Clayton Kershaw 1.50 1.56 2.08 33.8% 2.9% 0.36 16.1%
League Average 4.13  4.11 4.07 20.8% 8.5% 1.11 10.0%
Inverse Kershaw 6.76 6.66 6.06 7.8% 14.1% 1.86 3.9%
Matt Harrison 6.75 6.07 5.66 7.3% 8.7% 1.69 3.3%
Data pulled 6/29/16

So there you have it, the pitcher coming closest to being as far below average as Clayton Kershaw has been above average over the last year is Matt Harrison — the Inverse Kershaw. Just for fun, here is the same table as above, subbing out the 2016 Reds Bullpen for Matt Harrison.

Clayton Kershaw vs. Matt Harrison – Past Calendar Year
ERA FIP xFIP K% BB% HR/9 SwStr%
Clayton Kershaw 1.50 1.56 2.08 33.8% 2.9% 0.36 16.1%
League Average 4.13  4.11 4.07 20.8% 8.5% 1.11 10.0%
Inverse Kershaw 6.76 6.66 6.06 7.8% 14.1% 1.86 3.9%
2016 Reds Bullpen 6.08 6.02 5.16 18.9% 11.9% 1.95 9.7%
Data pulled 6/29/16

Poor Reds fans.


Robbie Ray: Better, But Also Worse

Let me start off by pointing you to this excellent article recently penned by eyesguys1 in which he also analyzes 2016 Robbie Ray.  I write this now not to steal his thunder, but to report some pretty interesting Robbie Ray trends I’ve discovered (and because I was almost done with this when I saw his article).

Robbie Ray put together a pretty successful rookie campaign last year — he pitched 127.2 innings with a 3.52 ERA to go along with a 3.53 FIP and 2.1 WAR.  It’s not going to blow anyone away, especially considering last year’s rookie class, but it was a good season nonetheless.

He’s currently sporting a rough 4.69 ERA and 3.96 FIP, way up from last year’s totals.  He’s ramped up the velocity on all his pitches except the sinker, so you would think he’d be doing better than in 2015, or at least not a full run worse.

Robbie Ray Velocity Increase
2015 2016
Four-Seamer 94.22 94.78
Sinker 93.70 94.39
Changeup 84.87 87.42
Slider 83.37 85.87

Likewise, his K-BB% (one of the best in-season performance predictors) has gone up.  While he has walked 9% of batters he faces, his 25.6% strikeout rate is good for 17th among qualified pitchers.  What’s making the difference?  Home runs.

It’s fair to say he’s had a homer problem this season.  His HR/FB rate is a lofty 15.8%, up nine points from last season, and it’s worth noting that his xFIP has therefore improved.  His .358 BABIP appears to indicate that he’s been unlucky, but Andrew Perpetua’s xBABIP formula  says that his expected BABIP is still a bit high at .323.  What gives?

His platoon splits give us a clue, because they’re rather striking.  Left-handed hitters have a .282 wOBA against him, while right-handers are crushing him to the tune of a .365 wOBAA.  He had somewhat of a platoon split last year, but it wasn’t anything like this.  He’s actually gotten better against lefties by almost the same degree as he’s gotten worse against righties.  Why?

Against lefties, he’s been nothing short of dominant.  He’s throwing mostly the same mix of pitches against them as he did last year (mainly the four-seamer and slider, with some sinkers thrown in) yet his wOBAA is down to .282 from .309 in 2015.  His numbers versus lefties may be nothing more than randomness associated with small sample sizes since he has faced only 93 of them this season (but still only 141 last season).  It’s not beyond belief that a left-handed pitcher is doing well against left-handed hitters, especially when you consider his strikeout and walk numbers.  He has struck out 28% of the left-handed hitters he’s faced and walked just 5.4%, so his K-BB% is 22.6% (up from 17% last year).  Plus, his home-run problem isn’t so bad for left-handers as he sports a close to league average 11% HR/FB rate.  Since Ray hasn’t faced many southpaws this year, it’s harder to know what exactly he’s doing, if anything, to improve against them.  What jumps out the most is that he’s getting significantly more whiffs on the slider and sinker, so that could explain the increase in strikeouts, as could the uptick in velocity.  Regardless, K-BB% is one of the best in season predictors available, so he’ll likely continue doing well against lefties going forward, even if he isn’t dominant.

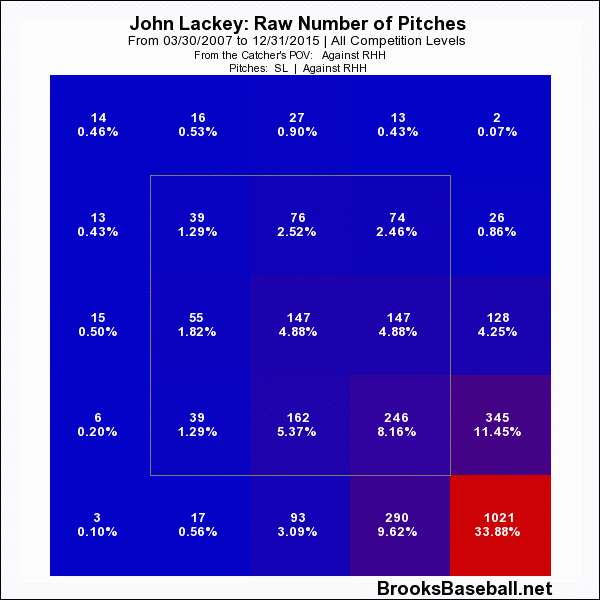
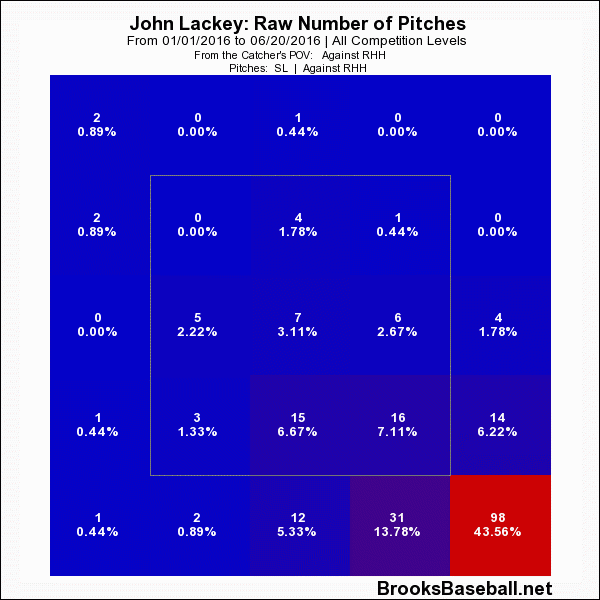
Right-handers are where he’s struggling.  Though his K-BB% against them hasn’t been bad at all (14.8%), he’s given up a rather high 16.4% HR/FB rate versus righties (likewise, his xFIP is a bit lower).  This represents a bit of a homer problem, especially considering he only had a 7.1% HR/FB RHH split last year.  He’s been tinkering with his pitch mix against opposite-handers, so perhaps there’s a clue there.  Take a look at his home-run rates for balls in the air (both fly balls and line drives) for his four main pitches (excluding the curve) both this season and last from Brooks Baseball:

Home Runs on Balls in the Air
Four-Seamer Sinker Changeup Slider
2015 3.03 3.57 0.00 12.50
2016 7.69 11.76 25.00 11.11

While he’s given up some home runs on the four-seamer, the main culprits are the sinker, slider, and changeup.  The most striking example is the changeup, which leaves the yard 20% (!) of the time when it’s hit in the air.  If you think about it, it makes sense that a changeup hit in the air might often leave the yard, but I couldn’t find many with a HR rate on it like to Ray’s.

Bluntly put, his changeup has been bad.  According to the pitch-type linear weight leaderboards, he’s had the league’s worst changeup by wCH at -7.3 and the fourth worst in wCH/C. (Something interesting: second-worst in wCH went to fellow D-Backs starter Patrick Corbin.)  He threw his changeup about 13% this April and increased that to 15% in May.  The results weren’t pretty; righties posted a .466 wOBAA in April and .330 wOBAA in May against his change.  For a pitch typically with reverse platoon splits this is not good, especially considering righties’ wOBAA (on a month-by-month basis) against it peaked at .312 last year.  He’s been locating it down and out of the zone, and that’s precisely where it’s gotten hit hard.  It’s been getting more whiffs and ground balls, but when it is hit in the air, it’s gotten blasted (like many of Ray’s pitches).

Thankfully, through his past four starts he’s ditched the change completely, instead leaning more heavily on the four-seamer and slider.  He did the same thing towards the end of last season, so maybe it’s gone for good this time.  He changed his change this year, but righties simply aren’t buying it.

But the changeup isn’t the only pitch he’s played with.  Last season saw a steady trend where Ray threw the four-seamer less and sinker more as the season went on.  That trend continued into early June of this season.  In fact, save one start against San Diego, he threw his sinker significantly more than his four-seamer against right-handers (he doesn’t throw it much to lefties) in four starts from mid-May to mid-June.  Before and after this period he threw primarily the four-seamer, so dividing up his season into three periods reveals some interesting trends.

Robbie Ray’s 2016 Sinker Against RHH
April 8-May 10 May 11-June 5 June 6-June 27
Four-Seamer % 45.31% 27.43% 54.64%
Sinker % 24.41% 40.90% 23.56%
BIP% (SNK) 14.88% 19.23% 20.41%
GB% (SNK) 36.84% 40.00% 45.00%
wOBAA (SNK) 0.486 0.401 0.447

He’s been getting progressively more ground balls as the season goes on, and more sinkers are being put into play.  Looking at his location, he spotted it further up and out of the zone away from right-handers.  In that first period, he gave up seven walks in 20 at-bats, while since then he’s given up just six walks in 59 at-bats, even though he’s been throwing it out of the zone more.  Right-handers are simply swinging at it more and putting it in play more and more often.  And despite throwing out of the zone more, he’s getting hurt in the zone more often.  Maybe the pitches he’s making in the zone are really hittable.  Maybe I’m grasping at straws and it’s all randomness.  wOBAA has been up and down (and is still really high), so it’s hard to tell if anything he’s doing is making a difference.  He is tinkering with the sinker and getting more ground balls, so it’s just a matter of limiting the damage on hits that aren’t ground balls.

Since he dialed back his sinker, he’s been relying more on his four-seamer.  This is promising because in terms of wOBAA it’s been his most effective pitch against right-handers next to the curveball (which I’ll get to soon).  He’s throwing his four-seamer the fastest he has in his career and it’s missing a lot more bats.  As long as he keeps it up, he will hopefully trend in the right direction.

But I’d be remiss if I didn’t mention Robbie’s most interesting pitch: his slider-thing.  Okay, it’s a slider, and it’s probably more conventional than I’ve convinced myself while writing this.  Take a look:

It has primarily 12-6 movement, and it’s only added more movement since last year:

Slider Movement
Horizontal Movement (in.) Vertical Movement (in.)
2015 1.42 1.71
2016 1.88 2.96

He mostly throws it to lefties, but he’s thrown it 12% of the time to right-handers, so it’s worth examining.  He’s also been throwing it more since he ditched the changeup.  Righties have a 0.312 wOBA against it, which isn’t spectacular, but it’s a modest improvement from the .352 mark last year.  But the most striking thing about his slider is that right-handers are hitting it on the ground 58% of the time!  That’s an 18-point improvement from 2015.

His uptick in grounders on the slider could be due to a number of things.  As I noted, he’s throwing it faster.  About 2 MPH faster, and it sits in the 85 MPH range on average.  He likes to spot it low and inside just off the corner of the zone to righties, and he seems to be hitting that location a bit better now.  But what jumps out most to me is that while he’s throwing it for strikes less, righties are swinging at it at the same rate, so it stands to reason that they’re making worse contact.  Most of the damage appears to come when it’s in the zone and up.  When they do hit it in the air (fly balls and line drives), they hit it out 11% of the time.  On average, he threw the slider more in June than in April or May and he’s getting fewer fly balls on it than he did in May, so it appears to be trending in the right direction.  And if you remember the chart above, he has lowered the HR/(FB+LD) rate since last season.  So if he can keep it down, the slider should be a very effective weapon against righties.

One last thing I’ve been avoiding: the curveball.  Brooks Baseball says he’s throwing one, while here at FanGraphs it’s lumped in with the slider.  It could be just a misclassified wonky slider.  He’s only thrown it 61 times this year, so it’s hard to know what to make of it, but see for yourself.  Here it is catching Hunter Pence looking:

Ray to Pence curveball

And here’s a slider for reference (on the very next pitch mind you):

Ray to Pence slider

The two have similar sliding action, it’s just that the top one looks more curve-y.  It’s a little hard to me to tell the difference by looking at them (though the movement profiles at Brooks are a little different).  It looks like he may have a higher release point on the second pitch, which would be consistent with a curve.  At Brooks his release point for the curveball is a little higher, albeit not by much.  It’s a trend worth keeping an eye on.

If he really has added a curveball to his repertoire for good, the results look promising.  So far, he’s gotten almost 50% whiffs per swing, a 58% ground ball rate, and hasn’t allowed a single right-hander to reach on it (and only one lefty).  That’s just 10 at-bats, but five of those resulted in strikeouts.  Again, it’s a small sample size, but if these results continue, he may have found his pitch to beat the platoon split.

Bottom line, Robbie Ray has been far worse against right-handed hitters this year because of his sinker and changeup.  He’s ditched his changeup, which is probably for the best.  His sinker has been a mixed bag, but he is getting more ground balls.  What’s more, he’s been throwing his four-seamer — his best pitch — a lot more often, and he’s been getting tons of ground balls.  If he sticks to the fastball and keeps the slider down, he shouldn’t get torched by righties like he has.  And he may even be developing an effective curveball to get them out.

Against lefties, it’s a little simpler.  He’s doing largely the same things, just missing more bats and striking out more guys.  It’s hard to say with such a small sample size, but it’s a reason for optimism.

In 2016, Robbie Ray has been better, but also worse.  However, recently he’s shown some good signs that could make him better, and also better.

Certain stats and tables courtesy of Brooks Baseball.  Gifs from Baseball Savant and Inside the ‘Zona.


Over- and Under-achieving FIP

I have always been fascinated by pitchers that consistently post ERAs that differ significantly from their FIPs.  As a Braves fan, this interest is particularly relevant in the valuation of ace/not ace Julio Teheran.  Unfortunately for me — but very fortunately for readers — Eno Sarris tackled the specific case of Teheran and the more general case of FIP-beaters with high pop-up rates here before I could finish this post.  Regardless, the research is done, and I believe it is still relevant.

While Eno focused on a specific subset of FIP-beaters in his discussion of Teheran, I wanted to examine pitchers with extreme ERA/FIP gaps more broadly.  I included not only pitchers who overachieved based on FIP, but also those who underachieved.  I began with a sample of all pitchers since 1960 who reached 500 IP through age 25.  I then calculated the difference between ERA- and FIP- for each pitcher (FIP overachievers would have a negative number, underachievers positive).  I selected these metrics 1) because they were readily available here at FanGraphs, and 2) because I was interested in the gap relative to league average — hopefully stripping out any differences in era (should any even exist).  

I chose this age cutoff so that I had a sample of three “in-prime” seasons afterwards (age 26-28) to compare to the initial numbers below.  After I found Z-Scores for all of the u25 pitchers, I set the threshold for over/underachiever at +/- 1 standard deviation from the mean, which turned about to be an ERA- / FIP- difference of right around eight.  It is certainly arbitrary, but I felt like this adequately separated the sample so I could examine the ends of the population.

Extreme FIP Over/Underachievers
Group ERA- minus FIP- n
ALL u25 -.02 297
Overachievers (Z<1) -11.91 48
Underachievers (Z>1) 11.35 47
Since 1960, min. 500 IP through age 25.  Average ERA- minus FIP- weighted for IP.

As you can see, the spread in ERA- between over/underachievers is pretty large.  Overachievers posted ERAs 12% lower (relative to league average) than expected based on FIP, while underachievers posted ERAs over 11% higher (relative to league average) than expected based on FIP.  The group as a whole posted an ERA- nearly identical to its FIP-, which is more in line with DIPS theory expectations.

The big question remains: how “sticky” is the gap between ERA- and FIP-?  To determine this, I compared the ERA- / FIP- gap for these same samples from age 26-28.

Extreme FIP Over/Underachievers Age Comparison
Group u25 E-F- o25 E-F- Raw Diff Diff Adj. for Sample Avg. % Retained
ALL -.02 .42 -.44
Overachievers (Z<1) -11.91 -3.41 -8.50 -8.06 32.3%
Underachievers (Z>1) 11.35 4.64 6.71 7.15 37.0%
Since 1960, min. 500 IP through age 25.  Average ERA- minus FIP- weighted for IP.

From age 26-28, the sample as a whole posted an ERA- above its FIP-.  Even adjusting for that change, the over/underachievers both regressed heavily towards the mean, retaining 32.3% and 37.0% of their difference in ERA- and FIP- respectively.  While regression is powerful, both samples did continue to post differences in ERA- and FIP-.  The overachievers continued to post lower ERAs than FIPs, while the underachievers kept on allowing more runs than FIP suggested they deserved.  Interestingly, the percentage of the gap retained is similar for over and underachievers, though it is slightly smaller for FIP beaters.

The methodology isn’t perfect, but I found the results very compelling.  It does seem like consistently beating FIP is partially skill (which jibes with Eno’s results), and consistently allowing ERAs above FIPs is more than just bad luck.  As usual, this analysis leads to more questions than answers.  How many innings are needed before one can be considered a DIPS outlier?  Do FIP underachievers actually regress less than FIP beaters?  How does age-related decline affect the gap in ERA- and FIP-?  As the sample for a DIPS outlier grows, does he retain more of the difference going forward?  Etc.  I may try to dive into one or more of those questions later.  For now, hopefully this analysis is helpful as you consider how likely a pitcher on your team is to continue over/underperforming his FIP.


Bryce Harper Looks Average

Bryce Harper is in a slump. Not a daily, weekly, or monthly slump, but a slump that has been going on since the beginning of May — nearly two months. Coming off a breakout season in 2015, Harper seemed poised to be even better this year. In April he had a .714 slugging percentage, a 1.121 OPS, and a 181 wRC+ (creates 81% more runs than the average hitter). No pitcher wanted to pitch to him. On a day during the first week of May, Harper went 0-0, with six walks and one hit-by-pitch. Since then, it seems like walking is the only thing he’s done well. In May, he hit .200/.363/.785 with a 105 wRC+. In June, he’s hit .262/.369/.720 with a 95 wRC+(though he did post OBPs of .422 and .351 in May and June, respectively). In essence, Harper has produced like an average major-league hitter over the last two months. The only problem with that is that Harper is widely regarded as not an average MLB hitter, but one of the best (if not the best) hitters in all of baseball.

Sure, hitters go into slumps all the time. It’s no reason to get worked up about a bad spell here and there. Remember, baseball is a game where a hitter fails 70% of the time and is considered a Hall-of-Famer. There are going to be 0-4 days.

But two months seems like an awfully long time. And it’s my job here to find out why. So let’s take a look.


The first thing that stands out when examining Harper under the microscope of a computer is his batting average on balls in play (BABIP). He’s hitting .257 in said category — well below his career average of .323 and well below the 2016 MLB average of .300. BABIP does reflect the ability of the hitter, but it also depends significantly on defense and luck. A batter whose BABIP is well below his career and league average may just be getting unlucky — whether that is from hitting the ball directly at defenders or defenders making spectacular plays.

So, is Harper hitting the ball with the same authority he did last year (which would confirm the idea that he’s getting unlucky)? Not quite. In the following table you can see that the number of line drives he’s hit (LD%) is down 7% and number of balls he’s hit softly (Soft%) is up 12%. He’s hitting fewer line drives and more fly balls (FB%) — but those fly balls aren’t turning into home runs, as his HR/FB% is down from 27% to 17% (i.e. last year for every 100 fly balls that Harper hit, 27 of those were home runs. This year he’s hitting 17 home runs for every 100 fly balls).

Screen Shot 2016-06-28 at 11.53.23 AMScreen Shot 2016-06-28 at 11.54.42 AM.png

So, Harper is hitting more soft fly balls that are getting caught by outfielders, and fewer line drive that find gaps. Could this be a result of his discipline at the plate — his ability to differentiate strikes from balls and to swing accordingly? There are two things I want you to look at: Z-Swing% and O-Contact%. They sound confusing but they’re simple to understand. Z-Swing% is the percentage of strikes the batter swings at. O-Contact% is the percentage of balls outside the strike zone that the batter makes contact with.

Screen Shot 2016-06-28 at 12.06.25 PMScreen Shot 2016-06-28 at 12.06.42 PMScreen Shot 2016-06-28 at 12.06.50 PM

You can see the difference between last year and this year. Harper is swinging at fewer strikes (5% less) and making contact with more balls outside the strike zone (5% more). That would explain why he’s hit more balls softly this year — he’s making weak contact with pitches outsize the zone. It’s much harder for a batter to hit a ball well outside the zone because it’s farther away from him. You can see the truth in this statement from the following graph (all qualified hitters from 2012-2016).

Screen Shot 2016-06-28 at 12.46.55 PM

The graph shows the relationship between isolated power (ability to hit for extra bases) and O-Contact%. It’s pretty clear that the more often a batter makes contact with a ball out of the zone, the less likely that ball with result in a double, triple, or home run. In 2016, Harper is somewhere right smack in the middle of all the dots (0.65 O-Contact%, .225 ISO).

Before I end, I just want to make it clear that Harper isn’t by any means a bad player. He’s a superstar, an All-Star, and probably the face of MLB — oh, and he’s 23. But, for lack of a better term, he’s performed like an average player the majority of this season, so I set out to find why. I think it’s mostly due to being unlucky with his deflated BABIP, but I’d also be cognizant of plate discipline if I were him. Pitchers do try to pitch around hm — just being a little more patient and swinging at more strikes and fewer balls wouldn’t hurt.


John Lackey Has a New(ish) Slider

Read any article on the Cubs and you’ll find praises on pretty much everything they’ve been doing this season. Rightfully so. Their MLB leading 49-26 record deserves some praise. The national spotlight has been focused on their young talent for the first couple months of the season, and even more so recently with the call up of top catching prospect Willson Contreras, who hit a home run on the first pitch he saw in the majors. That sums up how the season has been going so far for the Loveable (No Longer) Losers. But what about the vets? Not many people outside of Chicago have noticed just how good the second-oldest Cub, John Lackey, has really been this season. The 37-year-old has complemented the 1-2 punch of Jake Arrieta and Jon Lester very well this year and is quietly having one of the best seasons of his career: (courtesy of fangraphs.com and brooksbaseball.net):

John Lackey K% BB% SwStr% BA against SL
Career Avg 18.9 6.7 9 0.229
2016 26.6 6.6 12 0.109

His strikeout rate and swinging-strike rate are up (a lot), his opponents batting average against is down (a lot), and his walk rate has virtually remained the same. Plus there’s the fact that his slider has been pretty devastating this year. According to the wSL (weighted Slider) metric on FanGraphs, which uses run expectancy to evaluate the effectiveness of a pitch, he’s had the third-best slider in the league to date. Surprisingly, Lackey’s slider has been more effective than some of the most well-known sliders in the game, including Jose Fernandez, Justin Verlander, and Madison Bumgarner. It’s pretty incredible considering his slider has been nowhere near this good in the past. In case you were wondering what it looks like, here’s a clip courtesy of baseballsavant.com:

Lackey2016

That’s some nasty break coming in at around 87 MPH, according to MLBAM. Some nasty vertical break, to be specific. Taking a look at seasonal data from brooksbaseball.com, Lackey’s had an increase in average vertical movement this year.

(FanGraphs primer for those who aren’t familiar with Pitch F/X: Pitch F/X movements are based around a hypothetical pitch that has absolutely no spin, so when a pitch breaks “up”, it means that it does not fall as much on the way to the plate as a spin-neutral pitch would.)

Lackey_VertMovement

For the first time in his career, he is averaging negative vertical movement, without changing the horizontal movement or velocity on the pitch. That’s a borderline curveball. Typically, most breaking pitches with negative vertical movements are curveballs, but Lackey’s slider teeters right on the edge. Surprisingly, It’s not something he hasn’t done before. His minimum and maximum values for vertical movement have been pretty similar the last few years according to Brooks Baseball. And it’s not like he’s throwing in a different spot to righty hitters. His heat maps for his slider for his career and in 2016 look virtually identical:

LackeyHotZones2015

LackeyHotZones2016

He loves throwing it low and away. It does look like he’s been getting his pitch more in the dirt this year though. That’s a byproduct of how he’s been maxing out his vertical break this year, and without sacrificing anything else. How’s that, you might ask? That’s a difficult question.

Here’s one interesting theory. There’s only one other pitcher on that leaderboard that averages negative vertical movement. I’ll save you the suspense: it’s teammate Jason Hammel, who has a pretty effective slider himself. And according to the Pitch F/X data from brooksbaseball.com, their sliders are eerily similar:

2016 Slider Averages Vertical Horizontal Velocity
John Lackey -0.6 3.2 84.2
Jason Hammel -0.7 3.3 85.2

Hammel has had one of the best sliders in the past few years. Maybe he’s helped guide Lackey into using his slider more effectively. Purely speculation, but an interesting thought nonetheless. Regardless of his new(ish) changes and whether or not they’re here to stay, hitters better start adjusting to Lackey’s slider.


We’re In a Golden Age of the Lefty Fastball

The 2016 baseball season is well underway and we’re seeing an even more drastic version of the trends that we saw last year: There are more strikeouts, more home runs, and more challenges. And, notably, there has also been a steady increase in velocity across the league, assisted by the guys I’ll be highlighting here.

A “steady increase in velocity” might not be reason to stop the presses, but just soak in this Tweet real quick:


We’re basically seeing twice as many pitches thrown 95+ as we were in 2008. ¡2008!

Even left-handers, typically a step behind (always a bit of a quirky species, lefties), are chucking it. Across the league, lefties are throwing the ball 95+ mph just around 7.5% of the time. That’s way more often than the stereotype of the Tom Glavine-y, soft-tossing corner-nibbler would have you believe, but it’s 2016 and elite velocity isn’t just left to the elite pitchers anymore (Chris Sale is joined in that 95+ lefty fastball club by some guy named Buddy Boshers out of the bullpen for the Twins).

So…I’m not just interested in guys that throw hard; I want guys who throw hard and make the ball move, and I want them to be left-handed. (Truth: that lefty requirement is mostly an excuse so I can hopefully talk about Danny Duffy more, James Paxton for the first time, and because I already covered the right-handed side of things with my Charlie Morton post from the start of the season (The Unbelievable Emergence of Charlie Morton), and basically because lefties are more fun.)

A common refrain among pitching coaches is that movement is just as important as velocity. Velocity can get you to the majors, but big-league hitters will turn around 95+ fast if it’s straight. But when combined with some movement (and even better, control/command) 95+ is a high value commodity.

I’m after what I want to dub the best lefty fastball. Let’s start with the simple stuff: Who out there is throwing it 95+ most frequently? Note that the percentages here are for all pitches thrown, including the off-speed stuff.

Player Name Number of Pitches 95+ % of Pitches Thrown 95+
Zach Britton 152 93%
Sean Doolittle 118 84%
Aroldis Chapman 125 80%
Jake Diekman 111 73%
James Paxton 332 64%
Justin Wilson 81 62%
Josh Osich 58 57%
Enny Romero 86 54%
Tony Cingrani 102 53%
Jake McGee 32 51%
Danny Duffy 211 49%
Ian Krol 68 45%
Robbie Ray 208 41%
Felipe Rivero 61 35%
Sammy Solis 51 30%
Andrew Miller 52 30%
Andrew Chafin 6 26%
Carlos Rodon 90 23%
Blake Snell 45 23%

There are a number of relievers in there that I should probably get to know better. Zach Britton, Sean Doolittle, and Aroldis Chapman have all been flame-throwers for a while now; somehow their gas no longer brings the flicker to my eye that it once did. But Josh Osich and Enny Romero? Those are new guys that throw quite hard and are likely on their way to relevance.

The starters on the list are the most fun for me. James Paxton is there. Danny Duffy, too. But so are Carlos Rodon and Blake Snell. I’m not going to anoint any of these young guys just yet, but I’d venture that it’s been a long time since we’ve had four lefty starters out there throwing 95+ mph heaters at least 23% of the time. But…Carlos Rodon has a 4.16 ERA, and the other three all have fewer than 10 starts on the season. Let’s see if movement has anything to do with it.

We’re in search of the best lefty fastball and the best lefty fastball must move sideways, while also moving quickly. 10 inches of run seems like a pretty good place to set up camp.

Player Name Number of Pitches 95+
& 10+ inches of run
% of All Pitches
Jake Diekman 90 59%
James Paxton 171 33%
Josh Osich 24 24%
Cody Reed 18 20%
Chris Sale 90 16%
Sammy Solis 22 13%
Robbie Ray 58 11%
Brad Hand 26 11%
Clayton Richard 7 11%
Mike Montgomery 22 9%
Martin Perez 42 9%
Steven Matz 23 6%
Ian Krol 8 5%
Andrew Miller 9 5%
Ashur Tolliver 3 5%
Enny Romero 8 5%
Tony Cingrani 7 4%
Zach Britton 6 4%
T.J. McFarland 3 3%
Aroldis Chapman 4 3%
Sean Doolittle 3 2%
Carlos Rodon 8 2%

Look at that: Mr. Rodon and his 4.16 ERA bring up the rear, while Snell and Duffy dropped right off. But man, James Paxton is still up top there just behind Jake Diekman. Diekman is a very good reliever, who seems to be realizing his potential since his trade to Texas. Basically, by exclusively pounding the zone with that hard, running fastball, he’s posted an ERA below 2.00 since getting out of Philly.

Oh! Chris Sale, how did I forget to include him in my love fest of the young lefty starters in the league? Sale has thrown 110 pitches at least 95 mph, and of those, 90 have moved at least 10 inches. That’s nuts. His stuff is incredible.

We also see Steven Matz creep in there as 6% of his pitches are these 95 mph fastballs that move an unfair amount. Matz and his 2.96 ERA definitely belong in that quartet of young insanely talented left-handed starting pitching that I talked about before. He’ll be the fifth member of that group, and we instantly have to expand our Mount Rushmore of tantalizing excellence.

This is starting to feel a bit like the NBA where so much Amazing is happening. But it’s true: there’s a lot of amazing happening across the MLB landscape right now. These lefty fastballs are but one, tiny iota of all that is going on.

Let’s refine the batch of fastballs once more to include only those that have at least 10 inches of vertical movement, too. This admittedly feels like a laughable exercise. There’s no way that pitchers are actually throwing pitches that go 95 mph, while also running and rising that much….

Player Name Number of Pitches 95+
10+ inches of run
10+ inches of rise
Robbie Ray 15
James Paxton 14
Enny Romero 5
Rest of League 25

Oh. Damn. I see you Robbie Ray, James Paxton, and Enny Romero. I also see you Rest of League. That group included Danny Duffy, Sean Doolittle, Aroldis Chapman, Matt Moore, and Chris Sale. But really this is about those top three guys.

Ray was once a prospect known more for his feel and pitchability than a premier fastball. He’s starting for the Diamondbacks now and he’s striking out over 10 per game. His ERA sites at 4.59 and his WHIP is over 1.50, which are both significantly worse than his 2015 campaign, but still, if that pitchability from his earlier career outlook meets with his clearly impressive fastball, things could turn around quickly for the 24-year-old. I’m frankly surprised to see him here.

As for James Paxton, we know he’s throwing way harder now that he’s dropped his arm slot. I’ll save my full review of his stuff for the lengthier look that it deserves.

Then there’s Enny Romero. Romero isn’t well known in baseball circles just yet. He started a single game as a 22-year-old for the Rays back in 2013, spent 2014 throwing a 4.93 ERA in Triple-A, and hasn’t exactly torn things up in the majors since then. But he’s a young player, with a solid baseball name and a clearly electric fastball. He’s 25 and capable of figuring it out just like any other 25-year-old.

To be totally honest, I’m not entirely sure what to do with this group of pitchers. The guys atop this 95/10/10 club clearly have electric fastballs, but the electric fastball has not equated to big-league success so far. I guess that’s OK, and feeds back into the last bit of the the old pitching coach refrain: Velocity is nothing without movement…and control. But control is not sexy.

Speed is sexy, and all these guys throwing 95 are great, but Aroldis Chapman is the only one guy who’s ever thrown it 105 mph. He keeps the crown of best fastball. (All this talk of horizontal and vertical movement was really just an attempt to crown the best non-Chapman lefty fastball.)

So what is the takeaway?

This discussion mostly serves as a friendly reminder that we’re in the midst of a great revolution of left handed pitchers — all of whom make Clayton Kershaw old by comparison. These guys are throwing fastballs harder than we’ve ever seen before and there’s so many of them doing it.

Stat of the Day: I feel like I should also note that I unearthed an insane Andrew Miller pitch where he effectively threw a 95 mph slider on June 6th to some poor soul.