Why There May Just Be Hope for the Miami Marlins in 2019

As the 2019 season begins, Las Vegas determines the annual over/under win totals for all 30 major league teams and gives us a chance to examine intriguing over/under win lines for the upcoming season. Not surprisingly, the Miami Marlins found a spot right at the bottom of the list at over/under 63.5 wins. Will the Miami Marlins, under the ownership of Derek Jeter and the tutelage of Michael Hill, elude the worst record in baseball? Call me crazy, but there are a number of reasons why Vegas’ determination of 63.5 wins is undervaluing the Marlins.

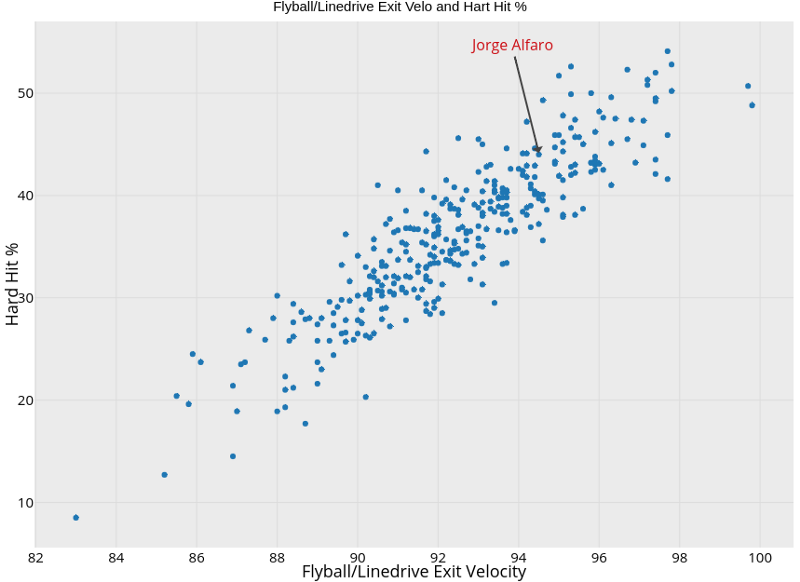
J.T. Realmuto, a 2018 All-Star and arguably the last star on the Marlins roster, was acquired by the Philadelphia Phillies for Jorge Alfaro, Sixto Sanchez, and Will Stewart this past offseason. While Sanchez is a potential budding ace pitcher and Stewart has a real future as a middle-of-the-rotation starter, Alfaro is the most interesting addition for the 2019 season. He rates as a guy with incredible raw power when he puts the bat on the ball, with the only issue thus far in his career being that his contact percentage is quite low:

The K% is good for 245th out of 247 players (min. 350 PAs) and the BB% ranks in the 8th percentile among those same 247. By looking at his O-Swing%, it’s good for second-to-last and 16% above the 2018 league average of 30.9%, and clearly he’s not making enough contact at 61%. However, when Alfaro does manage to put bat on ball, the results are quite impressive:

How about a video of the swing in action? This ball, at 115 mph off the bat of Alfaro, was absolutely crushed, and I think Junichi Tazawa’s reaction says it all…

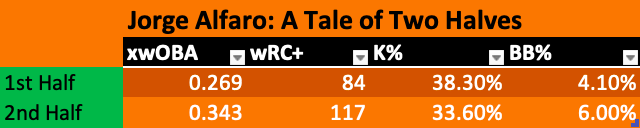
With more patience and a better approach at the plate, the Marlins could have something special in Alfaro. It’s evident that this improved approach could be on it’s way by analyzing his second-half statistics from July 2018 to September 2018:

Alfaro managed to cut his K% and increase his BB%, while performing as an above-average hitter according to wRC+. He made strides at the plate by lowering his whiff percentage outside of the zone from 28% in the first half to 25% in the second half, and his batted ball quality improved against breaking pitches, which he had struggled with mightily in the first half, as his xwOBA increased from 0.246 to 0.338 in the second half and his whiff percentage on breaking balls decreased from 34.68% in the first half to 26.52% in the second half. Read the rest of this entry »


Rougned Odor Has Changed, but Can He Improve?

As far as breakout years are concerned, Rougned Odor did a bang-up job in 2016. His 33 home runs as a 22-year-old regular gave his baseball card a hefty amount of pop, but not as much as he gave Jose Bautista during their infamous run-in at second base.

I am not generally a fan of fisticuffs on the field, but this incident was and remains a touchstone for the 2016 season. However, in becoming so it may have, to the casual fan at least, reduced what was a solid season for one of the league’s youngest players to no more than a single moment. But Odor has, in fact, done more baseball things since that fateful afternoon, and the past couple of seasons paint a fascinating picture of a player who may not have improved overall, but one who has changed a whole lot and could very well have his best years ahead of him.
Over the past five years, he’s become a fixture at second base for the Texas Rangers, never appearing in less than 114 games during that span and accumulating a total of 7.2 fWAR. Save for his abominable 2017 campaign, which resulted in -1.2 fWAR, his career, despite no shortage of deep slumps and hot streaks, has been shockingly consistent: he’s totaled exactly 2.5 fWAR in three of the past four seasons. His career has played out much more interestingly than those identical numbers suggest, however, namely in that each campaign has played out quite differently (part of the fun of WAR!). The most pronounced changes, however, have occurred since that breakout 2016.

Though he posted identical fWAR totals in 2015 and 2016, the latter year was his first with at least 600 plate appearances, which helped him make quick work of his career-highs in the fan-favorite counting stats, namely home runs (33), RBIs (88), and stolen bases (14). A healthy-yet-not-unsustainable .297 batting average on balls in play (BABIP) anchored a solid .271 batting average, and 70 extra-base hits made for an impressive .502 slugging percentage. A paltry 3% walk rate kept his on-base percentage below .300 (.296), which limited his overall offensive production and kept his wRC+ at 103 (the league average is set at 100.) The 6.1 offensive runs above average remain a career high, but despite being 2.5 runs better than average on defense in the year prior, his -3.5 mark in 2016 remain a career low. Read the rest of this entry »


An Analysis of the Relationship Between Pitcher Size and UCL Tears

A UCL tear is a death sentence for a player’s season, and it can have large repercussions for the team and league as a whole, making it crucial for front offices to understand what puts players at a heightened risk for this injury. In this research, the height, weight, age, and fastball velocity of MLB pitchers in the years 2000-17 are analyzed to determine the impact of pitcher size on UCL tear probability. The results of this study will aid executives and front offices in evaluating pitchers and their risk of needing Tommy John surgery. Moreover, these findings may aid pitchers in lowering chances for injury by guiding their offseason training goals.

1. Introduction

As Tommy John surgery and UCL tears are thrust further into the spotlight, more is revealed about possible factors and causes. In this paper, I will inspect the correlation between pitcher size (BMI) and UCL tear probability in order to determine whether the former has a statistically significant impact on the latter. The data used in this study was taken from FanGraphs, the Lahman Database, and Jon Roegele’s Tommy John Database, all of which are publicly available sources. Due to the many variables which are closely correlated with BMI and have an impact on UCL health, such as age and velocity, pitcher size was analyzed independent of these variables, which are controlled through partial correlations.

2. Analysis

2.1 BMI and Tommy John: In Aggregate

When the data set is viewed in its entirety, the results are overwhelming. The mean BMI of pitchers who have undergone Tommy John surgery is 27.09, whereas the mean BMI of pitchers who have not is 26.34. The difference between these means is statistically significant, as the p-value (odds of the difference existing due to chance) in a two sample t-test is .000001153, far below the .05 benchmark commonly used in statistics. To test this relationship in a different way, the BMIs of the 2,383 pitchers in the data set (298 who had torn their UCL, 2085 who had not) were split into deciles. The correlation between decile number and probability of Tommy John was .91, with a p-value of .0002556, revealing that there is statistically significant linear correlation between UCL tears and BMI, with higher-BMI pitchers having higher risk for Tommy John surgery. The graph of these deciles and the probability of Tommy John is shown below. Read the rest of this entry »


Is Yoan Moncada’s Breakout Coming?

Yoan Moncada has frustrated talent evaluators over the past two years. He’s about as physically talented as a baseball player can be; while still a prospect, the team here at FanGraphs thought he merited future grades of 60 hit, 60 power, 70 speed, 50 field, and 70 throw, with an OFP of 70 good for No. 1 overall prospect status. Prospects don’t get evaluated much better than that; in fact, a 70 OVR on a position player is as good as it gets. He was the kind of prospect that could headline a trade for a top-five starting pitcher, a bonafide ace, in his prime on a team-friendly contract with three years left.

Flash forward two years, about a year and a half into Moncada’s major league career, and he hasn’t performed quite as billed. Instead, in 901 career plate appearances before Opening Day 2019, he posted a 97 career wRC+ and 3.1 total fWAR, almost exactly league-average or slightly below. His defense at second base has not impressed, and so he’s being moved to the hot corner in the wake of 1) the White Sox whiffing on Manny Machado, and 2) the White Sox drafting “future Gold Glove second sacker” Nick Madrigal with the 4th overall pick in 2018. If nothing changes, he’s be in danger of becoming a utilityman.

Moncada’s offensive struggles are a little unusual. He has two traits required to be an offensive monster — power and patience — in abundance. Last year, his average exit velo of 90.6 mph was in the 86th percentile, while his 4.12 pitches seen per PA was in the 81st percentile. However, those positive traits were offset by the modern game’s bugaboo — strikeouts. Moncada struck out in an ugly 33.4% of his PAs last year, behind only Chris Davis and Joey Gallo, and his career K rate sat at 33.6% this offseason. This is very concerning, as contact issues are a flaw that are difficult to resolve.

The profile above seems to describe a three-true-outcomes hitter like the aforementioned Gallo. Dig a little deeper, though, and you’ll find that how Moncada struck out that often is not normal, and in a sense he doesn’t actually have contact issues, at least not 33.4% bad. He didn’t chase many pitches out of the zone last year — only 23.3% — sitting in the 87th percentile of qualified hitters. Neither does his whiff rate of 12.2% (league average in 2018 was 10.7%) jibe with that huge strikeout rate. Taken together, we can conclude that while Moncada’s contact ability may be somewhat below-average, he limits how much he swings-and-misses by rarely chasing pitches out of the zone. So if Moncada doesn’t chase much, and doesn’t swing and miss that much, how is he striking out so much? Read the rest of this entry »


Getting Joe Musgrove to the Next Level

Joe Musgrove was a pretty ordinary pitcher in 2018, with a 103 ERA- and an 89 FIP- according to FanGraphs. He once again battled through injuries on the way to a career-high 115.1 innings, and he had more woes to deal with in the offseason by undergoing abdomen surgery. He doesn’t particularly stand out in Pittsburgh’s rotation, as he doesn’t have the track record or high transaction cost of Chris Archer, he doesn’t have the easy-to-root-for, feel-good story of cancer survivor Jameson Taillon, and he doesn’t have the intriguing out-of-nowhere 2018 performance of Trevor Williams. He is rather ordinary among starting pitchers. Even when I ran a query of starters with similar 2018 statistics, I got back a list of some good-but-perhaps-underwhelming hurlers. Look here:

musgrove comps 1

Nothing against these pitchers (especially Miles Mikolas, who had a good but perhaps unsustainable 2018 when looking at xFIP and SIERA, which he at least parlayed into a big contract extension), but these aren’t names that come to mind first when you think of the top pitchers in the league, and Garrett Richards isn’t usually on the mound to move up into that category in the first place.

This isn’t a great endorsement for Musgrove, so why am I interested in him? I drafted Musgrove in both of my fantasy baseball drafts earlier this month, prioritizing him over the other names in the above table. I did this based on the work of Nick Pollack, founder of the great website Pitcher List and contributor to FanGraphs, who has talked up Musgrove for awhile now. On the now- famous Top 100 Starting Pitcher Rankings featured on Pitcher List, Musgrove ranks 44th, ahead of the previously mentioned Archer (54), Alex Wood (69), Marco Gonzales (77), and other notable pitchers such as Cole Hamels (47), Jon Lester (48), and Dallas Keuchel (73). There must be an explanation for this. Read the rest of this entry »


The New-Look Phillies Lineup Plans on Stealing All Your Strikes

You’ve probably heard of how pitchers and catchers can steal strikes via expert control and framing. Some guys are just so good at painting the edges that they get those calls, plus the benefit of the doubt on the ones that push a little further outside. Think Zack Greinke, Aaron Nola, or Kyle Hendricks for pitchers. On the catching side, the names are less heralded, but think Yasmani Grandal, Jeff Mathis, or Max Stassi. They all deliver or receive the ball with such veracity that it’s almost magical to witness as a viewer, and probably infuriating as a hitter.

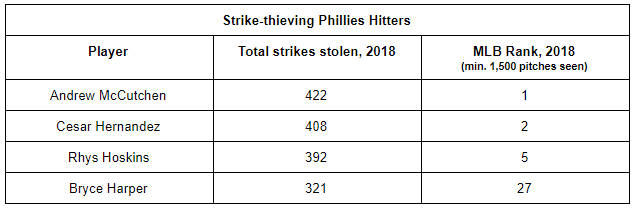
But all’s fair in love and baseball. If pitchers and catchers can aid themselves in stealing strikes that help them get outs, logic follows that hitters can do the same to prolong at-bats, even if we don’t necessarily talk about it under the same terms. Certain guys are just better than their peers at knowing when to swing and when not to, whether the ball is in the zone or not. And maybe, just maybe, that’s part of why the Phillies went out and acquired Andrew McCutchen and Bryce Harper this winter: they know when they can afford to not swing, even if the ball ends up on the edges or in the zone. In addition to Rhys Hoskins and Cesar Hernandez, the team now has three of last year’s top five hitters in baseball (and four of the top 30) at getting pitches in those spots to be called balls.

phils strike stealers

There’s a lot to unpack here. In each of the past three seasons, only about 220 hitters have qualified to be a strike thief each year by having seen at least 1,500 pitches. While hypothetically that works out on average to about seven guys per team, it’s certainly not how the talent is actually distributed. Just seven teams accounted for half of the top 30 alone in 2018. In many respects, what one team has is what another inherently can’t. Read the rest of this entry »


The Evolution of Stealing Bases at the College Level

Since the end of the BESR era, there was a downward trend of runs per game, home runs per game, and stolen bases per game in college baseball. After introducing flat-seam balls, home runs per game and runs per game have been on an upward trend. Both of these rule changes would seem to have no impact on stolen bases per game, and why would they? Analytics suggests that stealing bases is not worth the risk. I still believe there is value in stealing bases in today’s game, and the decline of it has hurt teams’ performance, especially squads that are at a disadvantage to Power 5 Conference teams. Programs such as Wright State, UCF, UCONN, and Campbell are able to stay competitive year after year by implementing the run game in their offense.

In 2018, 38 of the top 50 teams in stolen bases had a record above .500, while 38 of the bottom 50 teams in stolen bases have a record below .500. Out of the 35 non-Power 5 teams in the 2018 NCAA Tournament, 14 of those teams were ranked in the top 50 in stolen bases.

Read the rest of this entry »


Does Warm Weather Create Better Players?

My high-school-aged son sits at home yet again. Why? Because another of his baseball games has been canceled due to the wet and cold Ohio spring, and my thoughts turn again to our days playing baseball in Florida. Before we moved to this less-agreeable northern climate, it was a rarity to have a game canceled due to weather. Not only that, but games were scheduled year-round, which of course meant more baseball on the calendar. This situation reminded me of the familiar equation known to baseball fans:

Good weather leads to more playing.
More playing means better players.

But is this true? After all, it’s well-known that the best player in baseball, Mike Trout, is from cold-weather New Jersey. Many quickly point to the fact that California, Texas, and Florida are at the top of the list for states with the most MLB draftees, but they’re the three most populous states. Perhaps proportionally they don’t stack up to colder states after all.

I decided to look at the data from the last two drafts — 2017 and 2018 — to see if there is a relationship between a state’s average temperature and how well its players do in the draft. Do warmer-weather states really produce more MLB draftees than average?

To do this, I first gathered population data from each state to determine what percentage of the overall US population it contains. Then I did the same for each states’ MLB draft population. Finally, I compared those two figures and determined the percentage difference between their population proportion and their draft proportion. I call this figure the “Draft Difference”.

For example, let’s say State X makes up 10% of the US Population, but the State X’s draft class makes up only 8% of the overall class. Its Draft Difference is calculated as:

(Draft-Population)/Population = Draft Difference

In this case,

(8-10)/10 = -.20 = -20%

A state with 10% of the US population should, all things being equal, contribute 10% of all players in an MLB draft. But, in this case, State X did 20% worse than should be expected just from its population size. Read the rest of this entry »


2019 Free Agents Got 91.5% of What We Expected

(…or “Fun With FanGraphs’ Free Agent Tracker and Excel”)

The 2019 offseason was an interesting and surprising one. It continued the recent trends of free agents signing later and of several prominent free agents getting less than expected. There was debate here at FanGraphs and elsewhere on whether free agency is broken, no longer working as intended, and if it could lead to a labor shutdown. Others see the big money earned by Harper and Machado as evidence that all is fine. I wanted to take a closer look, informed by data and some quick-and-dirty analysis.

On March 3, 2019, I went to FanGraphs’ free-agent tracker and selected the first 60 free agents listed in descending order of total value of newly signed FA contract. I removed the 13 players who were not featured in reader contract crowdsourcing, leaving 47 players, ranging from Bryce Harper ($330M) to Lonnie Chisenhall ($2.8M). I then compared the total years and total dollar values from crowdsourcing to the actual signed contracts. Here’s what I found. Read the rest of this entry »


Mike Trout and The 1% Club

Like many other followers of FanGraphs, I never seem to get enough articles about Mike Trout — the general theme being: “another way Mike Trout is so great” — so I want to share one of my own. Contrary to popular belief, Trout did not invent WAR; even more shocking, the metric wasn’t developed for the primary purpose of showcasing how valuable he is. But that of course is what it does do. Many readers may know that beginning with his first full season, at age 20, and continuing up to his most recent, age 26, Kid Fish has had the most WAR through every season but one — his age-25 season, when he missed nearly fifty games with an injury — than any other player in history. So it shouldn’t be surprising that he is one of just 20 members of what I call The 1% Club: players who have equaled or exceeded 0.010 WAR per PA for their entire careers.

In fact, he’s currently second only to Babe Ruth:

Career War/PA Of 0.010 Or Greater
Player fWAR/PA (career) fWAR/PA (age 26)
Babe Ruth 0.0159 0.0172
Mike Trout 0.0138 0.0138
Rogers Hornsby 0.0138 0.0134
Ted Williams 0.0133 0.0139
Barry Bonds 0.0130 0.0107
Lou Gehrig 0.0120 0.0121
Willie Mays 0.0120 0.0120
Honus Wagner 0.0118 0.0080
Ty Cobb 0.0114 0.0131
Mickey Mantle 0.0113 0.0129
Tris Speaker 0.0109 0.0123
Joe DiMaggio 0.0108 0.0123
Joe Jackson 0.0106 0.0109
Mike Schmidt 0.0106 0.0109
Jackie Robinson 0.0106*
Jimmy Foxx 0.0105 0.0122
Dan Brouthers 0.0104 0.0118
Nap LaJoie 0.0103* 0.0095
Eddie Collins 0.0100 0.0125
Stan Musial 0.0100 0.0116
*rWAR

This list is based mostly on FanGraphs’s fWAR, and is for players with a minimum of 50 career WAR. However, two players, Nap LaJoie and Jackie Robinson, don’t quite qualify by fWAR, but they do if we use Baseball Reference’s rWAR (all the others on the list qualify using either metric). Trout is the only active player on the list, though if we lower the bar to 30 career fWAR, three more players appear, including Mookie Betts, who is at 0.0104. Even lowering the criterion to just 10 fWAR adds just one more active player, Aaron Judge (0.0103). Read the rest of this entry »