Roster and Gameday Strategies for One-Game Playoffs

Previously, I took a look at the benefits of a legally nebulous, but somewhat unlikely nine-man defense. In this piece, we’ll look at a group of other tactics that can be employed in the new one-game Wild Card Round that the MLB has created. This time, we’ll take a more traditional “outside the box” approach, if such a thing is possible.

With the addition of the new playoff round comes the opportunity for roster gaming. Being AL-centric here for a moment, we saw this last year in particular on the AL side. While the other three teams (Cardinals, Braves, Rangers) selected 3 starting pitchers to their Wild Card roster, the Orioles went with only 1, Joe Saunders. Sure, Arrieta, Hunter, Matusz all had starts in the year, but by September they were all in the pen. This freed up some roster room for Buck, which he primarily filled with other relief pitchers.

Now, that’s not the worst idea in the world, but given the uniqueness of the one-game playoff, why not make unique roster decisions?

First, as I mentioned above.  The selection and usage of pitchers seems paramount.  I’m of the opinion that one should almost play the entire game as if it were a game in extra innings.  Limit your pitchers to 2 innings or so, potentially even starting with your closer.  Now, that gets into the mental preparedness issues as to whether or not a closer could appreciate or handle coming into a game in the first inning. However, if he were aware that he is only going to be pitching the first inning, perhaps this may not be as big of an obstacle.

The main benefit to this is that you are able to rest your starters for a potential 5-game series against the best team in the league.  Additional benefits exist in the ability to play matchups, and remove a pitcher who gives up more than a run or two.   I would imagine this would result in selecting mostly (all?) relief pitchers, with an “emergency” starter, similar to how the All-Star Game has worked as of late. I would imagine employing this strategy would lead you to want to carry 11 or 12 pitchers on your roster.  That may limit your options for position players, which brings us up to point two.

Second, depending upon the comfort one has with their team’s starting lineup, the logical roster choice is to select speed.  In a one-game scenario, the likelihood of needing a hot bat to add to the lineup is low, and the value of a stolen base, potentially late in the game, can be incredibly high, as we saw in the 2004 ALCS.  Perhaps the inclusion of an emergency catcher would be a good idea, if you’re one of those who lives in perpetual fear of random foul tips and collisions.

The third and final element is for managers and players to put their ego at the door.  Here we live in the age of the immense infield shift, with the third baseman playing behind second base in some instances.  In a one-game playoff, the correct move is for the player to bunt the ball down the line where no defensive player exists.  Sure, I agree that over the long term of a season, you’re better off with the potential for a double or home run, but given the difference in value of having a player on the bases in one game (plus the potential that for the next at bat, the defensive team would not shift as dramatically) increases the likelihood of success for the team as a whole.  And besides, it even opens up the opportunity for the rare bunt double.   I’m not the first to make this argument, though.  This has existed since at least the 1946 World Series, when Ted Williams was out-dueled by Manager Eddie Dyer of the Cardinals.  For the record, Williams batted .200 that Series, with all of his hits being singles.

Ultimately, this boils down to one thing: small ball is the name of the game.  Even teams full of power hitters can benefit from not having to rely on the long ball to win a ball game, especially one as important as the Wild Card Game.   We only have to look back one year to see an example of a power team’s bats going cold at just the wrong time, with the Rangers, the MLB’s best offense in runs per game, only able to put together one run, while their opponents scored five with only one extra-base hit (and three sacrifices!).

What do FanGraphers think?  What strategies that are not typically employed would be worth the effort in a one-game playoff?


Robinson Cano and the Value of Turning Two

Note: I have no idea if I’m the first to do this, but quite frankly I don’t care.

It’s no secret that Yankees second baseman Robinson Cano is an all-around excellent player, as he’s on his way to his fourth consecutive 5-win season. It’s also no secret that he’ll be a free agent after this season, and will certainly receive a contract in the nonuple figures. As the Angels have shown these past two offseasons, when you spend that much money on one player, you’d better be sure he’ll be worth it; the Yankees already have experience with terrible contracts (contracts they’re still due to pay for), so they’ll have very little room for error. Thus, executives of any and every team that might be interested in Cano will be doing their research, scouring the earth for any warning signs of a possible decline.

But back to Cano’s performance at the moment. While Cano is a superb player overall, much of his value comes from his bat; over this current 4-year 5-WAR streak, he’s been the seventh-best offensive player in the majors. The (relative) caveat in his game, therefore, is his defense: over that same span, he’s just 76th in fielding in the majors. Defensive statistics are subject to year-to-year fluctuations, and the fluctuations of Cano’s defense have been well documented. However, there’s a specific aspect of his defense that I’d like to focus on for the time being.

As you probably should know, UZR–the main defensive statistic at FanGraphs–is composed of four parts: RngR, which measures how many runs a player saves or costs his team with his range; ErrR, which measures how many runs a player saves or costs his team by committing or not committing errors;  ARM, which measures how many runs a player saves or costs his team with his arm in the outfield; and DPR, which measures how many runs a player saves or costs his team by turning or not turning double plays. This last segment is the one that is so interesting, at least to me, because it’s the one that Cano is the worst in the league at.

No, really. Among 79 qualified infielders¹, Cano’s DPR of -3.6 is the worst, and the next worse player (Neil Walker) is a full 1.2 runs away, at -2.4 DPR².

Now, the real question becomes: what (if anything) does this mean? Obviously, when you’re preparing to give someone a contract that could exceed the GDP of whatever the fuck this country is, you’d prefer if he wasn’t the absolute worst in the majors at something, even a seemingly trivial thing like turning double plays. Still, though, it’s worth asking: what, exactly, is the significance of this?

There are a few different ways of looking at this; for the purpose of this post, I divided my analysis into 5 main categories:

1. Is this a fluke?

As I mentioned before, year-to-year defensive statistics can be quite fickle, so it’s best to gain some historical perspective when evaluating a player’s defense³. So, does Robinson Cano have a history of being a bad double play turner?

Well, on the one hand: In 2011, he was 6th out of 73 qualified infielders in DPR; in 2010, he was 13th out of 81; and in 2007, he was 2nd out of 89. These numbers would suggest that his horrific 2013 has been a fluke, except…

Last year, he was 61st out of 76; in 2009, he was 77th out of 81; in 2008, he was 67th out of 78; in 2006, he was 62nd out of 89; and in 2005, he was 75th out of 77.

Add it all up, and since he entered the league in 2005, Cano is 83rd out of 95 qualified infielders in DPR. However, it should be noted that before this year (i.e. from 2005 to 2012), Cano was 55th, a much more respectable figure, if not a particularly great one.

So, overall, it’s fairly safe to conclude that Cano has something of a poor history of turning double plays. What next?

2. Does a poor DPR correlate to poor defense in other areas?

To answer this question, I’ll bring up a few graphs. These’ll show us how well DPR this year has correlated to RngR…

DPR-RngR

…ErrR…

DPR-ErrR

…UZR…

DPR-UZR

…and finally, whatever that Def stat is.

DPR-Def

In case you were wondering, the R-squared values for these graphs were .000669, .004252, .028772, and .032933, respectively.

So there’s clearly no correlation between DPR and any other defensive statistic, which brings up the original question: What’s the point of all of this? Well…

3. Just how bad is a -3.6 DPR?

Quite bad, it turns out. In the illustrious 12-year history of the stat, the only worse seasons were Jas0n Bartlett in 2009 (-4.2)⁴, Yunel Escobar in 2008 (-3.7), and Omar Vizquel in 2005 (-4.0).

Again, this takes me back to my original point: when a player’s going to be paid a yearly salary that will exceed the total gross for this shitty movie, you generally don’t want him mentioned among the worst players in history (albeit a very short history).

Still, though, these three were/are good defensive–and all-around–players for the majority of their careers. So what’s to worry about?

4. How have players with similarly poor DPRs done in their seasons?

For this one, I’ll expand the criteria to all seasons with -3 DPR or worse; other than Cano this year, there are 11 such seasons:

Player Year DPR
Neil Walker 2011 -3.2
Jason Bartlett 2010 -3.1
Yuniesky Betancourt 2010 -3.5
Jason Bartlett 2009 -4.2
Placido Polanco 2008 -3.1
Yunel Escobar 2008 -3.7
Brian Roberts 2007 -3.2
Luis Castillo 2006 -3.0
Omar Vizquel 2005 -4.0
Jimmy Rollins 2002 -3.1
Jose Vidro 2002 -3.5

Of these 11 seasons, the average WAR was 2.8, less than half of Cano’s WAR this year. The highest WAR was Bartlett’s 5.3 in 2009⁵, but overall the results were much lower.

So it would appear that Cano’s done something relatively new this season–play at a very high level while having a substandard DPR–but this still doesn’t answer the main question. I’ll answer that next, and the results are intriguing:

5. How have other players with DPRs this bad done for the rest of their careers?

Let’s continue to look at these 11 seasons. How were these players before and after their -3 DPR season?

Player WAR-Pre WAR-Post Off-Pre Off-Post Def-Pre Def-Post
Neil Walker 1.5 2.7 7.4 6.7 -6.8 -0.1
Jason Bartlett 3.5 0.8 4.4 -16.7 10.5 5.4
Yuniesky Betancourt 0.4 -1.4 -15 -23.8 -1.4 -7.7
Jason Bartlett 4.1 1 6.2 -11 14.1 0.9
Placido Polanco 3.3 2.2 1.8 -10.3 11.3 11.9
Yunel Escobar 3.6 3.1 10.2 -0.5 6.4 10.9
Brian Roberts 3.1 2.4 5.4 3.9 5.5 0.1
Luis Castillo 2.5 1.7 1 -0.8 4.6 -1.8
Omar Vizquel 2.4 1 -8.8 -24.5 12.8 14.6
Jimmy Rollins 1.4 3.4 -5.3 4.5 0.1 10.2
Jose Vidro 2.3 1.2 10.3 1.2 -5.2 -9.8
Average 2.6 1.7 1.6 -6.5 4.7 3.2

(All values are per 600 PAs. Year of DPR is included in Pre.)

They all saw a noticeable drop off in their WAR; the only ones whose WAR increased were Rollins and Walker, and they had their bad seasons when they were young. Given that Cano will turn 31 in October, it’s safe to say this will not happen to him. Since Cano is getting older, a decrease in WAR to some degree should be expected, especially considering the volatility of his position; this has been covered before, though.

What I found interesting, though, was that the players’ defense (as measured by that fancy new Def stat) didn’t really drop off much after the bad DPR year, but their offense seemingly fell off a cliff. This goes against the theory of player aging curves (that offense can get better as players get older, but defense tends to just decline overall).

Obviously, this is a very small sample size, and to extrapolate anything meaningful from it would be foolish. Also, it’s pretty unlikely that the decline was caused by one bad year turning double plays.

This post as a whole was probably rather cockamamie⁶, but then again, everything I post here tends to be. I just hope I was able to raise some interesting questions about how much turning two matters to a player’s overall worth. Perhaps, years from now, when the Yankees are paying Cano $30 million a year to hit .250 with poor defense, and the Orioles have won the division year in and year out, I’ll be able to look back with pride at my prescience.

Or maybe, the Yankees will just win more World Series with or without Cano, while the Orioles dwell in mediocrity every year.

A man can dream, though….

——————————————————————————————————————

¹For some reason which escapes me, there isn’t an option to sort the leaderboards by solely infielders, even though there’s an outfielder option.

²Hopefully, you would’ve figured that out on your own, but I put it in there just to be safe. Also: All stats are as of Saturday, September 21st, 2013.

³Otherwise, you’ll end up with pieces-of-shit “analysis” like this.

⁴Bartlett also had a DPR of -3.8 in 2006, but he didn’t qualify that season.

⁵That was his ridiculous fluke season–you know, the one that Joe Maddon just gets out of every scrub the Rays find on the street.

⁶You have no idea how long I’ve waited to use that word.


The “Exceptional” Kyle Lohse

After the 2012 season, Kyle Lohse declined the qualifying offer of the St. Louis Cardinals, and hit the free agent market.  Lohse’s 2012 season was exactly what any starter would want in a contract year: a career-best 2.86 ERA over 211 innings.  It completed a comeback from a rough 2010 in which Lohse battled arm trouble, and had one of his worst seasons. 

Many commentators felt that that Lohse’s 2012 campaign was a one-time affair.  Lohse’s ERA benefited from an unusually low .262 Batting Average on Balls in Play (BABIP), and the usually reliable pitching statistic of Fielding Independent Pitching (FIP) dinged him for it, pegging his real performance at 3.51 — almost three quarters of a run higher.  Furthermore, Lohse spent 2012 at Busch Stadium, a pitcher’s park, and got to have his pitches called by Yadier Molina, perhaps the best catcher in the game.  

But was Lohse’s low BABIP in 2012 truly a fluke? 

Let’s start by comparing Lohse to other Cardinals starters with at least 150 IP that year.  Like Lohse, they pitched their home games in the same pitcher’s park, and also took their signs from Yadier Molina:

Name IP BABIP ERA FIP
Kyle Lohse 211 0.262 2.86 3.51
Jake Westbrook 174.2 0.312 3.97 3.8
Adam Wainwright 198.2 0.315 3.94 3.1
Lance Lynn 169 0.316 3.67 3.47

Of all Cardinals starters that year, Kyle Lohse had the best starter BABIP by 50 points, and was the only one below the league BABIP average.  Interesting.  But, one season proves nothing.  So, let’s look at 2011, again for Cardinal starters with at least 150 IP:

Name IP BABIP ERA FIP
Kyle Lohse 188.1 0.269 3.39 3.67
Chris Carpenter 237.1 0.312 3.45 3.06
Jake Westbrook 183.1 0.313 4.66 4.25
Jaime Garcia 194.2 0.318 3.56 3.23

In 2011, Kyle Lohse’s BABIP was a mere seven points higher than his 2012 BABIP, and still absurdly low.  Once again, Lohse’s BABIP was by far better than any other Cardinals starter, and well below league average.  Is this still a fluke?  Does Yadi just save his best calls for his friend Kyle?

Perhaps, the key is to get Lohse away from Molina and Busch Stadium.  Fortunately for our purposes, the Milwaukee Brewers indulged this notion, signing Lohse at the conclusion of 2013 Spring Training.  Miller Park, where the Brewers play, is a hitter’s park where the fly balls go a long way and batters get more hits.  Furthermore, in 2012, the Brewers had one of the worst defenses in baseball.  The stage seemed to be set for a substantial BABIP regression.

The 2013 season is now almost complete for the Brewers.  Yet, as of the time this article was written, here are the statistics for Brewers starters with at least 150 IP in 2013:

Name IP BABIP ERA FIP
Kyle Lohse 184.2 0.284 3.46 4.1
Yovani Gallardo 161.2 0.299 4.18 3.95
Wily Peralta 172.1 0.292 4.49 4.28

Lohse’s BABIP did regress a bit.  Yet, Lohse’s BABIP is not only the lowest of the three qualifying Brewers starters, but still notably below the .294 BABIP average of baseball. 

One last comparison: other NL Central starters play in many of the same stadiums that Kyle Lohse does.  How does his BABIP compare to starters who have also spent the last three years pitching at least 450 innings exclusively for NL Central teams?

Name BABIP ERA FIP
Kyle Lohse 0.271 3.22 3.75
Bronson Arroyo 0.278 4.13 4.63
Mike Leake 0.284 3.87 4.21
Homer Bailey 0.292 3.76 3.67
Yovani Gallardo 0.293 3.79 3.83
Jake Westbrook 0.307 4.23 4.15

There he is again.  The lowest BABIP in the NL Central for starters over the last three years belongs to Kyle Lohse.

What is going on?  Does Kyle Lohse simply possess The Will to Pitch? 

Certainly, many of you might claim Kyle Lohse is the beneficiary of nothing more than good luck.  It is almost an article of faith among observers that BABIP is essentially a random attribute beyond the pitcher’s control, benefiting substantially from defense.  One could also argue I am using arbitrary endpoints.  While Kyle Lohse had a terrific pitching BABIP from 2011–2013, his major league BABIP was .364 in 2010.  Move the goalposts, some would say, and get a different result.  Finally, Derek Carty suggests that BABIP can take as long as 8 years (~3729 batters) to stabilize into a predictable indicator of a pitcher’s ability, which is another way of saying that it never really stabilizes at all, and is therefore indicative of nothing.

As to Kyle Lohse, that view may be correct.  But I suspect it is not.  Rather, I suspect that Kyle Lohse’s career renaissance has actually been driven in part from his ability to limit the damage caused by balls put into play.  To explain why, I’ll first address the arguments I just made in favor of his performance being unsustainable.

First, let’s talk about BABIP.  Although it common to attribute BABIP entirely to luck, it is more complicated than that.  Tom Tango and his colleagues found, for example, that BABIP was 44% luck.  The remainder (majority) of BABIP was attributed to a combination of the pitcher, the park, and fielding.  The pitcher was given 28% of the credit for his BABIP, but that is just an average; many observers suspect that a small class of pitchers has a unique ability to control their BABIP by inducing less effective contact.  Strikeout pitchers are one example. So, while it is common to dismiss good BABIPs as flukes, it is intellectually lazy to do so, particularly if a pitcher is generating low BABIPs on a consistent basis. 

Second, let’s address arbitrary endpoints.  Am I excluding Kyle Lohse’s dreadful 2010 season from my endpoints?  Yes.  Why? A few reasons.  First, because Lohse was injured that year and dealing with arm trouble that he finally was able to resolve.  In fact, the 2010 season was the culmination of a few injury-plagued seasons for Lohse.  But since the 2011 season that followed, Lohse has consistently pitched at least 180 innings per year and also consistently been effective, more so than he was ever was before.  Since 2011, his walk rates have been the best of his career, as have the ratio of his strikeouts to walks, both attributes that everyone agrees are controlled primarily by the pitcher’s ability.  Also, as Russell Carleton has found, a pitcher’s recent BABIP performance tends to be more predictive of their BABIP going forward.  So, what some would call an arbitrary endpoint (the beginning of Lohse’s 2011 season), I would call appropriate, and indicative.    

Finally, there is the issue of sample size.  Although I have no quarrel with the method Derek Carty used to conclude that a pitcher’s BABIP can take 3729 batters to stabilize, Kyle Lohse has faced over 2400 batters in the past three years.  That is not trivial sample, particularly when it spans home stadiums at opposite ends of the park factor spectrum. 

My suspicions about Lohse are further confirmed when you consider the differential between his RA9-WAR and his fWAR.  FanGraphs bases fWAR for pitchers entirely on their FIP.  However, FanGraphs also recognizes that FIP, while effective in evaluating most pitchers, does not properly evaluate pitchers who actually possess the skill to limit the damage on balls put into play.  Rather than toss FIP and fWAR aside, FanGraphs last year began publishing RA9-WAR as an alternative metric to allow a comparison between the number of runs that actually come across the plate while a pitcher is on the mound, versus those that FIP is willing to credit to the pitcher as having personally prevented.  The differential between a pitcher’s RA9-WAR and fWAR tells you how much of that pitcher’s run prevention cannot be explained by the three “true” outcomes of home runs, walks, and strikeouts.  Niftily, FanGraphs also estimates how the other runs were prevented — through BABIP (BIP-Wins) and by runners stranded (LOB-Wins).  Both RA9-WAR and fWAR are also park-adjusted.

Let’s start with the entire time period of 2011-2013.  For starters with 450 IP, Lohse’s RA9-WAR / fWAR differential is one of the top 10% in the game.

Name RA9-WAR BIP-Wins LOB-Wins FDP-Wins RAR WAR RA9 / fWAR Differential
Jered Weaver 17 6.1 -0.1 6 102 10.9 6.1
Jeremy Hellickson 9 4.6 0.6 5.2 37.2 3.8 5.2
Hiroki Kuroda 14 1.7 2.6 4.3 90.4 9.7 4.3
Clayton Kershaw 21.9 5.6 -1.5 4.1 152.9 17.8 4.1
Bronson Arroyo 6.6 2.3 1.7 3.9 23.3 2.6 4
Kyle Lohse 11 3.6 0.2 3.8 66.1 7.2 3.8
Ervin Santana 8.2 4.6 -0.9 3.7 41.9 4.5 3.7
R.A. Dickey 11.8 3.2 0 3.2 80 8.6 3.2
James Shields 15.5 2 1 3 117.3 12.5 3

Lohse’s differential has intensified in 2012-2013.  Over the last two years, among those with 300 IP pitched, only one starter in baseball had a larger RA9-WAR / fWAR differential (last column) than Kyle Lohse:

Name RA9-WAR BIP-Wins LOB-Wins FDP-Wins fWAR RA9-WAR minus fWAR
Clayton Kershaw 14.6 4.3 -0.9 3.4 11.2 3.4
Kyle Lohse 8.3 2.4 0.9 3.3 5 3.3
Hiroki Kuroda 10.3 1.6 1.1 2.7 7.6 2.7
Bronson Arroyo 6.7 1.3 1.1 2.5 4.2 2.5
Jarrod Parker 7.2 2.1 0.2 2.3 5 2.2
Jordan Zimmermann 8.3 1.1 0.8 2 6.4 1.9
Ervin Santana 3.5 3.4 -1.6 1.9 1.7 1.8
R.A. Dickey 8.2 2.3 -0.4 1.9 6.4 1.8
Chris Sale 11.3 0.8 0.8 1.6 9.7 1.6

That guy’s name is Clayton Kershaw, and he is pretty good.  In fact, Kershaw and Lohse have beat their FIP by basically the same amount over the past two years.  Unlike Kershaw, Lohse has pitched one of those seasons at home in Miller Park.

Overall, it is safe to say Lohse is showing a strong and consistent ability to beat his FIP, and over the last few years, is doing so better than almost any starter in baseball.  He is doing so by generating balls in play that are uniquely unsuccessful at becoming hits, and which his defense seems unusually capable of being able to field for outs.

How is he doing this?  It certainly is not his strikeout rate.  Lohse is not anybody’s idea of a strikeout pitcher.

What Lohse does do, however, is control the count, minimize walks, and consistently pitch from ahead.  This quality makes Lohse an extremely enjoyable pitcher to watch: despite topping out at 90 mph, he pounds the zone and challenges hitters.  His BB/9 over the last three years has ranged from 1.62 to 2.01.  During that same time frame, only Cliff Lee is more likely than Kyle Lohse to throw a first-pitch strike, which Lohse did 67.5% of the time.  The fact that Lohse is throwing first-pitch strikes against 2/3 of the batters he faces without getting killed suggests that he is putting those strikes in locations where batters want no part of them.  In short, Lohse has terrific control and consistently finds himself in counts where he and his catcher have the luxury of choosing their pitch.

Does Lohse’s control affect the quality of the ball being put into play against him?  It very well may.  Although his sample size could have been larger, Russell Carleton found that pitcher BABIPs correlated with the pitch counts the hitters were facing when they put the bat on the ball.  The more favorable the count to the pitcher, the less likely the hitter will get on base from his hit.  Kyle Lohse’s three best counts for limiting batter wOBA this year?  Why, those would be 0-2, 1-2, and 0-1.  And the three counts Kyle Lohse faces far less than any others?  Those would be 3-0, 3-1, and 3-2. 

The bottom line is that Kyle Lohse is an exception among aging starters: a pitcher who has gained effectiveness in his mid-thirties through terrific control that not only forces hitters to beat him, but also apparently limits the damage even when batters do hit the ball.  Should the Brewers make Lohse available at the trade deadline next year, contenders would be foolish not to give him a close look, particularly with Lohse under control through 2015.  When the difference between collecting a pennant and going home can be a batted ball just out of reach, it makes sense to have a pitcher with a demonstrated knack for putting the ball in the defender’s glove.  


The Worst Playoff Bunts from 2002-2012

I’m generally opposed to the sacrifice bunt, except in the rarest of circumstances. This less than optimal strategy is utilized even more in the playoffs. Derek Jeter, the all-time leader in playoff sacrifice bunts with 9, bunts almost twice as frequently in the playoffs as the regular season. That in itself should tell you that managers tend to go bunt-happy in the postseason since Jeter is a career .308/.374/.465 playoff hitter. I used Win Probability Added (WPA) and Run Expectancy (RE) in my calculations. For the record, the sum of Jeter’s sacrifices is -0.13 WPA and -1.88 RE. Anyways, here’s the list of the five worst playoff sacrifice bunts since 2002. Data is provided by Baseball Reference’s Play Index.

5. Daniel Descalso 2012, NLDS, Game 1. The Cardinals were losing to the Nationals 3-2 in the 8th when Descalso came to the plate with Adron Chambers on first and Tyler Clippard on the mound. Descalso laid down a bunt, sending Chambers to second. WPA: -0.04 RE: -0.19. Pete Kozma and Matt Carpenter would be retired, and the Nationals would go on to take Game 1. Descalso would hit two home runs in the series.

4. Eric Bruntlett 2004, NLCS, Game 6. Down 4-3 in the 9th, the Astros pinch-hitter faced Cardinals closer Jason Isringhausen with Morgan Ensberg on first and no outs. Bruntlett had 4 home runs and a 111 wRC+ in 61 regular-season PA, but a go-ahead home run was not on manager Phil Garner’s mind. Bruntlett bunted Ensberg to second. WPA: -0.05 RE: -0.21. After Craig Biggio flew out, Jeff Bagwell would deliver a game-tying single, but the Cardinals would eventually win it in the 12th. Though I’m not a fan of judging decisions based on results rather than process, you could say that this decision “worked.”

3. Brad Ausmus 2005, WS, Game 4. The Astros were trailing 1-0 when Jason Lane led off the bottom of the 9th with a single off White Sox closer Bobby Jenks. The 36 year-old catcher had posted a .351 OBP in 2005, one of the best marks of his career. Nevertheless, he sacrificed on the first pitch he saw, moving Lane to second and decreasing the Astros’ chance of scoring. WPA: -0.05 RE: -0.21. Pinch hitters Chris Burke and Orlando Palmeiro would be retired, and the White Sox took game 4 on their way to winning the series.

2. Elvis Andrus, 2010 ALCS, Game 1. The Rangers shortstop came to the plate against Mariano Rivera in the bottom of the 9th inning, with the Rangers trailing 6-5 and Mitch Moreland on first with no outs. With the count at 1-2, Andrus got down a bunt, sending Moreland to second. WPA: -0.06 RE: -0.22. Rivera would strike out Michael Young and get Josh Hamilton to ground out, ending the game. This bunt is even worse than the numbers because of the 1-2 count on Andrus and the fact that there was little to no risk of grounding into a double play, as the speedy Andrus had just 6 GDP in almost 700 PA. I should add that noted lover of bunting Ron Washington was managing the Rangers, who have had the most sacrifice bunts in the AL during his tenure.

1. Danny Espinosa, 2012 NLDS, Game 1. The Nationals were trailing the Cardinals 2-1 in the top of the 8th. With Ian Desmond on first and Michael Morse on third and no outs, Espinosa came to the plate, facing Cardinals reliever Mitchell Boggs. Espinosa was 0-3 on the day with 3 strikeouts. He still had some pop though, as he had 17 home runs on the season. For whatever reason, on an 0-1 count, Espinosa tapped a bunt to Boggs, advancing Desmond to second. WPA: -0.09 RE: -0.44. The next hitter, Kurt Suzuki, would strike out. Fortunately for Espinosa and the Nationals, pinch hitter Tyler Moore would come through with a two-run single, and the Nationals would win the game 3-2.

The sacrifice bunt by a position player is almost universally a negative play, but even in the age when statistical information is readily available and most teams are employing an army of nerds, the tactic refuses to die. Perhaps it’s because “that’s the way the game was played” when many of these managers were players. Or maybe it’s the conservative nature of managers. The players usually get saddled with the blame if an opportunity with runners in scoring position is squandered after a sacrifice bunt. But if a player grounds into a double play when he could have bunted, the manager might be taking the heat. Whatever the case, expect managers to keep ordering the bunt come October.


Probabilistic Pitch Framing (part 1)

Let’s take a look at some recent pitches and assess the framing job by the catchers.

Exhibit A: pitch #4 in this sequence from Freddy Garcia to Lucas Duda, as framed by Gerald Laird.


Hey, great framing job, Gerald Laird! That pitch was clearly a rulebook ball and you got a strike called for your pitcher. 1 point for you.

Exhibit B: pitch #3 in this sequence from Jeff Samardzija to Joey Votto, as framed by Dioner Navarro.


Boo, terrible framing job, Dioner Navarro! You just cost your pitcher what was clearly a rulebook strike! -1 points for you.

To the best of my knowledge, this is how most pitch-framing calculations currently work.  We check to see if the pitch was in the zone, and give the catcher a positive or negative credit for pitches that were called differently from how they “should” have been called.  But is that really answering the right question?

Consider the two (extreme, cherry-picked) examples above.  In example A, a pitch was called a strike that was just off the outside corner of the plate to a left-handed hitter on a 3-0 count.  It is almost certainly the case that no one in the ballpark was surprised at the result of that pitch.  After all, we know that the strike zone as it is called to left-handed hitters extends a bit off the corner, and that on 3-0 counts the umpire tends to extend the strike zone a bit anyway.  So should Gerald Laird get full credit for getting that pitch called a strike?

Exhibit B is the exact opposite case in many ways.  We had an 0-2 count on a left-handed hitter, and the pitch was near the top of the strike zone.  Given that the strike zone as it is called shrinks somewhat in an 0-2 count, and that it is shifted away to a left-handed hitter, the catcher was unlikely to get that call.  So should Dioner Navarro get a full demerit for that pitch being called a ball?

Let’s do some crude calculations.  The pitch to Duda was 0.974 feet from the center of the plate, and 2.01 feet off the ground.  Since the start of the 2012 season, there have been (according to the best data I can find) 203 pitches to left-handed hitters in a 3-0 count that fell between 0.9 and 1.2 feet from the center of home plate (in the right-handed batter’s box) and ended up between 1.6 and 2.4 feet off the ground.  Over 77% of those pitches (157/203) were called strikes.  Laird shouldn’t get much credit at all for that frame job, right?

Similarly, let’s explore exhibit B.  The pitch to Votto was 0.671 feet from the center of the plate and 3.341 feet off the ground.  I can find 89 pitches that fell between 0.47 and 0.83 feet from the center of the plate (inside to a lefty, of course) and ended up between 3 feet and the top of the strike zone to left-handed hitters in an 0-2 count.  Of these, 50 (56%) were called balls.  So should we really be penalizing Dioner Navarro all that much for that frame job?

As I hinted above, we have been answering the wrong question.  We shouldn’t be comparing what a catcher did to the rulebook strike zone.  We should be comparing what a catcher did to the probability that the call would have gone the way it did anyway.  It doesn’t matter what the actual strike zone is; all that matters is how the umpires are calling it.  This turns the calculation from a binary one (like the calculation of fielding percentage) to a probabilistic one (like the calculation of plus/minus).  Under this system, Laird would have received a credit of 0.23 for his frame, and Navarro a demerit of 0.44 for his framing.

In part 2 of this series, we will actually go about constructing the formal system to do this so we don’t have to do crude approximations like the ones above (spoiler: it will look a lot like the excellent work Matthew did here).  There will be math, yes, but there will also be lots of pretty pictures and maybe even an animated gif!  In part 3, we will actually apply this system to see which catchers have done the best frame jobs since the start of 2012 (assuming I can associate catcher data to my pitch f/x data by then).

Huge thanks to MLB for making the pitch f/x data freely available (seriously, how awesome is that?), Mike Fast for teaching me how to make a pitch f/x database, and Brooks Baseball for making the images in this post.  Also, thanks to you for reading this post and adding helpful, insightful comments below.


Victor Martinez: The Best Fielding First Baseman in the Majors (No, Really)

Note: I have no idea if I’m the first to do this, but quite frankly I don’t care.

It’s been one crazy season for Victor Martinez. In the first half, he was one of the worst players in baseball, with an 88 wRC+ and -0.6 WAR in 392 plate appearances; however, this was largely due to a .269 BABIP, and when his BABIP increased (to .372), his wRC+ and WAR (140 and 1.1, respectively, in 223 plate appearances) increased with it. This, though, is not the focus of my writing today. I chose, instead, to focus on one of the oddest statistics of the 2013 season, and one that truly proves that this blog is aptly named.

V-Mart has never been regarded as a good fielding catcher, and the stats confirm this–since he entered the league in 2002, he’s third-last among catchers in DRS and fifth-last in stolen base runs saved. He is, however, a (comparatively) much better fielding first baseman, with a career UZR/150 of 2.3¹ that would rank 12th out of 19 first baseman this year if he qualified. Throughout this season, Martinez has been mainly a DH², with 128 games started there, and 17 started in the field; of those 17, 11 have been at the 3-spot. He has played 97 innings at first base, which comes out to a little less than 9 innings per start there. So, obviously, we’re dealing with a very small sample size here; and yet, the larger point remains:

Victor Martinez has the highest UZR/150 among first baseman with at least 90 innings.

Surprised? Well, you probably shouldn’t be, as you read the title of this article before perusing the text that lies beneath it, so you probably should’ve seen this coming. In a larger sense, though, you probably are surprised, as this isn’t exactly Albert Pujols we’re talking about here. As I outlined above, Martinez isn’t a particularly bad fielding first baseman⁴, and this is obviously a ridiculously minuscule sample size⁵, but he’s certainly not this good. What, then, has changed? 

First, let’s look at his non-UZR advanced fielding stats. He has had 19 balls hit to his defensive zone (officially, Balls In Zone, or BIZ), and has made a play on 13 of them (just Plays–I guess they ran out of anagrams), for a Revised Zone Rating (RZR) of .684. That figure, if he had enough innings to qualify, would be the worst in the majors by a long shot–the lowest right now is Lyle Overbay, with a .766 RZR–and is also the worst figure of his career.

One thing he is doing, however, is making a lot of Out-Of-Zone plays, or OOZ. Although it isn’t included in UZR, OOZ is still an interesting statistic: it measures the amount of plays a fielder has successfully made when out of his defensive “zone”. Martinez has five OOZs in 97 innings this year; if he were to have played, say, ten times that amount, or 970 innings (about 110 games), he would have 50 OOZs, far more than the current leader, Anthony Rizzo, who has 41. In this regard, though, Martinez’s performance isn’t that different from his career as a whole, as he has 49 career OOZs in 1299.1 career innings (in 163 games) at first.

It’s when we look at the stats that go into UZR that we start to see some key differences. In case you need a refresher (or are simply unedumacated), UZR is composed of four parts: Double Play runs (DPR), Outfield Arm runs (ARM), Range runs (RngR) and Error runs (ErrR). Martinez doesn’t have any DPRs, as he hasn’t initiated any double plays, and because he has yet to play in the outfield⁶, he has no ARMs (his career values for these two are 0 and -0.2, respectively).

It then comes down to the other two components: RngR and ErrR. For his career, he has values of 1.9 and 0.4, respectively, for these stats; in 2013, however, he has values of 1.2 and 0.3, respectively. Again, if we spread these out over ten times his current playing time at first (to get 970 innings, or ~110 games), we get a 12 RngR and a 3 ErrR. While the latter figure is rather formidable–it would lead the league this year–it is the former that truly sets him apart. An⁷ RngR of 12 as a first baseman would be the fifth-highest ever; yes, UZR only goes back to 2002, but that’s still saying something. The only better seasons would be Pujols in 2007 (21.0)(!), Adrian Gonzalez last year (14.6), Travis Lee in 2003 (13.4), and Justin Morneau in 2005 (12.2).

Obviously, this whole exercise should be taken with a grain of salt. 97 innings of defense is an incredibly small sample size, and Martinez’s track record suggests this is almost definitely a fluke. What, then, does this mean? Fluke or not, the Tigers continue to start the ironically-named Prince Fielder and his -4.9 UZR (-4.8 UZR/150) at first base; this point was brought up earlier this year. Despite the welldocumented historical awesomeness of their rotation (to say nothing of that guy over at the hot corner), the Tigers would only get the 3rd seed if the season was to end today, and their defense at first base is a big reason why. While his health concerns would make a full-time move to first unfeasible, playing him there a little more often (at least more than 11 times) certainly couldn’t hurt.

Overall, though, what do I take away from this? Well, as I said earlier

—————————————————————————————————————————

¹It should also be noted that his career UZR (not adjusted for playing time) is 2.1, as he has played roughly a full season’s worth of games (163, to be exact) at first base over the course of his career.

²Though you wouldn’t know it from looking at his FanGraphs page (which identifies him as a catcher, despite him having caught all of 15 innings this year).

³Really, SpellCheck? “Should’ve” isn’t a word? You know, I don’t recall aksing for your opinion, SpellCheck.

⁴Although to be fair, he did do this.

⁵Especially since this is a defensive stat, for which a sample size of three years is recommended for the best analysis.

⁶Don’t tell Leyland I said that–he might take it as advice.

⁷A or An? I suppose it depends on if you say the anagram or the full name.


On Slow Fastballs

While thinking about Jeff’s post on the fastballs of over 100 miles per hour, I thought it might be informative to look at the pitchers who have pitched their fastballs the slowest this year.  No, it’s not as flashy as those who live at the top of what’s humanly possible, but it makes for an interesting contrast.  What’s more, you’ll often hear broadcasters say something along the lines of “you don’t need to throw 100 if you can locate your fastball.”  Is that true for pitchers who aren’t anywhere near 100?

There have been 683 fastballs this season (as of September 13th) that registered below 80 MPH according to pitch f/x (grouping together fastballs, 4-seamers, 2-seamers, and cut fastballs).  Two men alone account for 526 of them, with a third adding another 80.  Any guesses on who they are? (Hint: Jamie Moyer is retired.)

Read the rest of this entry »


The Supposedly Decreasing Importance of Strikeouts

Note: I have no idea if I’m the first to do this, but quite frankly I don’t care.

Let me start by apologizing for the Papelbon thing. It was a pretty stupid article, and I was basically just looking for something to write about. While I’m at it, I should probably apologize for the bFI thing–I thought that would come out better than it did–and the last part of the Pettitte thing–when a guy’s gone 28-6 against you, you tend to harbor some animosity towards him. With all that said, I feel like this is a pretty good one, even if it is rather brief. So, without further ado…

By now we’re all sick of hearing it. Strikeouts don’t matter anymore for hitters! They’ve lost their stigma¹! These crazy kids today don’t know about plate discipline! For the most part, these criticisms all seem to be saying the same general thing: Strikeouts (or the lack thereof) are no longer correlated to offensive success.

Well, I can’t speak for you, but I have really grown sick of these baseless assertions. Other writers have touched on the fact that there is virtually no correlation between strikeouts and offensive performance², but these are all within the past several years. What I wanted to prove was that there has never been a correlation between the two.

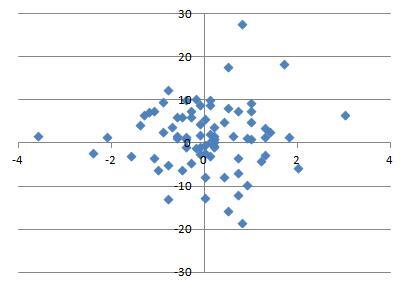
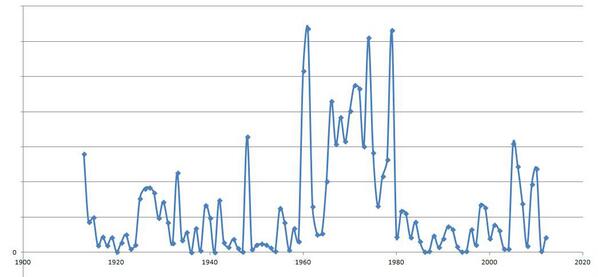
The methodology was pretty simple: Since wRC+ is the tell-all offensive statistic, I simply found the correlation, measured by R-squared³, between K% and wRC+ for every season from 2012 going back to 1913 (the first year that strikeouts were recorded for batters). I then graphed the resulting R-squared⁴ values by year for every year, of which there were 100.

And what, you ask, were the results?

Graph

“Well, golly, them folks was right!”, the reader might be inclined to say. Indeed, it would seem that–although the R-squared values have fluctuated heavily over the years–they are, overall, at a lower level than they once were. This would mean, of course, that strikeouts did matter more in the days of yore.

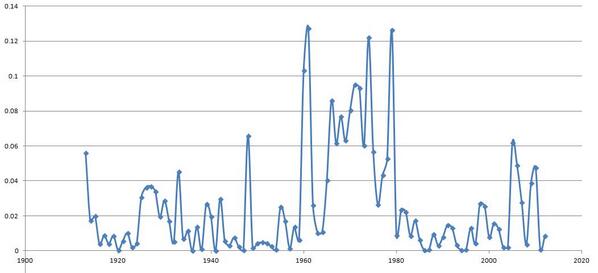
But wait! All hope is not lost! For you see, I purposefully excluded one key aspect of the graph in question: the labeling on the y-axis (i.e. the one upon which the R-squared values were measured, i.e. the vertical one). Put that back on, and what do we discover?

Graph2

For the entirety of baseball’s history, there have only been FOUR YEARS with an R-squared above .1. Remember, R-squared is on a 0 to 1 scale, and the higher the number, the greater the degree of correlation; an R-squared of .1 is basically what you get if you draw random points on a graph. Or, to put that another way:

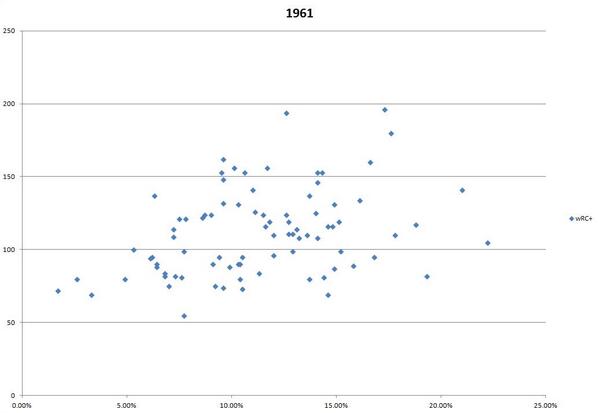
Graph3

That’s a scatter plot of the strikeout rates and wRC+s of players from the 1961 season (i.e. the one with the “highest” correlation). Does that LOOK like a correlation to you? Hopefully, you answered no (because of the way the internet works, I can’t know what your answer was, or even if you answered); any monkey⁵ with even a basic grasp of statistics could see that those two variables aren’t connected in any way.

What, then, does this mean?

Not only are strikeouts not correlated to offensive success now, they never have been, and probably never will be. Now, can we please stop saying they are⁶?

—————————————————————————————————————————————

¹I tried looking up specific quotes, but searching “strikeout stigma” just returned some ADHD thing.

²And, of course, scatter plots reflecting such will generally be more elliptical than straight.

³In case you’re unedumacated, R-squared measures the degree of correlation between two variables. It returns a value between 0 and 1; the higher the value, the greater the correlation, and vice versa.

⁴I’m forced to say “R-squared” to avoid confusion between that and the footnotes.

⁵Really, a monkey would probably be the one drawing the scatter plot.

⁶Or were. You know what I mean.


Evaluating Players in the Dark and Scooter Gennett

To make it as a big-league ballplayer, you have to do very hard things well, like hitting a very fast-moving baseball.  You also have to be able to do some reasonably easy things well, like see the baseball.  Why, then, couldn’t Brewers second baseman Scooter Gennett see the ball in the minor leagues?

In a recent Brewers broadcast, tv announcer Brian Anderson relayed a story about Scooter Gennett and his somewhat surprising performance in the majors (149 wRC+ and 1.4 WAR in 49 games so far).  Gennett claimed that he was just seeing the ball so much better in the majors due to poorly-lighted minor-league ballparks.

While minor league plate discipline data may not be a reliable comparison, if he was able to see the ball better in the majors, you would expect certain things to happen.  He’d make contact frequently, and probably solid contact.  Take a look at his contact numbers now 51 games into the majors:

Team

PA

OCon%

ZCon%

Milwaukee

162

77.1%

94.6%

His contact numbers so far are comparable to Matt Carpenter’s.  What we don’t see in Scooter’s major league data, however, is a real solid line drive rate to indicate he’s able to better put the barrel of the bat on the ball.  In fact, he ranks just 28th out of all second basemen this season with at least 150 plate appearances  with a slightly-above-league-average 22%.  He doesn’t appear to actually be recognizing pitches any better– his walk rate is actually down from his time in the minors, and his strikeout rate is up.  But there seems to be something to indicate that he’s seeing the ball well–he’s swinging and making contact on plenty of the pitches, and he figures out where the ball is and puts his bat on it.

Which bring us to the question:  What the hell is going on in minor-league ballparks, if in fact Scooter Gennett’s contact rates are really closer to Matt Carpenter’s and he feels the ball was harder to see in Nashville?

If you’re the Brewers, or any team really, wouldn’t you want to know that difference?  Especially when your other second base options this year have been Rickie Weeks (86 wRC+), Jeff Bianchi (57 wRC+), and Yuniesky Betancourt (Yuniesky Betancourt)?  I don’t know much (anything) about exterior lighting, but I would think that if there was a possibility that field conditions were affecting a team’s player evaluations, teams could reasonably justify investing some money into the lights for the minor-league affiliates.

“Seeing the baseball” seems like it’s discussed for well over half of players’ and managers’ attributions of a hitting streak or an unexpected jump in power, and this may account for Scooter Gennett’s explanation of his success with the Brewers in 2013. But with the margins for error and to gain a competitive advantage so small in the majors, these kind of anomalies may be well worth the attention of baseball ownership and their affiliated clubs.


Starters Destined for the Bullpen

Relievers tend to be failed starters. Most front offices have come to realize that a closer or a late-inning arm is not worth a big multi-year deal or a first-round draft pick. Instead, general managers are building quality bullpens out of failed pitching prospects, former starters, and journeymen relievers. Find a hard thrower who hasn’t managed to develop a full repertoire and stick him in the bullpen where he can air it out for one inning and get by throwing only one or two pitches. Or get a starter with wild platoon splits and convert him into a specialist who gets same-handed hitters out. Look at the Royals or the Rangers bullpens, the league leaders in relief WAR. Other than a post-Tommy John surgery Joe Nathan, you won’t find a big name there, or a big salary (Nathan’s 2/14 is the most expensive).

By initially using Z-Contact%, and then looking at factors such as pitch mix, walk rates, and fastball velocity, I identified six pitchers who I think are likely to end up in the bullpen. Three of the pitchers have trouble missing bats, despite being hard throwers, and a trip to the bullpen might allow them to pick up some extra velocity while focusing on a more limited repertoire. The other three have swing and miss stuff, but factors such as a lack of control or durability, or difficulty in developing secondary pitches have limited their effectiveness as starters.

Has a Fastball But Not Much Else

Joe Kelly has appeared in 57 games for the Cardinals since 2012, 28 of them being starts. Despite averaging over 94 mph on his fastball, Kelly has been more of a groundball pitcher. As a starter in 2013, he has posted strikeout and walk rates of 13.5% and 9.8% respectively.While Kelly’s changeup is solid, his curveball and slider are likely not good enough to keep him in the starting rotation. Despite Kelly’s smaller frame, he has managed to avoid the longball. Unless the 25 year-old masters a third pitch, the bullpen is a good spot for him.

Tyler Chatwood has started 17 games for the Rockies this season, and thanks to very high groundball rates has done well, even with poor strikeout and walk rates. As the righthander is only 23, I may be jumping the gun on calling him a relief pitcher, but his declining velocity and reliance on the fastball signal reliever to me, not to mention his undersized frame. While he has improved on his career strikeout and walk rates of 13.4% and 10.3%, his rates this year are still below average. Chatwood’s changeup is below average, and he needs to develop a reliable pitch to get lefthanded hitters out. Moving to the bullpen may preserve his velocity and allow him to focus on his slider.

Henderson Alvarez has started all 54 games he has appeared in since 2011. After returning from a long DL stint, Alvarez has shown some improvement from his 2012 season when he posted strikeout and walk rates of 9.8% and 6.7%, respectively. However, the righthander had had difficulties with lefthanded hitters, as his wOBA splits of .374/.248 show. Much of this is due to his struggles with his changeup. Alvarez has gained confidence in his slider, and it has been effective against righties. The 23 year-old will get a chance to stick in the Marlins rotation, but his smaller frame, limited pitch mix and injury history will likely relegate him to the bullpen.

Misses Bats…And the Strike Zone

Alexi Ogando has bounced around between the bullpen and the starting rotation. He started in 2011, relieved in 2012, and is starting in 2013. However, he has had durability issues. His second-half numbers in 2011 dropped off significantly with increasing innings, and he has taken two trips to the DL in 2013. Furthermore, his fastball velocity is down from 95.1 in 2011 and 97.0 in 2012 to 93.1 in 2013. This has caused his swinging strike rate to plummet from 13.2 to 7.9.  His walk rate is also up significantly. Ogando was strong as a starter in 2011, and he still shows swing and miss stuff, but a return to to the relief role he held in 2012 would do him well, particularly if Joe Nathan departs as a free agent.

Nathan Eovaldi is a 23 year-old flamethrowing righthander. However, the young hurler has not yet developed a reliable secondary pitch. Accordingly, his strikeout rate is well below the league average. Also, while his control has been better this year, he still walks hitters at an above-average rate. Though his fastball can get whiffs as shown by his above-average swinging strike rate, his lack of secondary pitches has given him difficulty in finishing off hitters. He had some success with his slider in 2012, but has struggled to command it consistently in 2013. If Eovaldi can stay healthy and learn a secondary pitch, he will remain a starter. More likely, he will slot into a high-leverage bullpen role where he can focus on airing out his already potent fastball.

Tim Lincecum won back-to-back CY Young awards in 2008 and 2009. The last couple years have not been as kind to Lincecum. His fastball velocity has dropped by 2 mph, and his walk rate has gone up. Furthermore, his HR/FB ratio has shot up to the 13-15% range, well up from his career rate of 9%. Lincecum still has swing and miss stuff, as his swinging strike rate has not dropped off from his career rate. Lincecum was utilized as a multi-inning reliever in the 2012 World Series, and dominated in that role. While Lincecum proved a lot of skeptics wrong by remaining healthy in a starter role, transitioning to the bullpen can maximize his effectiveness. However, depending on how much money he signs for this offseason, his new team may have an incentive to try and keep him in the rotation.

While a good starting pitcher will always have more value than a good relief pitcher, moving these pitchers to the bullpen can maximize their productivity. All of them profile as at least solid relievers, and at this point in their careers, I have my doubts that any of them, with the possible exception of Lincecum, can handle the rigors of starting.