Nick Markakis’ Lack Of Power
Nick Markakis has just two home runs thus far this season, and is on pace to hit just 9 on the year. I think it’s relatively clear now that Nick isn’t really a power hitter – he’ll get his share of homers but is more of a doubles hitter who is content taking outside pitches to left-field. “His share” though, has been quite low in 2010. I’m not saying I’m worried yet – the season is long and the ZiPS updated projections still has him finishing with 17 homers (only one less than last year) – but it is a bit curious.
One of the more obvious aspects of home run hitting is that it’s much easier when you pull the ball. Here’s a nice graph from an article by Mike Fast at The Hardball Times:

So where is Nick hitting the ball? Here’s all balls in play by year and field:
| LF | CF | RF | |
| 2006 | 31.4% | 34.0% | 34.7% |
| 2007 | 33.6% | 38.0% | 28.4% |
| 2008 | 29.4% | 36.4% | 34.2% |
| 2009 | 32.3% | 32.1% | 35.6% |
| 2010 | 31.6% | 46.2% | 22.2% |
He’s always been a guy who uses the whole field, but so far this year he’s not turning on as many pitches. And just the flyballs:
| LF | CF | RF | |
| 2006 | 46.0% | 34.7% | 19.4% |
| 2007 | 46.7% | 35.7% | 17.6% |
| 2008 | 47.2% | 37.7% | 15.1% |
| 2009 | 41.8% | 33.3% | 24.9% |
| 2010 | 37.5% | 50.0% | 12.5% |
Last year Nick hit a much higher proportion of flyballs to right-field, which helps explain why almost all of his home runs (14 of 18) were to right. This year, not only is Markakis not pulling flyballs but he’s also not hitting as many to the opposite field. Center-field is the deepest part of any park, and a full half of Nick’s flyballs are going out there. No wonder they’re not finding seats.
I’m not really sure why that’s happening – likely mostly normal variation – but Nick is getting a lot more fastballs and he’s done a pretty terrible job of getting around on that the pitch so far.
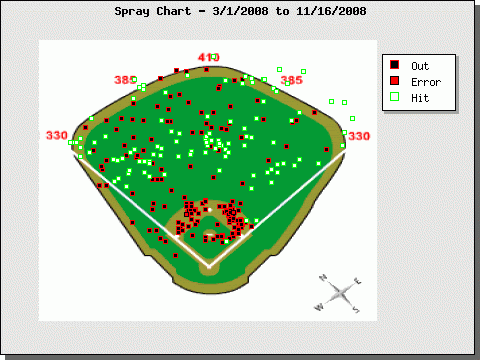
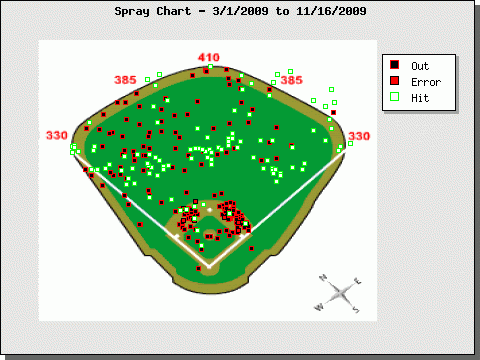
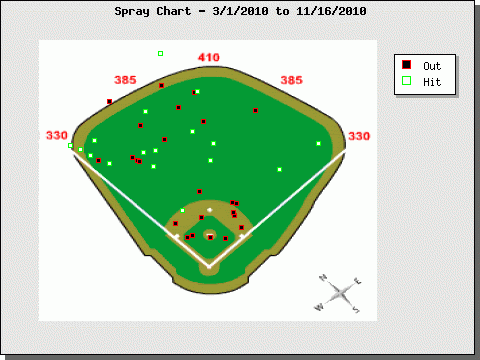
Compare these three spray charts on fastballs going back the last three years (courtesy of Texas Leaguers):
2008:

2009:

2010:

Right-field on that last one is pretty barren. I thought that maybe Nick hasn’t been able to catch up to a good fastball, but his contact rate against heaters at 94 mph or above has actually gone up the last three years; from 71% to 85% to 93%. Perhaps he’s more content to just make contact than to try to drive the ball. The spray charts for all pitches tell a similar tail; not all that many balls being driven to the “warning track”, or to right-field.
Nick’s 5% HR/FB rate is well below his career mark of 10.6%, as well as last year’s career low of 8.6%. I’m not might sure exactly how much we can expect that rate to go up this season, but I do think it’s clear that if Markakis doesn’t start pulling the ball in the air at least a little more often his power numbers won’t be particularly impressive at the end of the year.
Based on your thoughts, and the article, would you expect about 12 homers for Markakis in 2010 then?
I’d expect maybe 15, though it wouldn’t surprise me that much if it was only 10-12. If he keeps hitting flyballs at the rate he has been and ends up at last year’s 8% HR/FB then it’ll be ~14 HR.
Which is fine, as long as he keeps walking. I’ll take .300/.400/.450 over .300/.350/.500, though I’d really like to see .300/.400/.500 at some point.
Thanks, DM. I own Markakis and have been wondering what’s going on. And props for kicking off the community blog with such a solid post.
Nice first post. I like FanGraphs just the way it is, but this could be cool having a Sabremetrics/anecdotal fan spin to it. Sometimes i think the statistical aberrations can have an alternate explanation from us dorks who watch every game of said players.
I wonder if we end up with a lot more articles focusing on individuals, teams or just general baseball themes.
The great Daniel Moroz. No surprise that this is fantastic.