Machine Learning Our Way to the Gold Glove Award

I love good defense. Watching a center fielder chase down what should have been a blooped-in single, instead creating a shocked reaction from the baserunner as he turns and realizes he’s out is priceless. That classic, one hand in the dirt, rest of the shortstop’s body flying through the air snag, is truly my favorite. I know what people say about the excitement of a home run and I get it. The rifle-like, cracking sound of bat on ball, closely followed by fans standing and cheering and spilling and spitting! God, I’m going to miss baseball this winter!
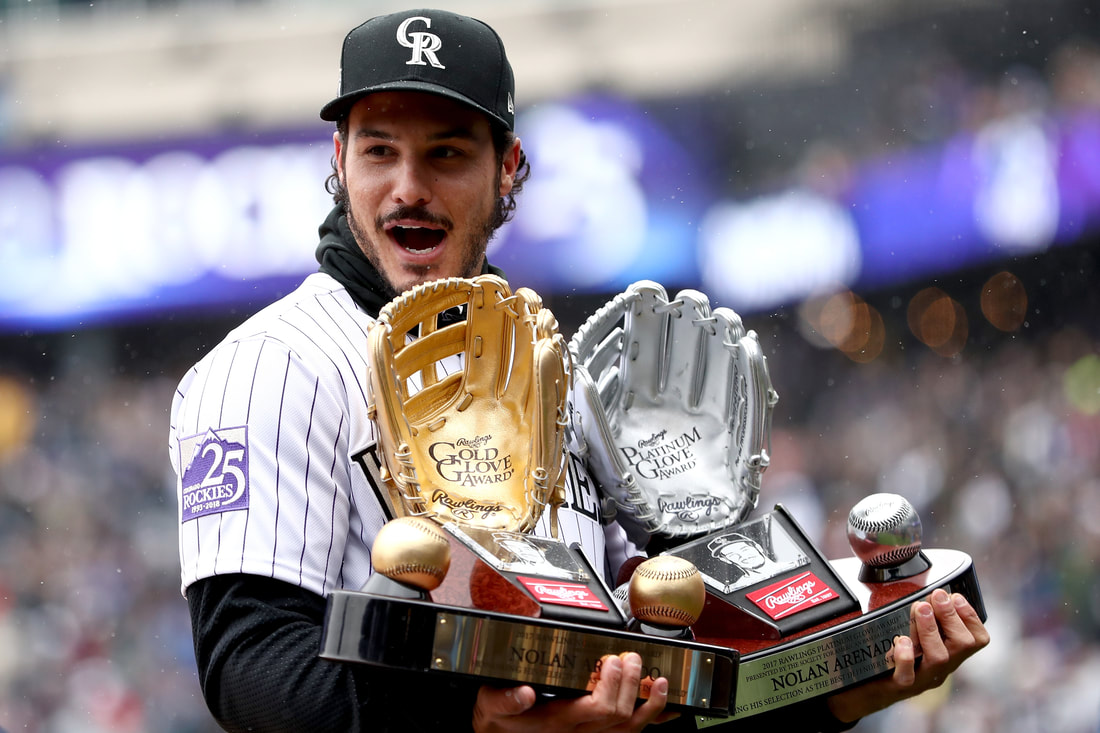
As the season comes to a close, we celebrate more than just home runs. We celebrate and award players for all their actions on and off the field. With that, it’s nearly time to award the best defensive players of the year with the Rawlings Gold Glove Award. There’s nothing like having a gold glover on your team and being able to watch them hold it down in the field all season long.
Like many awards, managers and team coaches get to vote on the Gold Glove. Managers can’t vote for players on their own team and they have to stay in their own league. In addition, they have to vote for players who qualify (mostly needing at least 713 total innings) as laid out by Rawlings. It’s nice to have the men who are closest to the game voting and giving out these awards, but there must also be some quantifiable way to determine who is deserving. According to Rawlings, 25% of the vote is left up to metrics. Using the SABR Defensive Index, advanced analytics are now built into the award. This index includes:
– Defensive runs saved (DRS)
– Ultimate Zone Rating (UZR)
– Runs Effectively Defended
– Defensive Regression Analysis
– Total Zone Rating
What if we could take that 25% of the vote coming from data and boost it? What if we still left the 75% up to a vote among the coaches, but we were able to give them a pool of the most qualified players based on the metrics? What if we learned from the past to predict the future? Let’s let computers create a pool of players each year to vote from. Okay, sure, old-school coaches and managers could vote outside of the pool of candidates if they felt the computer just doesn’t know what it’s talking about. Just check the “Other” box and fill in your vote.
Here’s how it’s done. Using FanGraphs.com’s leaderboard, I downloaded standard and advanced defensive metrics from 2002 on. This 2002 limit is due to the fact that it was in this year that advanced metrics such as UZR, DFS, and BIZ began to be recorded. The model was trained on the following metrics:
- Inn – Innings, or amount of time a player played in a season
- rGFP – Good Fielding Plays Runs Saved
- DRS – Defensive Runs Saved, a defensive statistic calculated by The Fielding Bible, an organization run by John Dewan, that rates individual players as above or below average on defense. A Gold Glove caliber player usually posts a +15.
- BIZ – The amount of Balls In Zone a player receives
- Plays
- RngR – Range Runs
- ErrR – Errors compared to the league average
- UZR – Ultimate Zone Rating, which puts a run value to defense, attempting to quantify how many runs a player saved or gave up through their fielding prowess (or lack thereof). A Gold Glove caliber player usually posts a +15.
- UZR/150 – Ultimate Zone Rating per 150 defensive games
- Def – Defensive Runs Above Average, which measures a player’s defensive value relative to the league average. An excellent statistic posts +20.
- G – Games played
- GS – Games Started
- PO – Put Outs
- A – Assists
- E – Errors
- DP – Double Plays
- DPS – Double Plays Started
- FP – Fielding Percentage
If you compare the features held in this model to the SABR Defensive Index used to measure Gold Glove candidates’ likelihood of receiving an award, you can see how much more detailed and full picture the ML model is.
Next, I attached a target column to this defensive fielding data, whether the player was awarded a Gold Glove at the end of the season (1 categorical variable) or not (0 categorical variable). Next, we let computers learn on these metrics, see who was awarded a Gold Glove based on specific metrics, and voila! We have a trained model.
The results were right in line with the SABR Defensive Index rankings (at least through August 18th, as the metrics have not been updated to reflect the end of the season)
Here are the model’s predictions for the Gold Glove Awards in 2019. Three players are listed as candidates, ordered from highest model down in each position in each league.
1B:
- AL – Matt Olson (OAK), Carlos Santana (CLE), Yuli Gurriel (HOU)
- NL – Paul Goldschmidt (STL), Rhys Hoskins (PHI), Anthony Rizzo (CHC)
2B:
- AL – Yolmer Sanchez (CHW), Jurickson Profar (OAK), Jason Kipnis (CLE)
- NL – Ozzie Albies (ATL), Cesar Hernandez (PHI), Kolten Wong (STL)
SS:
- AL – Marcus Semien (OAK), Xander Bogaerts (BOS), Francisco Lindor (CLE)
- NL – Paul DeJong (STL), Nick Ahmed (ARI), Jose Iglesias (CIN)
3B:
- AL – Matt Chapman (OAK), Kyle Seager (SEA), Jose Ramirez (CLE)
- NL – Josh Donaldson (ATL), Nolan Arenado (COL), Anthony Rendon (WSH)
LF:
- AL – Alex Gordon (KCR), Andrew Benintendi (BOS), Michael Brantley (HOU)
- NL – Juan Soto (WSH), David Peralta (ARI), Marcell Ozuna (STL)
CF:
- AL – Kevin Kiermaier (TBR), Jackie Bradley Jr. (BOS), Mike Trout (LAA)
- NL – Lorenzo Cain (MIL), Victor Robles (WSH), Kevin Pillar (TOR/SFG)
RF
- AL – Mookie Betts (BOS), Yasiel Puig (CIN/CLE), Kole Calhoun (LAA)
- NL – Cody Bellinger (LAD), Bryce Harper (PHI), Nicholas Castellanos (DET/CHC)
Hopefully, you see that the pool of candidates provided by the ML model makes sense. For details on the work and code that went into it, please see my GitHub link below.
GitHub link to notebook:
Nice work – I was wondering if you could comment on the accuracy of the model in your testing sample? Does it always catch the winner in the top 3 choices or not?
As a comment – historically gold gloves have been biased by offensive production, particularly in a few positions, so by using historical gold glove winners as the target in the training, you might bias the model.
Thanks for the comment Tyler. Thanks for that point. It’s true, the model needs to work out the bias. Here are the metrics for my final model using the Adaboost algorithm:
Training ACC – 0.897638
Testing ACC – 0.891107
Testing Precision – 0.575758
Testing F1 – 0.387755
Originally the model generated a 0 for players unqualified and a 1 for players qualified. However, I used the .predic_proba parameter to score the likelihood of the player receiving a 0 or a 1 and took the top 3 scores for each position. This is the difference between creating a pool of qualified players and actually predicting the player to win the award. More on the process can be found in my notebook:
https://github.com/lucaskelly49/Machine-Learning-Model-Predicting-MLB-Gold-Glove-Award-Winners/blob/master/2019%20GG%20Predictions.ipynb