Introducing BERA: Another ERA Estimator to Confuse You All
Coming up with BERA… like its [almost] namesake might say, it was 90% mental, and the other half was physical. OK, maybe he’d say something more along the lines of “what the hell is this…” but that’s beside the point. By BERA, I mean BABIP-estimating ERA (or something like that… maybe one of you can come up with something fancier). It’s an ERA estimator that’s along the lines of SIERA, only it’s simpler, and—dare I say—better.
You know, I started out not knowing where I was going, so I was worried I might not get there. As you may recall, I’ve been pondering pitcher BABIPs for a little while here (see article 1 and article 2), and whereas my focus thus far had been on explaining big-picture, long-term BABIP stuff in terms of batted ball data, one question that remained was how well this info could be used to predict future BABIPs. After monkeying around with answering that question, though, I saw that SIERA’s BABIP component could be improved upon, so I set to work in coming up with BERA. In doing so, I definitely piggybacked off of FIP and a little of what SIERA had already done. You can observe a lot just by watching, you know. I’m also a believer in “less is more” (except for when it comes to the size of my articles, obviously), so I tried to go for the best compromise of simplicity and accuracy that I could.
I know I keep promising you something that will predict BABIPs better, but I figure this will be a bit more interesting to you all, so you’ll have to wait on that.
So, what’s the point of an ERA estimator?
To me, the answer is that it will give you the best guess of a pitcher’s “true” ERA, mainly free of the effects of their defenses and, ideally, of fluky performances. Park adjustments are a nice thing too, but in the interest of keeping things simple, I’ve ignored that (you can apply after-the-fact park effects, if you want).
How do you measure how good an ERA estimator is?
Well, I guess by comparing your estimated ERA to actual ERAs in surrounding years, in terms of correlation, mean absolute error (MAE), and/or root mean squared error (RMSE). Why not just compare it to the current year’s ERA? Because that would be too easy, that’s why… oh, but also, if you’re using unreliable numbers to come up with it, it’s not really that useful. By unreliable, I mean that you can’t count on the numbers to stay very consistent from year to year. The unreliability thing is why ERA estimators don’t include hits and LOB% as components, despite their major contributions to ERA in their same year, and also why some estimators minimize (e.g. xFIP) or ignore (e.g. SIERA) home runs.
If you want to minimize the impact of fluky seasons, using just one year’s worth of data isn’t a great idea; furthermore, setting the minimum innings pitched (IP) at only 40 compounds the problem. However, that was the challenge I saw before me, so I went after it. As you see from that link, Matt Swartz has put the target on his SIERA’s back, by showing that it is actually better at predicting a pitcher’s ERA in the next year than actual full-blown ERA projection systems like PECOTA (by Nate Silver and company at Baseball Prospectus) and ZiPS (Dan Szymborski), which are in turn better than simple(r) ERA estimators like xFIP (Dave Studeman) and FIP (Tom Tango; independently, Clay Dreslough developed DICE, which is very similar).
However, SIERA is not without its detractors, such as Colin Wyers, who gave tearing SIERA a new one his best shot as a parting gift (the old version of SIERA had been offered by BP until the new version came here). Not all of Colin’s criticisms stick, in my opinion, and some of them are less applicable to the new SIERA, but I have found it to be true that SIERA looks much less impressive as the sample size of innings for a pitcher increases. It’s apparently very finely tuned to handle a 40 Innings Pitched (IP) minimum, but as I’m sure you know, the lower the minimum IP, the more “noise” you’ll see. I think it may be the case that BABIP is picking up a lot of the noise and trying to make meaning of it; this is why, in my estimation, SIERA is soundly beaten by something as simple as FIP when you look at career numbers. Of course, SIERA also gives itself the disadvantage of not considering home runs.
Yes, FIP picks up on long-term trends much better than SIERA — an 0.818 correlation to ERA vs. 0.722. That’s for the whole of 2002-2012, 100 IP minimum, by the way. But if the goal were simply to come up with something that matched ERA well, you’d want to go with something like: 2.6*WHIP + 42*HR/TBF – 9.5*LOB% + 6.423, which has a 0.979 correlation to ERA, and is correct to within an average of 0.127, vs. 0.371 for FIP. Why not use that? Well, all three of those factors are pretty unreliable from year-to-year, as you can see at the very bottom of my first article, with LOB% being especially so (well, HR/TBF is a bit better than the HR/FB you’ll see on that list, as the FB% connection is a lot more predictable than HR/FB, as it’s more influenced by the pitcher). If you’re trying to predict one year’s ERA from the previous one’s numbers, those numbers aren’t going to work so well.
So, here’s my goal: a formula that can beat SIERA in estimating the next season’s ERA, while still holding its own against FIP in the long-term. I’ll also include two other formulas that were tailored to each of those goals independently. Why do I think that should be the goal? Well, it will give more emphasis to the most repeatable stats, as does SIERA, without losing sight of the big picture, as SIERA arguably does somewhat. If you don’t agree with that analysis, at least you’ll have 2 other formulas to either extreme to choose from.
Heeere’s BERA
Without further ado, the formula:
BERA = (32.6*HR + 11.4*BB – 7.9*K)/TBF + (5*LD + OFFB – 3.4*IFFB)/(FB+LD+GB) + 2.2*ZC% + 0.22*SIP% + 0.51
Where:
- SIP% is the percentage of a pitcher’s innings that were pitched as a starter. You can find this (and all of these, really) most easily by setting up a custom leaderboard on FanGraphs (for this, divide “Start-IP” by total IP… ideally after converting 0.1 IP to 1/3, etc.).
- OFFB is Outfield Fly Balls, which is FB – IFFB
- FB+LD+GB represents the total of balls in play (including home runs)
- TBF, Total Batters Faced, is a.k.a. PA, Plate Appearances
- ZC% is Z-Contact%, which comes from the batted ball stats on FanGraphs (specifically, I used the non-PitchF/X version, as there were more years available), and represents the contact rate on pitches swung on that were in the zone. You may recall that I pointed this out in my first article as one of the strongest correlates of infield popups and therefore BABIP.
A simplified version of the formula is:
11.4*BB% – 7.9*K% + 5*LD% + FB%*(1 – 4.4*IFFB%) + 32.6*(HR/TBF) + 2.2*ZC% + 0.22*SIP% + 0.51
This takes advantage of the fact that FanGraphs has already made these numbers into rates for you (except for HR/TBF and StartIP%, of course). Be aware that on FanGraphs, there’s a big difference in how you have to interpret IFFB and IFFB% — IFFB is straightforward and represents the actual number of infield fly balls, whereas IFFB%, oddly, represents the percentage of fly balls that are infield flies… so, IFFB% really needs the context of fly ball percentage to be understood. This is why in my previous articles I always used IFFB%*FB%.
As I said, I have a couple more formulas to show you — one tailored to guessing the ERAs of surrounding years based on one year’s worth of data (I’ll call it SBERA, for SIERA-Beating ERA) and another to defeat FIP in the long-term (FBERA):
SBERA = (8.8*HR + 5.4*BB – 6.2*K)/TBF + (1.7*LD + 5.1*OFFB – 0.6*GB)/(FB+LD+GB) – 7*[OFFB/(FB+LD+GB)]^2 + 2.4*ZC% + 0.36*SIP% + 1.26
FBERA = (57*HR + 15.1*BB – 7.9*K)/TBF + (6.7*LD – 10*IFFB)/(FB+LD+GB) + 0.2*SIP% + 1.793
You can see that the SIERA beater, being closer to SIERA itself, puts a lot more emphasis on SIP% and a lot less on HRs, whereas the FIP beater is kind of a combo between FIP and my original xBABIP formula (plus SIP%). Warning: I’m not a big fan of SBERA — since it’s basically an attempt to out-SIERA SIERA, the potential flaws of SIERA are magnified within it.
Here’s the competition, via FanGraphs (with some paraphrasing…):
FIP = (13*HR + 3*BB – 2*SO)/IP + Annual “Fudge Factor” constant
xFIP = ((13*(FB% * League-average HR/FB rate))+(3*(BB+HBP))-(2*K))/IP + “Fudge Factor”
This “Fudge Factor” is also known as cFIP, and it’s there to tweak the league average FIP to be equal to the league average ERA in each year. You can find it here: http://www.fangraphs.com/guts.aspx?type=cn . SIERA also uses a similar annual factor, whereas mine don’t. SIERA, though, doesn’t bring the average completely to the league mean — I didn’t crunch the numbers, but it looks to me it instead sets it to the mean ERA for pitchers with at least 40 IP. As you can see, cFIP over my usual 2002-2012 sample has varied between 2.962 and 3.240. Keep in mind that my formula doesn’t possess this unfair advantage when you see the comparisons. Why don’t I use it? Well, what it’s basically doing is scooting itself over closer to the correct answer, after it notices that it gave an incorrect answer. So if the league ERA is about 0.1 higher than an unaltered FIP (from the previous year, e.g. 2006 vs. 2007) would predict, is that really a sign that all pitchers that year faced a tougher pitching environment, and thus we should add 0.1 to all their FIPs? I really doubt it. I find that difficult to justify, unless there’s some fundamental shift in the numbers involved between years; I think underlying reasons exist for the yearly ERA differences, and they should be explainable by other numbers, or else just be called “random chance” or “stochastic processes.” I understand the point of this for practical purposes, especially when you’re using only 3 factors, such as in FIP, but I’m not sure how theoretically sound it is. Now, a constant is one thing… but a constant that changes every year, after the fact… well, that’s a bit of an oxymoron, isn’t it?
Anyway, I’ll also include in the comparisons the results of predicting one year’s ERA using the previous year’s ERA.
There’s a newcomer I came across while writing this: pFIP, or Predictive FIP, by Glenn DuPaul at THT. Glenn’s latest and greatest formula, as far as I’m aware, is pFIP = (17.5*HR + 7*BB – 9*K)/PA + Constant (typically ~5.18).
Oh, right, one more: SIERA.
The Comparisons
SIERA may be the reigning champion of the 40 IP weight class, but can it go toe-to-toe with the heavyweights? Let’s look at the tale of the tape in this battle royale (with cheese). These are looking at the total numbers (i.e., each pitcher’s average season) for all pitchers with at least 100 IP between 2002-2012 (the sample size: n=934 pitchers), and comparing the results of each formula against the pitcher’s actual ERA. I’m using correlations, Mean Absolute Errors, and Root Mean Squared Errors here (I talk about these in my second article), along with the innings-pitched-weighted versions of each (which I think are more relevant, as they give more importance to the more reliable data). Keep in mind that SIERA, xFIP, and FIP are helped considerably by their fudge factors when it comes to MAEs and RMSEs (but the fudge factors don’t affect the correlations), and that pFIP is intended to have fudge factors, but I’m just using the non-tweaked version, which is what Glenn showed us. For some context, the cFIPs from 2002-2012 are, on average, 0.0608 away from their mean. A reminder: for correlations, the closer to 1, the better; for everything else, the closer to 0, the better.
|
SIERA |
xFIP |
FIP |
pFIP |
BERA |
FBERA |
SBERA |
|
|
Correl. |
0.7221 |
0.6904 |
0.8178 |
0.7640 |
0.8311 |
0.8445 |
0.7291 |
|
wCorrel. |
0.7604 |
0.7368 |
0.8454 |
0.7837 |
0.8417 |
0.8595 |
0.7359 |
|
MAE |
0.4489 |
0.4734 |
0.3714 |
0.5539 |
0.3819 |
0.3488 |
0.5156 |
|
wMAE |
0.3559 |
0.3743 |
0.2932 |
0.5268 |
0.3017 |
0.2820 |
0.4974 |
|
RMSE |
0.5944 |
0.6099 |
0.4788 |
0.6738 |
0.4958 |
0.4547 |
0.6390 |
|
wRMSE |
0.4666 |
0.4857 |
0.3830 |
0.6276 |
0.3933 |
0.3671 |
0.6022 |
The ranking, in my opinion, is: 1) FBERA; 2) BERA; 3) FIP; 4) pFIP; 5) SIERA; 6) SBERA; and 7)xFIP. FBERA easily beats FIP, despite the lack of the FF (fudge factor), and BERA is about even, despite the FF disadvantage. Since pFIP was designed to predict the next year’s performance with the same factors FIP uses (only dividing by PA instead of IP, now), there’s no surprise it doesn’t match the long-term as well. SIERA and SBERA are pretty close, but I’ll give the edge to SIERA on the basis of its superior weighted correlation. SBERA and xFIP are about even in terms of weighted correlation, but SBERA is apparently significantly better at guessing the ERAs of those pitchers with lower IP counts, so it gets the edge.
This next round of comparisons will be on SIERA’s home turf — comparing each pitcher’s stat for one season to their next season’s ERA (with a 40 IP minimum in both seasons… n=2612 season combinations).
|
ERA |
SIERA |
xFIP |
FIP |
pFIP |
BERA |
FBERA |
SBERA |
|
|
Correl. |
0.325 |
0.422 |
0.368 |
0.365 |
0.408 |
0.423 |
0.381 |
0.449 |
|
MAE |
1.081 |
0.876 |
0.898 |
0.935 |
0.945 |
0.871 |
0.933 |
0.842 |
|
wMAE |
0.974 |
0.789 |
0.801 |
0.836 |
0.876 |
0.778 |
0.838 |
0.756 |
|
RMSE |
1.398 |
1.137 |
1.156 |
1.212 |
1.179 |
1.133 |
1.212 |
1.098 |
|
wRMSE |
1.260 |
1.012 |
1.027 |
1.081 |
1.085 |
1.006 |
1.089 |
0.974 |
For this contest, I’d rank them: 1) SBERA; 2) BERA; 3) SIERA; 4) pFIP; 5) FBERA; 6) xFIP; 7) FIP; and 8) Previous year’s ERA. Again, I’m penalizing the FF users a little bit, and going with the correlations a bit more. The fudge factors are less of an advantage when it comes to predicting future years, however, as they’re based on the current year. I can see an excuse to use fudge factors if your goal is to predict future years. Really, when it comes strictly to predicting future ERA, the gloves are off, I say (all is fair in love and WAR?). I’m throwing in past ERAs, past BABIPs, and whatever else I can to see what sticks to the wall (as long as I’m not cheating by introducing information from the future years, of course). I do have such a model worked out, perhaps for a future article. But I do see a distinction between an ERA predictor and an ERA estimator in this regard. Anyway, perhaps I can be convinced to add fudge factors to BERA, by popular demand.
For the next contest, we’ll step into the home field of pFIP, on which Mr. DuPaul showed his formula had a superior correlation (well, correlation squared is what he showed) to the next season’s ERA over SIERA, FIP, and xFIP, when it came to pitchers who’d pitched at least 100 innings in consecutive years between 2007-2012 (n=479). I’ll be doing the same, only over 2002-2012 (OK, I found another area where I don’t think less is more — this is n=979).
|
ERA |
SIERA |
xFIP |
FIP |
pFIP |
BERA |
FBERA |
SBERA |
|
|
Correl. |
0.322 |
0.416 |
0.408 |
0.387 |
0.407 |
0.414 |
0.369 |
0.426 |
|
MAE |
0.822 |
0.694 |
0.696 |
0.720 |
0.759 |
0.675 |
0.721 |
0.669 |
|
wMAE |
0.801 |
0.678 |
0.677 |
0.697 |
0.776 |
0.659 |
0.705 |
0.659 |
|
RMSE |
1.032 |
0.862 |
0.866 |
0.902 |
0.920 |
0.848 |
0.913 |
0.831 |
|
wRMSE |
1.005 |
0.838 |
0.838 |
0.872 |
0.936 |
0.826 |
0.898 |
0.815 |
Well, I wasn’t able to confirm pFIP’s superiority here (nor was I for the 2007-2012 seasons), but it did close the gap a bit on SIERA compared with the 40 IP minimum sample. Well, really, all the FIPs come a lot closer to SIERA (and to BERA and SBERA) at this level of IP. xFIP is about even with SIERA. Anyway, perhaps some independent testing is required here to see who’s right about this pFIP vs. SIERA issue.
Why stop now? Here’s with a 150 IP minimum (n=631)
|
ERA |
SIERA |
xFIP |
FIP |
pFIP |
BERA |
FBERA |
SBERA |
|
|
Correl. |
0.329 |
0.409 |
0.405 |
0.404 |
0.416 |
0.429 |
0.399 |
0.430 |
|
MAE |
0.751 |
0.652 |
0.651 |
0.657 |
0.756 |
0.615 |
0.654 |
0.621 |
|
wMAE |
0.743 |
0.648 |
0.646 |
0.648 |
0.771 |
0.610 |
0.647 |
0.624 |
|
RMSE |
0.940 |
0.802 |
0.803 |
0.823 |
0.904 |
0.769 |
0.824 |
0.763 |
|
wRMSE |
0.930 |
0.795 |
0.793 |
0.809 |
0.916 |
0.760 |
0.813 |
0.762 |
OK, now the FIPs have closed the gap on SIERA, though BERA and SBERA are still looking good. It also looks like BERA has also overtaken SBERA by now. 200 IP minimum is next, with n=211 (last one, I promise):
|
ERA |
SIERA |
xFIP |
FIP |
pFIP |
BERA |
FBERA |
SBERA |
|
|
Correl. |
0.325 |
0.417 |
0.403 |
0.397 |
0.432 |
0.425 |
0.396 |
0.431 |
|
MAE |
0.628 |
0.612 |
0.601 |
0.579 |
0.849 |
0.570 |
0.591 |
0.639 |
|
wMAE |
0.627 |
0.614 |
0.602 |
0.578 |
0.861 |
0.572 |
0.590 |
0.648 |
|
RMSE |
0.795 |
0.743 |
0.725 |
0.718 |
0.978 |
0.697 |
0.731 |
0.764 |
|
wRMSE |
0.793 |
0.744 |
0.727 |
0.716 |
0.989 |
0.698 |
0.730 |
0.772 |
At this point, I’d say the two left standing are: 1) BERA; and 2) FIP.
How about a graphical representation of the advantage BERA has over SIERA when it comes to IP? Here’s how often BERA comes closer to the next season’s ERA than SIERA at various IP minimums:
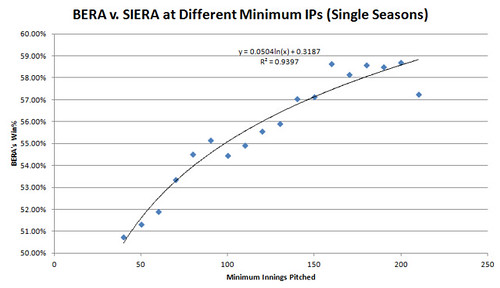
By 230 IP, BERA wins only 53% of the contests, but we’re also talking about a sample of only 27 individual seasons by that point, so I left that and 220 IP out. Anyway, it’s a very consistent pattern, as you can see, and it’s very much in line with the way BERA also matches up much better directly with ERA than SIERA does in the long-term, as shown in this graph (despite SIERA’s fudge factor advantage):
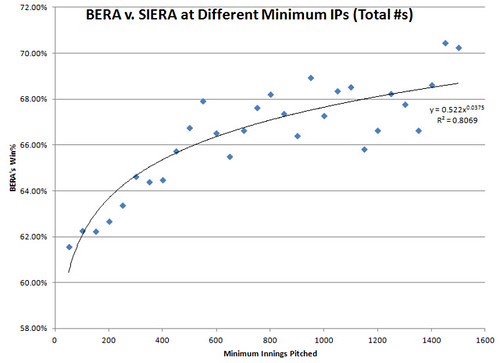
If you’re wondering how FBERA does against SIERA: in the next-season analysis, it starts off at 45.3% at 40 IP, then makes a steady climb and surpasses SIERA by around 140 IP. At 210 IP, FBERA beats SIERA 60% of the time, and it skyrockets up after that point (but, again, small sample size at that IP level). FBERA is, of course, better than SIERA in the long run too, but its win percentage stays close to 60% until it suddenly climbs to about 65% with 1500 IP.
SBERA is consistently in the 54-55% range against SIERA for the next season’s ERA, but drops off past a 170 IP cutoff, and is surpassed by about 200 IP. In the long-term, however, it looks horrible against it, starting around 48% at 50 IP, followed by an incredibly steady decline to about 8% by 1500 IP.
What about how well all these stats relate to the pitchers’ previous ERAs? Well, I figure that’s a lot less interesting to you fantasy baseballers out there, so here’s just the basics on the 40 IP minimum vs. the last season’s ERA:
|
ERA |
SIERA |
xFIP |
FIP |
pFIP |
BERA |
FBERA |
SBERA |
|
|
Correl. |
0.323 |
0.388 |
0.331 |
0.320 |
0.369 |
0.388 |
0.355 |
0.411 |
|
MAE |
1.088 |
0.884 |
0.918 |
0.965 |
0.993 |
0.880 |
0.945 |
0.837 |
|
RMSE |
1.403 |
1.130 |
1.168 |
1.238 |
1.225 |
1.129 |
1.219 |
1.074 |
It’s pretty consistent, I think. A summary of just the RMSEs, to keep this brief (too late for that, I know):
| RMSE vs. Previous Year’s ERA | ||||||||
| IP Min | ERA | SIERA | xFIP | FIP | pFIP | BERA | FBERA | SBERA |
| 40 | 1.403 | 1.130 | 1.168 | 1.238 | 1.225 | 1.129 | 1.219 | 1.074 |
| 100 | 1.136 | 0.984 | 0.985 | 1.052 | 1.043 | 0.975 | 1.043 | 0.938 |
| 150 | 1.072 | 0.923 | 0.913 | 0.975 | 1.017 | 0.923 | 0.996 | 0.882 |
| 200 | 0.972 | 0.886 | 0.876 | 0.919 | 1.020 | 0.879 | 0.958 | 0.852 |
About Standard Deviations
In the aforementioned article by Colin Wyers, he points out the relatively low standard deviation of SIERA and says:
Simply producing a lower standard deviation doesn’t make a measure better at predicting future performance in any real sense; it simply makes it less able to measure the distance between good pitching and bad pitching. And having a lower RMSE based upon that lower standard deviation doesn’t provide evidence that skill is being measured. In short, the gains claimed for SIERA are about as imaginary as they can get, and we feel quite comfortable in moving on.
About which, I have to ask: what if the difference between the “true” ERAs for good and bad pitchers isn’t really all that great? Some food for thought:

Perhaps his findings that SIERA came in at a 0.53 weighted standard deviation, whereas FIP’s was 0.83 and ERA’s was 1.71 (I’m not sure these are accurate, by the way… unless I’m misinterpreting what he was finding the standard deviation of), don’t really prove his case. If the goal of an ERA estimator is to guess the “true” ERA of a pitcher, then perhaps a 0.53 standard deviation is about right, in light of the way ERA’s standard deviation drops with greater IP. The standard deviation does reach about 0.53 for pitchers with over 1000 IP. Of course, it should be noted that a lot of pitchers never reach 1000 IP for good reason — they’re not good enough to be given that many IP (well, some were at the tail ends of their careers, too, and their best years weren’t in the sample). The ERA distribution in my sample:
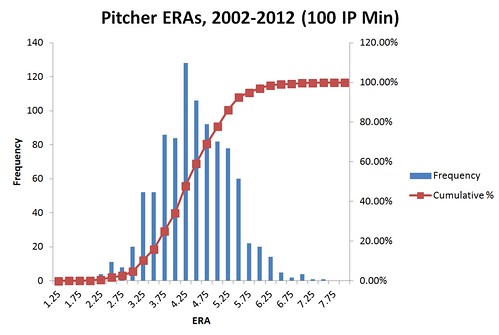
“4.25” is the mode, but you should read that as 4.0 – 4.25. It’s a pretty close to a normal distribution, but a tiny bit skewed positive (there are more on the high ERA side than a perfectly normal distribution would predict).
Also, let’s consider what the implication of a 0.5 standard deviation would be. If we say the mean ERA is 4.1, and assume a normal distribution, that would mean about 68.2% of pitchers should have an ERA between 3.6 and 4.6. 13.6% would be between 3.1 and 3.6, with another 13.6% between 4.6 and 5.1. 2.1% would be between 2.6 and 3.1, while another 2.1% would be between 5.1 and 5.6. The top tenth of a percent would be from 2.1-2.6, and the bottom 0.1% would range between 5.6 and 6.1. I don’t know about you, but if we’re talking about long-term ERAs for pitchers, that sounds about right to me. How many pitchers today would you pick to finish their careers with an ERA under 3.1?
Anyway, here are the standard deviations for the different formulas, at various minimum innings cutoffs, and for single seasons:
|
Min. IP |
ERA |
SIERA |
xFIP |
FIP |
pFIP |
BERA |
FBERA |
SBERA |
|
40 |
1.261 |
0.769 |
0.702 |
0.919 |
0.566 |
0.765 |
0.946 |
0.538 |
|
100 |
0.950 |
0.638 |
0.636 |
0.760 |
0.470 |
0.594 |
0.726 |
0.381 |
|
150 |
0.848 |
0.609 |
0.592 |
0.701 |
0.456 |
0.569 |
0.686 |
0.371 |
|
200 |
0.745 |
0.636 |
0.614 |
0.691 |
0.461 |
0.557 |
0.653 |
0.379 |
Thoughts
I like FBERA, because of its simplicity and the way it confirms my simple BABIP formula’s applicability to ERA estimating. FBERA’s main weakness is that LD% is something that only stabilizes in the longer-run, which throws off the formula’s usefulness in the shorter term (but it’s still better than FIP in the short term, overall). Still, despite LD%’s unreliability, it was always useful overall in predicting next season’s ERA, in all the formulas. I could definitely come up with a formula that used BERA’s factors, but weighted them towards achieving the same goal as FBERA, and it would help alleviate this weakness a bit, at the cost of extra complexity and worse season-to-season prediction.
BERA is something I’m pretty happy with. It is pretty close to FBERA, only it adds OFFB and Z-Contact%, which help strengthen its season-to-season predictions. Z-Contact% is something I discovered to be very useful in season-to-season BABIP predictions, as it’s really probably the biggest underlying factor to a pitcher’s popup rate, which is in turn one of the biggest factors in a pitcher’s BABIP. I could have used GBs instead of OFFBs (it would have been a different, negative weight), but I thought OFFBs made the simplified formula more handy. It just helps to round out the batted ball profile, for extra consistency.
SBERA is respectable, but it’s arguably kind of an example of what can happen when you try to get too fancy — you lose sight of some important things. Some of you will disagree with me, I’m sure, but I think that if all of its gains were legitimate, it would be better at predicting things long-term than it is. I believe it would beat xFIP long-term if it had a fudge factor, but that’s about it.
SIP% (the percentage of innings pitched as a starter) is a major double-edged sword in my formulas. I was really resistant to including it, due to my skepticism, but I caved when I saw that it really got results (I mean, it’s a minor factor, but the boost is pretty noticeable). This was really the main aspect of SIERA that I adopted into my formulas. My biggest issue with this stat is the major sample bias it introduces. Relievers with over 40 IP in a season really do have better ERAs (and BABIPs) than starters do. Relievers with less than 40 IP… not so much. In individual seasons from 2002-2012, for example, relievers with over 40 IP in relief have an average ERA (IP-weighted) of 3.6; those with less than 40 have an average of 5.2. I defined “reliever,” by the way, as those with at least twice as many innings in relief as starting. So, really, does being a reliever make you more effective, or does being an effective reliever make you more likely to pitch 40 or more innings in a season? I think it’s mainly the latter, but I’m sure there is some innate advantage to being a reliever — you can give more effort per pitch, and the hitters will be less familiar with you. Oh, and if you’re a closer, you generally don’t have to worry about bad relievers coming in after you and raising your ERA by letting your runners score. Anyway, it’s a tricky issue to deal with, but I’m inclined to think relievers and starters should be considered separately, and with different formulas (and if the pitcher does both, each role should be considered separately). I think the inclusion of SIP% makes things a bit sloppy, and really lowers the effectiveness of the formula for both relievers and starters, in order to try to make a compromise.
Oh yeah, also on the topic of SIP%, there’s a -0.53 correlation between it and ERA on a team level; that is, there’s a fairly strong connection between using relievers more and having a higher team ERA. Of course, I’m sure there’s also a connection between using relievers more and having bad starters…
Getting back a bit to Colin Wyers’ article, he tries to show that with enough innings pitched (at least 400), ERA becomes a better predictor of future ERAs than any of the ERA estimators. He does this by predicting the 2010 season with 2003-2009 numbers. Any flags go off for you? Yes, how reliable is that, really, if you’re putting all your eggs in the basket of 2010? I confirmed his results, more or less, but it turns out that if you try to predict 2011 with 2003-2009 numbers, BERA and SIERA are both consistently better than just using ERA. So consider me not sold on that analysis — you’re going to have to do that exercise for more years than just 2010 to be convincing. It seems entirely possible that 2010 was a fluke year in this regard. Whatever the case, it is probably fair to say that none of these ERA estimators (or projection systems, judging by Matt Swartz’ article) really give a major edge over just using career ERAs. So, really, the goal of using them has to be about judging single-season performances, more than anything.
So, as a final note, to sum up: 1) BERA is supposed to show the “true” ERA based on one season’s worth of data; 2) I believe it to be the best formula out there at this role, as far as I’m aware; and, 3) It’s a pretty limiting role — one that incorporates more seasons would be better. Still, I hope you’ve found all this useful. Perhaps in a future article, I’ll show you something not held down by the single-season shackles.
Steve is a robot created for the purpose of writing about baseball statistics. One day, he may become self-aware, and...attempt to make money or something?
Wow, that’s a lot to digest haha.
It passes a lot statistical tests, but I wonder if you could provide some concrete analysis to make BERA more tangible. What kinds of pitchers could expect to perform better with their BERA as opposed to their ERA or FIP?
I just want to point out that this:
(32.6*HR + 11.4*BB – 7.9*K)/TBF
If you turn TBF = 4*IP becomes this:
(32.6*HR + 11.4*BB – 7.9*K)/(4*IP)
Which becomes this:
(8*HR + 3*BB – 2*K)/IP
Which is FIP, with the HR regressed.
The interesting part of this article is not how it “beats” the others (which we’d expect, given that it uses more information), but how much the extra parameter used (Z-Contact%) helps.
Indeed, why not throw in fastball velocity like Steamer does? And, really, why not throw in the whole kitchen sink and see what sticks?
Also, BattedBall FIP (bbFIP) would have been a good comparison, since part of your equation is similar to what bbFIP uses.
Keep up the good work!
Sure thing, Dan (I agree, it’s quite a task to get through all that).
I think the pitchers who see the biggest benefit from my formulas are extreme fly ball pitchers, whose BABIPs should be expected to be better than SIERA estimates (and the rest don’t estimate BABIP at all).
Examples (career, 2002-2012):
Jered Weaver:
ERA: 3.24
FBERA: 3.47
FIP: 3.65
BERA: 3.68
SIERA: 3.93
Chris Young
ERA: 3.79
FBERA: 3.85
BERA: 4.10
FIP: 4.26
SIERA: 4.53
Not that two examples prove anything… anyway, BERA looks about the same as FIP in matching up career-wise with actual ERA (and FBERA is better), but then again my WHIP+HR+LOB% formula trumps them all by quite a bit. The year-to-year tests are the advantage BERA has over FIP, and those are kind of hard to demonstrate. Perhaps Fangraphs will put BERA up as one of its stats, if the fans demand it (hint, hint), and you’ll be able to see for yourself. I think in an upcoming article, I’ll show you some lists.
Appreciate all the data. My main source of concern with building and tweaking predictive formulas (in sports, finance…anything) is that people use the actual results they are trying to predict when creating/tuning the formula itself. I.e., failing to split the data into a training set and a test set. So, in theory, every year someone can re-run the regressions and come up with a seemingly superior formula that will be over-fitted to historical results and thus will likely be worse in terms of predicting the future. I’m certainly not saying there is no value in the exercise; but I personally wouldn’t put much weight into the precise coefficient values.
Tango,
Many thanks for the comments. You’re my stat nerd idol, haha. I only discovered you within the past couple of years, though, (embarrassing to admit here), so I have to plead ignorance on the bbFIP bit. I’ll definitely take a look at it.
Do I have this right?
bbFIP = 11*[(BB-IBB+HBP+LD) – (SO+iFB)]/PA + 3*(oFB – GB)/PA + 4.2 (seasonally adjusted to match league ERA)
Yeah, I didn’t rip off the FIP constants at all, but that’s just how it worked out via my regressions, which I suppose lends credibility to my results. I am surprised that it worked out that exactly, though — I didn’t realize until you pointed it out.
Well, you probably know this, but fastball velocity seems to be pretty irrelevant to BABIP, based on my research, although fastball “rise” is fairly significant to it as well as to strikeouts. Fastball velocity is a major factor in strikeouts, though, so I can see it being of some use when it comes to year-to-year correlations. I’ll give them both a shot (though doing so with PitchF/X will limit me to 2007+). I suppose I should also look into potential inputs into HR rates (and I think this new Edge% and Heart% by Bill Petti and Jeff Zimmerman is a potential lead, although there are fewer years available than I’d like).
I’m very curious what your thoughts are regarding seasonal constant adjustments (“fudge factors”) and about the use of Starting IP% (a.k.a. SIP%), which are the two issues I feel most on the fence about.
evo34, yes, I definitely agree with everything you said. That’s always a danger. I tried to minimize it by using the broadest sample I could, though. It’s obviously a lot harder to make something that fits all of 2002-2012 well, both year-to-year and overall, than it is for just 2010-2012. Anyway, what you say regarding overfitting is probably especially true of SBERA, and that was part of the point of that stat.
Regarding using training sets and test sets… well, call me a cynic, but it seems to me that researchers probably tend to tweak their formulas to narrow the gap between the two sets before presenting their findings. I just dropped that pretense, really.
Full disclosure: for FBERA, I regressed against the overall numbers, for SBERA, I regressed against the next year, and for BERA, I regressed against a combination of both (with greater emphasis on the next season). In a way, looking at the previous season was my way of validating the formulas — and in my eyes it did, as the RMSEs were about the same or better. Looking at the previous year RMSEs, I have a feeling that I misreported everything other than the 40 IP level, though (I think I forgot how my spreadsheet was set up for a second there), so I’ll revise that in the comments later. I think the numbers will be lower. Sorry about that.
Yes, I was correct in my suspicion about my RMSEs against previous ERAs. I’d forgotten to filter for the previous year’s IP properly. Here are the real numbers (and hopefully this turns out readable):
RMSE vs. Previous Year’s ERA
IP Min__ERA_____SIERA___xFIP____FIP_____pFIP____BERA____FBERA___SBERA
40______1.403___1.130___1.168___1.238___1.225___1.129___1.219___1.074
100_____1.036___0.872___0.868___0.932___0.971___0.873___0.952___0.832
150_____0.939___0.806___0.798___0.841___0.944___0.784___0.848___0.759
200_____0.807___0.786___0.760___0.778___1.007___0.753___0.805___0.775
Here are the differences between RMSEs for the previous year and the next year:
Previous – Next
IPMin__ERA___SIERA____xFIP____FIP____pFIP____BERA____FBERA___SBERA
40______0.005__-0.007___0.012___0.026___0.046__-0.005___0.007__-0.023
100_____0.004___0.011___0.002___0.029___0.052___0.025___0.039___0.001
150____-0.001___0.003__-0.005___0.018___0.040___0.014___0.024__-0.004
200_____0.012___0.043___0.034___0.060___0.029___0.056___0.073___0.011
Mean____0.005___0.013___0.011___0.033___0.042___0.023___0.036__-0.004
The “mean” at the bottom is the average of the values for the 4 IP cutoffs.
I may have to take back what I suggested about SBERA being overfit to the next year’s ERA, as it actually matches up slightly better with previous ERAs, despite that data having nothing to do with the formula or regression.
Despite FIP matching up better with future ERAs than with previous ones, you definitely can’t accuse it of being overfit to 2002-2012, as it’s been around so long. I’m not sure how long, exactly (Tango?), but apparently DICE, which uses the same weights, was created in 1998.
And as Tango pointed out, BERA uses the same weights as FIP for its main component.
I think the ideal future BABIP predictor would have to incorporate park, pitch location, speed and movement. If you could break it down by individual batter and count (and perhaps even time of day or weather conditions) that might be ideal as well. For example, what is the expected BABIP of a 95 mph pitch with 3in of vertical break 1in of horizontal break that lands 2in from the left of the strike zone 1in from the bottom, on a day with 20mph of wind at Wrigley in a 2-0 count at 7:35 pm on May 15 thrown to Raul Ibanez?
Probably you could take out a bunch of those factors which won’t make so much difference (like day/time), but perhaps you get my drift? I see Edge% as just the beginning of a look at a whole new world for xBABIP prediction.
eph — All very good points, but don’t forget about pitch sequencing, the kind of strike zone the umpire is calling, differences in lineups faced… there are a ridiculous number of factors involved, and it would be somewhere between extremely difficult and impossible to account for them all. To me, the real trick is making things as simple as possible, while still getting the job done essentially as well as the complicated version.
Before writing this, I did mess around with a lot of different variables in BABIP predictions (including velocity and movement), without a significant amount of success, though. Maybe there are some different things I can still do with them. I definitely will look into Edge%. You and Tom Tango have inspired me to try to make a new formula… you enablers, you.
I agree with the simplicity, the complexity of all of these factors makes it seemingly impossible to figure out a perfect formula without improvements in current technology. If I can enable you further, I would say look at not only Edge% but also high/low % and velocity. There are observed differences in babip for these and with an improved Babip you would get closer to a better ERA predictor.
Yeah, I was telling those guys (not sure if they read the comments) that I’d like to see the vertical equivalent of Edge%, as well as to see everything broken down by pitch type. I’m hoping I don’t have to do that myself… I don’t even know how I’d get the necessary data.
Oh I’m definitely going to read this….
But later, when I’m feeling more ambitious. I’ll presumptively say “good job” though.
Haha, I’ll tentatively say thank you, then. Yeah, it’s definitely not a light read.
Nice work. I think it is pretty futile to try to predict ERA though. Park factors, competition faced, changes in defensive personnel and luck just play too overwhelming of a role in these things. I mean none of these stats are going to work on RA Dickey this year as everything about his environment has changed. Pitchers just don’t have enough control over ERA.
I’d be more interested in how a component stat compares with itself year to year because if you can get a good correlation in that I think you are doing a good job of isolating what the pitcher can control and cut the noise out. I don’t think you can ever quantify the noise properly.
Thanks Ender. Well, yeah, ERA is unpredictable by its nature. It’s like rolling dice, basically… but the dice are weighted. I think the goal is to figure out what numbers the dice are weighted towards. This is true of predicting anything, but ERA is particularly a crapshoot.
I agree about the year-to-year correlations being important. I did put a list of YTY correlations at the bottom of my first article that you may find interesting. But, to provide a ridiculous example, there’s a very high year-to-year correlation in pitchers’ uniform numbers… it doesn’t mean it’s relevant to ERA. In coming up with these formulas, the key was using stats that correlated with the next year’s ERA. That’s why line drive percentage and HR rates were worth including, despite their year-to-year unpredictability relative to the other components — their relevance to ERA apparently outweighed that. But that’s a big part of why using more than one year’s worth of data is really important to giving an ERA prediction a fair chance.
Anyway, the whole point of this exercise was not to predict ERAs, but to provide a yardstick against which to measure pitcher performances, much like FIP and SIERA. I guess matching up with next year’s ERA better than the current ERA is just supposed to be our proof that our metrics are a fairer yardstick than ERA itself.
I’m just reading through this quickly so I don’t have time to comment completely, I promise that I’ll be back. But two brief thoughts are:
1.) Really good job, love the in-depth analysis
2.) The pFIP equation that you used was shown to be the best predictor at future RA9 (unearned runs included) not ERA for pitchers with 100 consecutive innings. In one of my pieces I showed the ERA version, the equation is only slightly different, but you’d probably see stronger results for pFIP
pFIP (ERA version): ((18.5*HR) + (6*(BB-IBB+HBP))-(8*K))/PA + 4.72
Whoops, very sorry about that, Glenn. I’ll re-run the numbers and post them down here. And thank you!
With apologies again to Glenn, here’s the results for the version of pFIP that was intended to match ERA:
pFIP (fixed)
IP Min__40_____ 100____ 150____ 200____ Career
Correl_ 0.4181_ 0.4316_ 0.4396_ 0.4414_ 0.7765
MAE____ 0.8607_ 0.6720_ 0.6317_ 0.6481_ 0.4539
wMAE___ 0.8156_ 0.6701_ 0.6344_ 0.6501_ 0.3710
RMSE___ 1.1022_ 0.8245_ 0.7724_ 0.7722_ 0.5813
wRMSE__ 1.0505_ 0.8220_ 0.7735_ 0.7712_ 0.4788
“Career” is, as usual, the entirety of 2002-2012, directly. Anyway, you were right, Glenn — this does look a lot better, and it does beat SIERA over the 100-150 IP range. I still have to vote for BERA in this contest, though, heh.
Now here are results for Tom Tango’s bbFIP (without annual adjustments, like pFIP above):
bbFIP
IP Min___40______100____150_____200_____Career
Correl__0.4101_ 0.4064_ 0.4004_ 0.4025_ 0.7499
MAE_____0.8823_ 0.6935_ 0.6412_ 0.5804_ 0.4354
wMAE____0.8333_ 0.6900_ 0.6417_ 0.5818_ 0.3443
RMSE____1.1373_ 0.8721_ 0.8066_ 0.7171_ 0.5657
wRMSE___1.0827_ 0.8669_ 0.8058_ 0.7132_ 0.4492
And here’s BERA’s results, so you don’t have to keep going back and forth:
BERA
IP Min___40______100____150_____200_____Career
Correl__0.4209_ 0.4194_ 0.4350_ 0.4297_ 0.8303
MAE_____0.8689_ 0.6739_ 0.6135_ 0.5664_ 0.3827
wMAE____0.8187_ 0.6672_ 0.6134_ 0.5671_ 0.3022
RMSE____1.1281_ 0.8439_ 0.7693_ 0.6969_ 0.4965
wRMSE___1.0718_ 0.8371_ 0.7691_ 0.6935_ 0.3939
This was great. And nuts. But also very great. Thank you for all your hard work for this wonderful reference.
You’ve been bookmarked.
Thank you! I think. You and the guys at BtB do great work too.
Ah jeez, everybody, I really wish I could do edits… I just noticed that latest batch of numbers was done using a method of weighting that was inconsistent with what I did in the article (the article used next year IP, this used same year). Another thing I fixed was I used an ERA that was computed beyond the hundredths place (which is what I used in the article, and I shouldn’t have done, when I’m trying to split hairs this finely). In the interest of not comparing apples to oranges, here are the revised wMAEs and wRMSEs that should be more consistent with those in the article:
wMAE
IPMin____40____ 100___ 150___ 200
SBERA__ 0.752_ 0.657_ 0.623_ 0.647
pFIP___ 0.770_ 0.663_ 0.635_ 0.658
BERA___ 0.773_ 0.657_ 0.609_ 0.571
bbFIP__ 0.788_ 0.677_ 0.636_ 0.586
SIERA__ 0.791_ 0.684_ 0.648_ 0.613
wRMSE
IPMin____40____ 100___ 150___ 200
SBERA__ 0.965_ 0.809_ 0.761_ 0.772
pFIP___ 0.977_ 0.808_ 0.772_ 0.780
BERA___ 0.997_ 0.820_ 0.759_ 0.698
bbFIP__ 1.012_ 0.848_ 0.797_ 0.717
SIERA__ 1.022_ 0.859_ 0.795_ 0.744
pFIP has very similar results to SBERA, doesn’t it? It looks very good until the higher IP cutoffs.
I notice tERA in the stats for pitchers on your site. What is this statistic and is there a reason it wasn’t put to the test with the other ERA predictors?
What is the best ERA predicting statistic listed for pitchers on fangraphs to be used from last year’s innings to predict this years ERA? Ie, for a pitcher who pitched 200 innings from last year, which statistic should I look at to determine whether he will outperform last years ERA or underperform?
Hey Rico,
Well, this is all I know about tERA: http://www.fangraphs.com/library/index.php/pitching/tera/
I left it out of the analyses because it was too far behind the others in its ability to predict the next season (0.988 MAE at a 40 IP min and 0.678 with 200 IP, both of which are distant last place). Plus, it seems like it’s not on many people’s minds. I should have mentioned it, though. Thanks for bringing it up.
I’d have to say the best ERA estimators currently listed on Fangraphs are SIERA for relievers, and FIP for starters. You could make a case that xFIP is the best all-arounder, though.
If anybody’s wondering what makes xFIP better with pitchers with low innings pitched than FIP, but worse with high IP, my thought is that it’s because of the instability, but also the importance of home run allowed rates. xFIP assumes that high or low HR/FB rates are a fluke; this assumption is more likely to be true in the case of a pitcher with fewer IP, though, as there are legitimate HR/FB tendency differences that become evident with more innings.
I know nothing about statistics, and this was really interesting. Thanks much!
Hey, very interesting article. i have a few questions about the analysis.
1. I was wondering if you tested the variables for normality?
2. if any univariate data was not normal, did you transform the variable?
3. Also, did you deal with any outliers? i found some pitchers had both leverage and cooks d values out of range.
4. Did you consider r-square values?
5. Any residuals diagnostics?
thanks for any response!!
Hey, thanks Ivan and DG.
Haha, DG, I think you’re the only person who read through this and thought, “he didn’t write enough.”
Well, I’ll give it a shot:
1) Yeah, I graphed them and gave them the eyeball test, anyway. LD% is pretty much exactly normal. I’d call the other big ones I introduced (those not in FIP) skew-normal. FB%*IFFB% peaks around 3.25%, but has more on the high side. Z-Contact% peaks around 90%, but has more on the low side. I think that’s to be expected given the boundaries are 0% and 100%, though. StartingIP% is of course not normal, though — it’s bimodal, around 0% and 100%.
2) I thought they (except for SIP%) were close enough to normal. I guess Z-Contact% could possibly be a flipped log-normal. Is it really necessary or worthwhile to transform them, though?
3) Nope, I didn’t remove outliers. But just because Greg Maddux (for example)doesn’t fit any of the formulas doesn’t mean we should remove him, I think. There probably is some legitimate explanation that we’re all missing (e.g. weaker contact).
4) R-squares of what? I did show a bunch of R’s (correlations), so you can just square those, unless I’m missing something.
5) Hmm, you mean to see if there’s a pattern I’m missing? They all look linear, with random errors when I plot actual vs. estimated ERA. Well, except for SBERA — something is definitely weird with that one, when I look at it in the career context. The biggest issue I see with SBERA’s plots, though, is that it’s too conservative in its estimates (doesn’t venture too far from the mean).
hey thanks! i ran some models but only had data from 2010-2012. im in the process of running models (and testing normality) with more data. i cant justify removing outliers necessarily in this case, but if you investigate them on a multivariate level you might find it to help increase your statistics. Just a thought.
some more questions:
1. What software did you use? (ive been using R and SAS)
2. What is wMAE and wRMSE?
3. Im a little confused how you get your formulas in those forms((HR+BB+K)/TBF)? ive been running multiple regression and just getting a more basic formula. but im adjusting the variables into the rates before running the models (which makes me think that the formulas are the same…yours being a little easier to plug in raw stats)
anyways…thanks for your time!
Did you have any particular multivariate analysis techniques in mind?
1) I did everything with Excel, believe it or not. With the analysis toolpak loaded, of course. It’s not the most efficient method for everything, I know, but it’s what I have, and it’s what I’m most comfortable with. It’s actually pretty flexible.
2) Ah, sorry, I covered that in my second article. It’s the the innings-pitched-weighted versions of MAE (mean absolute error) and RMSE (root-mean-square error). Although there’s a bit of bias introduced by using it, giving more weight to pitchers with more innings helps cut out the noise, I think.
3) Well, my method in Excel actually allows me to keep it in that form, but the individual rates should be just as good.
This may be dense of me… but shouldn’t any attempt to really account for a pitchers performance be compared not to his ERA but to his combined earned/unearned run average, as the nature of errors is that they are fielding dependent (except for errors made by the pitcher himself)?
Well, it’s debatable. I mean, the intended advantage of earned runs is that it estimates how many runs a pitcher would have given up had their defense done what it was supposed to. In other words, it attempts to factor out fielding, which is what you want if you’re comparing pitchers. It’s clear it doesn’t do a perfect job of that, so ERA is subject to criticism. I don’t see how the imperfection could be fixed by simply averaging out ERA and RA, though — some pitchers are probably hurt more by their fielders than ERA suggests, while others are hurt less.
I’d like to see how the following predictor fares: 0.5 * xFIP + 0.5 * SIERA.
Basically a hybrid of the two. We’ve seen in other FG posts that the average of predictions tends to produce better results than any of the single predictors do by themselves. Could the same principle be applied here?
Or, instead of a straight up average of the two, maybe there’s some better set of weights to use?
Super-delayed response here, but I just tried that formula. It produces correlations to the ERAs of surrounding years that are about halfway between those of xFIP and SIERA, not surprisingly. Since SIERA is generally the best of those two, it would seem better to just go with it.
You had me at BERA, Steve. How about incorporating swstr? I saw that steamer incorporated iffb% and swstr% into their expected ERA formula.
Thanks infinitely for this one.
Thanks! Coincidentally, I started messing around with a new version of BERA just the other day, trying to implement some changes I thought of since then, such as how HR are dealt with. Swstr% is definitely on the list of candidates for addition. Christopher Carruthers did some interesting things with it (http://www.fangraphs.com/community/ranking-free-agent-pitchers-by-tips/).
BTW, looks like for 2013, BERA and SBERA once again come out on top amongst the bunch I tested here (which of the two is better depends on the IP cutoff used). More on that soon, I think.
Nice. Thanks….relentless! Can’t wait to see that update. So in short…cause I missed the ip cutoff and cant read it again until later (but understand that siera better for rp and fip better for sp) what is bera and sbera better for? Thanks again.
SBERA seems to be the best of the bunch for relievers, and BERA seems the best for starters. SBERA is too conservative when it comes to starters, I think (bunches them too close to the mean), but that regression towards the mean helps it when it comes to relievers.
Steve,
Per earlier in this post, I used this for an eye test:
2.6*WHIP + 42*HR/TBF – 9.5*LOB% + 6.423
Do you mean 7.423 at the end? Maybe i missed something, but i think this outputs about 1.00 lower than the expected average.
Thanks,
Dan
Hm, it probably depends a lot on your sample. I just now tried it on league data back through 1920, and it looks like, if anything, the 6.423 constant is a little too high. It works pretty well in recent years, but it overestimates ERA by about 0.2 in earlier years.
Anyway, it’s not a great formula, or something I put much time into — it’s just something I was using to make a point.
Thanks – trying to manually weight BERA’s by SwStr%…to no avail…looking forward to your inclusion of it.
Best,
Dan
Great article Steve (12 months late, I know), a lot of good thoughts to churn things forward in the right direction. It can be all too easy to assume that the metrics we have available to us are the best, or even to pick a single metric for use always. But we need to look at the context of the situation for each metric in order to exploit the strong suits of each.
Or we could just use BERA, I suppose!