Has the Modern Bullpen Destroyed Late-Inning Comebacks?
During the World Series, I submitted an article showing that the team leading Los Angeles Dodger games after six innings wound up winning the game 94% of the time, the highest proportion in baseball. I suggested that maybe that’s why Dodger fans leave home games early; it’s a rational decision based on the unlikelihood of a late-inning rally. (Note: I was kidding. Back off.)
But between the lack of comebacks for the Dodgers and the postseason legend of Kansas City’s HDH bullpen, I wondered: Are we seeing fewer comebacks in the late innings now? The last time the Royals made the postseason, in 1985, the average American League starter lasted 6.17 innings, completing 15.9% of starts. The average American League game had 1.65 relievers pitching an average of an inning and two thirds each. This year, American League starters averaged 5.93 innings, completing just 2.5% of starts. The average game had just under three relievers throwing an average of 1.02 innings each. The reason that starters don’t go as long isn’t my point here, and has been discussed endlessly in any case. But looking at the late innings, today’s batters are less likely to be facing a starter frequently (52% of AL starters faced the opposing lineup a fourth time in 1985, compared to 28% in 2014), reducing the offensive boost from the times-through-the-order penalty. Instead, modern batters face a succession of relievers, who often have a platoon advantage, often throwing absolute gas. The Royals, as I noted, won 94% of the games that they led going into the seventh inning (65-4), and that wasn’t even the best record in baseball, as the Padres were an absurd 60-1. Are those results typical? Has the modern bullpen quashed the late-innings rally?
To test this, I checked the percentage of games in each year in which the team leading after six innings was the final victor. (These data are available at Baseball-Reference.com, using the Scoring and Leads Summary.) I went back 50 years, recording the data for every season from 1965 to 2014. In doing so, I got the 1968 Year of the Pitcher; the 1973 implementation of the DH; the expansions of 1969, 1977, 1993, and 1998; the Steroid Era; and the recent scoring lull. This chart summarizes the results:
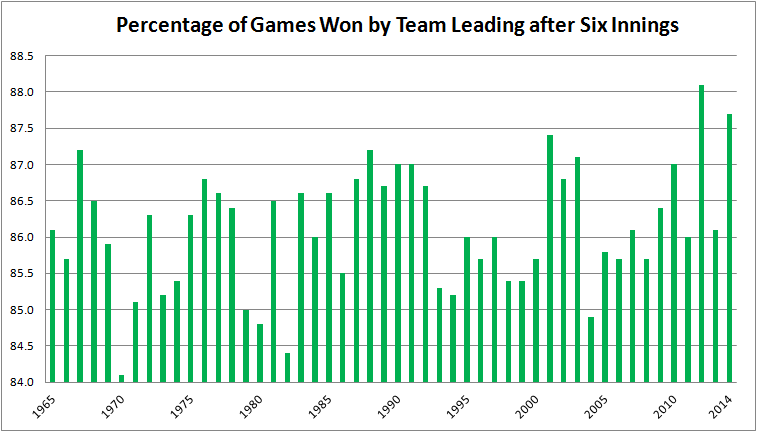
The most important caveat here is this: In Darrell Huff’s 1954 classic, How to Lie with Statistics, he devotes a chapter to “The Gee-Whiz Graph,” in which he explains how an argument can be made or refuted visually by playing with the y-axis of a graph. This is a bit of a gee-whiz graph, in that the range of values, from 84.1% of leads maintained in 1970 to 88.1% in 2012, is only 4%. That’s not a lot. My choice of a y-axis varying from 84.0 to 88.5 magnifies some pretty small differences. Still, the average team was ahead or behind after six innings 140 times last season, so the peak-to-trough variance is five to six games per year (140 x 4% = 5.6). That’s five or six games in which a late-inning lead doesn’t get reversed, five or six games in which there isn’t a comeback, per team per season.
The least-squares regression line for this relationship is Percentage of Games Won by Team Leading After Six Innings = 85.756% + .015%X, where X = 1 for 1965, 2 for 1966, etc. The R-squared is 0.06. In other words, there isn’t a relationship to speak of. There is barely an upward trend, and the fit to the data is poor. And that makes sense from looking at the graph. The team leading after six innings won 86.5% of games in the Year of the Pitcher, 86.6% when the Royals were last in the Series, 85.7% in the peak scoring year of 2000, and 86.1% in 2013. That’s not a lot of variance. You might think that coming back from behind is a function of the run environment–it’s harder to do when runs are scarce–but the correlation between runs per game and and holding a lead after six innings, while negative (i.e., the more runs being scored, the harder it is to hold the lead), is weak (-0.22 correlation coefficient).
So what this graph appears to be saying, with one major reservation I’ll discuss later, is that the emergence of the modern bullpen hasn’t affected the ability of teams to come back after the sixth inning. Why is that? Isn’t the purpose of the modern bullpen to lock down the last three innings of a game? Why hasn’t that happened? Here are some possible explanations.
- Wrong personnel. Maybe the relievers aren’t all that good. That seems easy to dismiss. In 2014, starters allowed a 3.82 ERA, 3.81 FIP, 102 FIP-. Relievers allowed a 3.58 ERA, 3.60 FIP, 96 FIP-. Relievers compiled better aggregate statistics. A pitcher whose job is to throw 15 pitches will have more success, on average, than one whose job is to throw 100.
- Wrong deployment. Analysts often complain that the best reliever–usually (but not always) the closer–is used in one situation only, to start the ninth inning in a save situation. The best reliever, the argument goes, should be used in the highest leverage situation, regardless of when it occurs. For example, when facing the Angels, you’d rather have your best reliever facing Calhoun, Trout, and Pujols in the seventh instead of Boesch, Freese, and Iannetta in the ninth. Managers may have the right pieces to win the game, but they don’t play them properly.
- Keeping up with the hitters. Maybe the reason teams over the past 50 years have been able to continue to come back in, on average, just under 14% of games they trail after six innings is that hitters have improved at the same time pitchers have. Batters are more selective, go deeper into counts, benefit from more extensive scouting and analysis of opposing pitchers, and get better coaching. So just as they face more and better pitchers every year, so do the pitchers face better and better-prepared hitters.
My purpose here isn’t to figure out why teams in 2013 came back after trailing after six innings just as frequently as they did in 1965, just to present that they did, despite advances in bullpen design and deployment.
Now, for that one reservation: The two years in which teams leading going into the seventh inning held their lead the most frequently were 2012 and 2014. Two points along a 50-point time series do not make a trend, so I’m not saying it’s recently become harder to come back late in a game. After all, the percentage of teams holding a lead were below the long-term average in 2011 and 2013. But I think this bears watching. Pace of game, fewer balls in play, ever-increasing strikeouts: all of these are complaints about the modern game. None of them, it seems to me, would strike at the core of what makes baseball exciting and in important ways different from other sports the way that fewer late-inning comebacks would.
Writer for Baseball Prospectus
No worries, we’re here to save baseball.
Could the average size of the lead after six have dropped? Certainly you’d expect that in a low run environment, but I can come up with some explanations for why it has happened in general – ineffective starters being pulled earlier in the game would be an obvious first guess.
Hey Tigers: TRY HARDER. You guys were tenth best in the majors (70-8) at preserving leads after six.
Kenny, that’s a great point that I hadn’t considered. Maybe the run environment is sort of self-correcting mechanism: The fewer runs being scored in general (including getting starters out earlier), the smaller the leads after six innings, and therefore the easier those leads are to overcome. I’m going to see if I can pull out some data to test that. Thanks for thinking of it.
This is an interesting question, but I think looking at game outcomes is accepting waaay more statistical noise than you need to to test your point. Lead changes are inherently very noisy, but runs are less so. One quick and dirty way to do this would be to ask “what percentage of all runs are scored in the 7th, 8th, and 9th innings?” That normalizes for run environment, but doesn’t isolate teams trailing in a close game. A more detailed method would be to split the answer to the above based on the margin of runs in the game (i.e. a split for leading by one, tied, trailing by one, etc.). Even splitting the data up like that you would probably get less noise with runs than you would with final game outcome.
Thinking the same thing, I did a quick look at late-inning runs scored.
The trendline of the percentage has indeed been dropping, but it’s so small as to be insignificant (about .5% over 30 years, IIRC), less than the year-to-year noise.
My theory was that if only one team used the bullpen advantage, then there would be an imbalance that would show up in these game outcomes. But since it’s a league-wide phenomenon, and both teams are equally likely to ‘shorten the game,’ then the comebacks are no more or less likely than pre-1980’s bullpen usage patterns.
Ultimately, that doesn’t seem to be the case. Basically the same percentage of runs are scored late as they always have been.
The true answer is probably more simple: Starters are getting more strikeouts, which causes them to throw more pitches, which causes more calls to the bullpen. Bullpen usage is the effect of a changing game rather than the cause.
Deploying relievers against relievers likely evens things out.
If one team was deploying relievers while other teams stuck with starters that team would almost certainly have an advantage in both coming back and holding leads.
Hey, DavidKB, AC, and filhok – I apologize to all of you; I didn’t receive notification of new comments. I your comments only today. I appreciate your interest and I’m sorry for the delay.
DavidKB, I agree that runs are going to be less noisy, but my dependent variable here is, in fact, game outcomes. Basically, I’m trying to see whether modern bullpen usage is turning MLB into sort of a bizarro NBA, in which you have to see only the first six innings of the game to know how it turns out. (Yes, basketball fans, I know the last-five-minutes thing is a canard. Sort of.) But to your and AC’s point, I retrieved runs scored by inning for 1965-2014, and there has, in fact, been a decline in late-innings scoring. I looked at runs scored in the seventh, eighth, and ninth innings as a percentage of runs scored in innings 1-9 (leaving extra-innings scoring out). Here are the percentages by five-year increments:
1965-69 31.0%
1970-74 31.4%
1975-79 30.4%
1980-84 30.2%
1985-89 30.1%
1990-94 30.0%
1995-99 30.0%
2000-04 29.7%
2005-09 29.4%
2010-14 29.4%
30.1% of runs scored in innings 1-9 were scored in 7-9 in 2014, the first time the percentage exceeded 30.0% since 1999. So it does seem that late-inning run scoring has been somewhat suppressed, as AC suggested, though it hasn’t had a marked effect on game outcomes. Maybe that’s because of the run environment over the past few years, but it doesn’t explain why late-inning run scoring as percentage of the total is down compared to the Deadball II years.
AC and filihok, I agree with the game theory aspect of bullpen deployment–everybody’s using effectively the same model so nobody has a comparative advantage–but wouldn’t it still be the case that if the model were successful, all teams would be having a harder time coming back from late-innings deficits? The reduction in late-inning scoring does suggest at least a partial success.