Getting Ahead with Wainwright and Moore
If I were to argue that Adam Wainwright and Matt Moore were having similar seasons, you’d probably question my analytical skills. They have similar win totals and are both major-league starting pitchers on good teams, but you generally wouldn’t consider them to have a lot else in common when thinking about them in the context of their contemporaries. Heck, they don’t even throw with the same arm! I’m not going to argue that they’re having similar seasons, but there is one thing they are doing at a surprisingly similar rate. Allow me to explain.
Let’s start by talking about how they are different. Wainwright goes much deeper into games, walks way fewer batters, gets a lot more ground balls, and limits runs a better rate. FIP and xFIP like him a lot better, no doubt because he doesn’t issue free passes. Moore strikes out more batters, but other than that he doesn’t measure up to what Wainwright brings. Wainwright is right in the thick of the NL Cy Young race, Moore is just having a solid season.
| Name | GS | IP | K/9 | BB/9 | HR/9 | BABIP | LOB% | GB% | HR/FB | ERA | FIP | xFIP | WAR |
| Adam Wainwright | 21 | 154.2 | 7.97 | 0.99 | 0.35 | 0.308 | 76.30% | 49.10% | 5.30% | 2.44 | 2.20 | 2.72 | 4.9 |
| Matt Moore | 20 | 116.1 | 8.66 | 4.33 | 0.62 | 0.252 | 77.00% | 39.00% | 6.20% | 3.17 | 3.56 | 4.22 | 1.9 |
The comparison comes as a byproduct of some aimless leaderboard scanning and a stray thought. I started wondering about the correlation between Zone% and BB%, much in a similar way to how Jeff Sullivan considered the connection between Contact% and K% earlier this year. My study led me to the production of this graph, with BIS data through July 24:

Generally, a higher Zone% correlates with a lower BB%. The slope coefficient is -0.33 and is statistically significant, but the Adjusted R squared is only .2116. Pitchers who pound the zone usually walk fewer batters than pitchers who don’t, but there is a lot of unexplained variation. Matt Moore and Adam Wainwright carry quite a bit of the blame for that as they have nearly identical Zone% and extremely different BB%. In fact, Wainwright is 1st in BB% and Moore is 87th among qualified starters.
Wainwright has a K/BB ratio above 8. Moore’s is 2. Wainwright and Moore both strike out between 22 and 24% of the batters they face, but Wainwright walks less than 3% and Moore walks more than 11%.
Amazingly, Wainwright and Moore throw 44.5% and 44.2% of their pitches in the zone, respectively, despite what their walk rates seems to be telling you.
If you give them both 100 pitches and 25 batters, they’ll both average 55-56 strikes but Wainwright will walk fewer than 1 and Moore will walk close to 3. That’s impressive. No other two starters in baseball this year have such similar Zone% and such different walk rates. (Ubaldo is the data point above Moore, but he is a full percent behind Wainwright in Zone%)
| Name | O-Swing% | F-Strike% |
| Adam Wainwright | 38.40% | 65.70% |
| Matt Moore | 28.50% | 51.90% |
Well that’s something. Wainwright and Moore throw the same number of pitches in and out of the zone, but Wainwright gets batters to chase when he leaves the zone much more often and starts at bats with strikes much more often as well. It’s pretty interesting that two pitchers can throw the ball in the zone with the same frequency and get such dramatically different results.
You can see that despite hitting the zone with similar frequencies, Wainwright hits the zone early to set up chases later on in the at bat. Here are their zone plots on first pitches.
Wainwright

Moore

Wainwright and Moore are a great example of how averages can sometimes be deceiving. Despite throwing the same percentage of pitches in and out of the zone, they are throwing them in and out of the zone at much different times. Wainwright pounds the zone early and gets hitters to chase late. Moore misses more consistently.
Think of it this way. When Wainwright throws a pitch out of the zone, he’s doing it when he’s ahead in the count so hitters are forced to chase and get themselves out. Moore leaves the zone with less purpose and more because he doesn’t have great control. It balances out to the same percentage, but the effects are much different. You can see it in BB%, you can see it in ERA, and you can see it in FIP and other advanced stats.
Matt Moore is still a very promising young pitcher and is still quite valuable in his current form. Nothing about this is meant to degrade Moore, but rather to highlight some extreme variation and consider how important it is to get ahead of hitters. By the third and fourth pitches in at bats, Wainwright has hitters chasing and Moore has hitters taking.
Getting ahead early with a first-pitch strike is really important as it is much more predictive of BB% than Zone%. The slope coefficient is nearly identical to Zone%, but the Adjusted R Squared comes in at .4020.
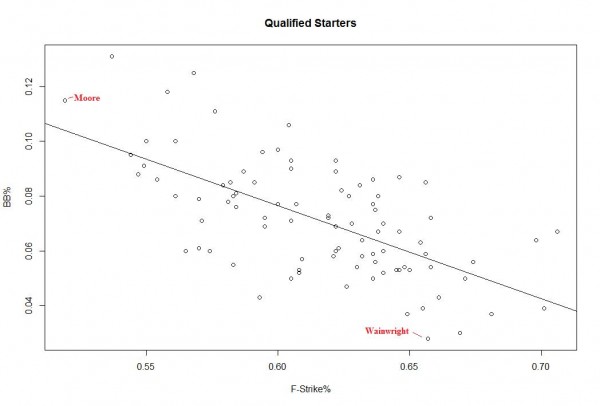
Finding the zone is important, but as Wainwright and Moore demonstrate, finding the zone early is more important. Matt Moore has tremendous stuff, but if he hopes to get results to match Wainwright, he’s going to have to command it more effectively, even if he is hitting the zone with the same frequency.
Moore doesn’t really profile as a Wainwright kind of pitcher, but Wainwright’s own impressive drop in BB% rate can be instructive for pitchers looking to improve. Wainwright is throwing pitches in the zone less frequently as he’s aged, but is adding to his first-pitch strikes. I’ll let the data speak for itself. Adam Wainwright is fantastic.


Neil Weinberg is the Site Educator at FanGraphs and can be found writing enthusiastically about the Detroit Tigers at New English D. Follow and interact with him on Twitter @NeilWeinberg44.
“If you give them both 100 pitches and 25 batters, they’ll both average 55-56 strikes but Wainwright will walk fewer than 1 and Moore will walk close to 3.”
Whoops. That is supposed to be “pitches out of the zone” instead of “strikes.” Sorry about that.
Interesting way to look at walk rate. I hadn’t really thought of it like that before.
And I see you have images!
Nice work.
Is this the real cause of the Dave Duncan effect? He was a big proponent of getting ahead in the count, especially with first pitch strikes. That would be a good study.
That’s an interesting question. I don’t know the answer, but Wainwright made the change after Duncan left St. Louis. Still possible, but I don’t know. That’s worth thinking about.
You are right about Wainwright. Duncan was Wainwright’s pitching coach through 2010 (and 2011 on DL).
Your article got me thinking more of random pitchers that typically have low name recognition but seemed to do better than expected with Duncan and the Cardinals.
No doubt. Your point is interesting. Thinking about looking into it.
To be fair, every pitching coach stresses first pitch strikes and getting ahead in the count. It’s a cliche for a reason.