Controlling Launch Angle To Limit Damage
Successful pitchers limit damage by minimizing the quality of contact they allow. How they can best do that remains up for debate, as pitchers tend to focus on some combination of deception, movement, and location to try and miss barrels. I propose that the most important pitcher-influenced variable to quality of contact is Launch Angle, and understanding and influencing it ought to be a priority for all pitchers. It is clear that Exit Velocity is the single most important predictor of a batter’s success, but that relationship cannot be manipulated much, if at all, by any pitcher. Across baseball, batters’ Exit Velocity distributions are much tighter than their Launch Angle distributions. This means pitchers are likely better able to directly influence Launch Angle than Exit Velocity, which is quite “sticky” around the mean for a given hitter. No amount of talent on the mound can rob Giancarlo Stanton of the strength that produces 120+ mph homers, but that doesn’t mean his production cannot be neutralized. Alex Chamberlain of RotoGraphs recently explored this idea at great length, coming to much the same conclusion.
This, to me, demands a new pitching approach centered around what I call “Launch Angle Deflection,” or the attempt to induce weak contact and get outs by “deflecting” batted balls to extreme (and therefore suboptimal) launch angles. A recent thread by Tom Tango illustrates this quite well, where each line represents an 8-degree “group” of launch angles. At either end of the launch angle spectrum, batted balls closer to the edge produce lower wOBA at all Exit Velocities.
Here, the harder you hit it, and the LOWER the launch angle, the better the outcomes, when your launch angle is at 24+ pic.twitter.com/fwVNjIYaCB
— Tangotiger (@tangotiger) August 5, 2020
To quickly recap:
- I’m not convinced pitchers can substantially influence batted ball speed through any combination of pitch selection, movement, or execution.
- Independent of batter, an average-hit ball plays worse at more extreme launch angles in either direction.
If influencing Launch Angle is the key to limiting damage and getting outs, how can a pitcher do so? To answer that, I ran a series of Variable Importance tests on a number of different pitching metrics to determine which have the greatest impact on Launch Angle. Analyzing every batted ball in the Statcast Era through 2019, the results were clear: the most significant variable to Launch Angle across pitch types and irrespective of pitcher handedness was pitch height. The results from right-handed four-seamers exemplify this, and the rest can be found in the links below. The top four variables by importance are all related to the height of the pitch and eat up the vast majority of the statistical significance to launch angle.
It should be noted that curveballs and sinkers returned vertical break in the top spot, which is the physical means to the end of pitch height, and not a significant exception in my mind.
MLB Launch Angle Variable Importance by Pitch Type
Represented graphically below, we can see that pitches of all types up in the zone tend to produce higher launch angles, while most ground balls occur on low pitches. This makes sense.
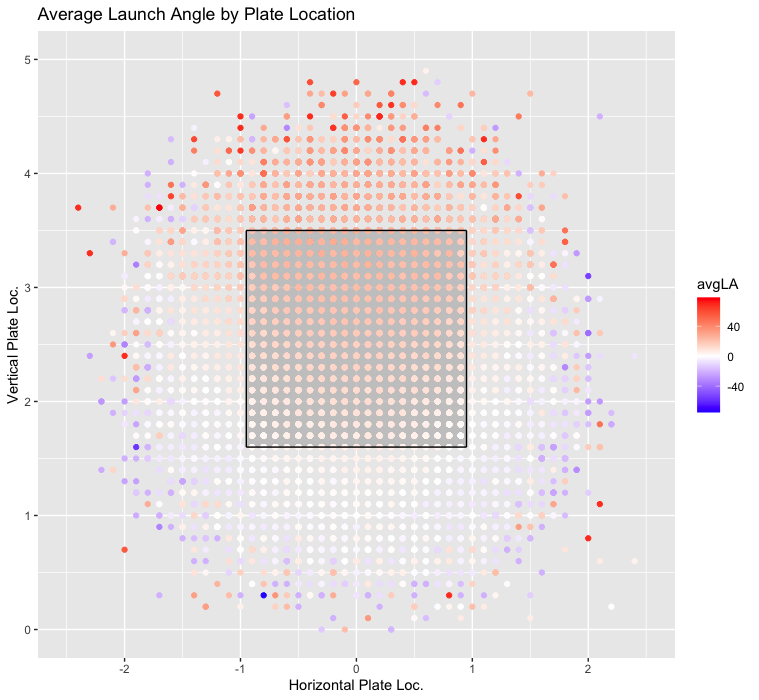
This visual from Connor Kurcon groups launch angles into curved bands:
A few people yesterday suggested making the LA by Pitch Location plot into a hex bin, so I did that, and yeah! It is a bit easier to tell the difference in groupings pic.twitter.com/gX9O5O3iOR
— Connor Kurcon (@ckurcon) July 21, 2020
Putting it all together, the suggested pitching strategy is to push hitters to the nearest extreme of Launch Angle given their average. This could look radically different depending on the hitter, which I’ll explain using two players with similar exit velocities on quite opposite ends of Launch Angle: Joey Gallo and Eric Hosmer.
Looking at each player’s batted ball distributions is helpful as well:


The two have EV distributions that look quite similar (in blue), but Hosmer’s launch angles are centered much lower than Gallo’s. This means we need different approaches to pitch to each player. Starting with Gallo, that 22° average LA puts us much closer to extremes on the high end of LA, suggesting primarily pitching up in the zone. This may seem counterintuitive for a guy with Gallo’s home run pop, but trying to keep him “in the park” by inducing ground balls forces a pitcher to try and pull him through the most dangerous launch angles in the middle to get to comparatively harmless single-digit and negative LAs. Looking at his xBA by Launch Angle and pitch height makes this easier to understand:

The place where low-damage batted balls lie closest to the trend line between plate height and launch angle is at pitch heights above ~2.75. Pitches there don’t require a mistake or uncharacteristic outcome to get outs, as they generate launch angles that neutralize his power. Trying to get Gallo on the ground by pounding the bottom of the zone leaves far less room for error, as there are plenty of high xBA balls below the trend line.
Hosmer, on the other hand, is far more susceptible to that same low-ball strategy because his nearest extreme of Launch Angle is the negative range where ground balls (i.e. outs) occur.
Looking at the same chart for Hosmer confirms this:

Hosmer’s average LA is so low that pitchers should stay out of the top of the zone where he is more likely to elevate and succeed beyond his average. Hosmer’s batted balls with the highest xBA are concentrated above the trend line, meaning like Gallo, pitchers should lean into his tendencies and go the other way, relying on pitches breaking and finishing down in the zone to produce contact that will not hurt them.
Deciding which players should be pitched in each direction is a challenge all its own, and the “break point” will shift based on a pitcher’s and staff’s priorities. If the goal is to limit the damage done by an average batted ball, I’d posit a “break point” around a 20° average Launch Angle. Given a game situation where a pitcher is more interested in limiting the damage of an especially hard-hit ball, the threshold for attacking up in the zone ought to be higher. At EVs above 100 mph, xWOBA increases with every degree of launch angle between 8 and 32. In trying to mitigate this worst-case scenario, a pitcher may be more comfortable trying to push a batted ball from 20° to a less-dangerous 8° rather than up to 32° by going through 12° of more dangerous territory. With a final assist from Tom, we can see this xWOBA variability in the middle ranges of LA:
The sweet spot happens at 8-32 degrees, where you get different results based on how hard you hit it.
Under 70 AND over 100: harder you hit it, better outcomes on higher launch angles.
At 80-95, harder you hit it, better outcomes on LOWER launch angles. pic.twitter.com/twZGBKQy0O
— Tangotiger (@tangotiger) August 5, 2020
This is why we’ve seen a huge wave of successful high-efficiency fastballs pounded up in the zone from pitchers like Justin Verlander, Gerrit Cole, and Lance Lynn. They risk giving up home runs at exceptionally high EVs, but the tremendous whiff rates and weak air outs they generate are hugely beneficial.
In practice, I think these findings suggest teams move away from a “heat map” approach to attacking hitters by throwing to colder EV spots. Exit Velocity is far more resilient than Launch Angle to location and pitch execution, and Launch Angle provides a clearer path to limiting the quality of contact — and ultimately runs — a pitcher allows. Outs don’t all need to be weakly hit, and with a smarter, vertically oriented approach, pitchers can get more outs at any Exit Velocity.
Data Analyst for Georgetown University Baseball. Donating his laptop and labrum to science.
Nothing to add, except to say this was a very good article.
Verlander knows this, which is why he gives up a lot of solo HRs and not much else.