Archive for Uncategorized

Old Player Premium

One of Dave Cameron’s articles a while back showed payroll allocations by age groups, and it shows that over the last five years or so more money is going to players in their prime years while less is being spent on players over 30.  That seems to be a logical thing for teams to do, but that trend can only continue for so long.  Eventually a point will be reached where older players are undervalued, and it might be possible that we are already there.

There are several things to keep in mind when comparing these age groups, and one of the biggest is the survivorship bias.  There is a natural attrition over time for players in general.  Let’s look at an example, and for all the following I will be using 2012 versus 2013 as a way to see what happens from year to year.  To look at survivorship, I looked at all position players in 2012 and then their contribution in 2013 to see how many disappeared the next year.  The players that were not in the 2013 year could be due to retirement, demotion, injury, etc.  I also took out a small group that played in both seasons, but were basically non-factors in 2013, for example Wilson Betemit played in both seasons, but in 2013 he only had 10 plate appearances.  The attrition rate for the age groups looks like this:

Age Group % of 2012 Players That Did Not Contribute in 2013
18-25 22.2%
26-30 25%
31-35 29.3%
36+ 38.9%

As you would expect, the attrition rate increases over time.  Players in their late teens and early 20s who make it to the majors are likely to be given opportunities in the near future, but as the age increases the probability of teams giving up on the player, major injury, or retirement goes up.  Players who make it from one group to the next have survived, and that is where the bias comes in.  By the time you get to the 36+ group a significant number of the players are really good because if they weren’t they would not have made it so far.  This ability to survive is also a reason why they should be getting a good chunk of the payroll.  As I will show you, it leads to steady play which teams should pay a premium for.

The next step is looking at performance risk among the groups.  To look at this I took each group’s performance in 2012 and compared it to the group’s performance in 2013, again only with survivors from year to year.  I looked at both wRC+ and WAR just to see if only the hitting component or overall performance behaved differently.

Further, to calculate a risk level I looked at the standard deviations of the differences (2013 minus 2012) for each player, but those are not directly comparable.  Standard deviation is higher for distributions with higher averages due to scaling issues.  For instance, the average 36+ player had a 95 wRC+ in 2012 versus, which is more than 10 wRC+ above the average 18 to 25 year old in the same year.  A 10% drop or increase  in production is therefore a larger absolute change for the 36+ player, so they naturally end up with a higher standard deviation.  To take care of this I calculated the standard deviation of the difference as a % of 2012 average production as the overall riskiness measure.

Age Group wRC+ Risk WAR Risk
18-25 56.5% 167.7%
26-30 48.3% 118.9%
31-35 46.4% 140.7%
36+ 35.2% 92.8%

Don’t compare the wRC+ to WAR figures as there are again scaling issues, but look at the age groups.  A one standard deviation change is most volatile for the youngest age group, so the younger players are the most uncertain or most risky.  That is what we would expect as we have all seen prospects flame out.  The middle two groups are similarly volatile with the 31 to 35 group have a slightly lower risk level in the hitting for this sample and slightly higher overall play according to the WAR risk.  More years might need to be compared to see how consistent those groups are relatively.  The 36+ players are significantly less risky than the other ages.  If they decline by 1 standard deviation it will mean a smaller reduction in performance, less volatile and less risky.

The only thing that really hurts the older players is the aging curve.  They are more likely to see a decline in performance.  From the youngest group to oldest the percent of players who were worse in 2013 than they were in 2012 by wRC+ was 52.3%, 54.5%, 64.4%, 63.6%, and for WAR 52.9%, 48.7%, 56.7%, and 81.8%.  So it is more likely that the older players will see performance worse than the previous year, but again a drop for them will likely be smaller due to lower volatility and it is on average from a higher level of performance to begin with.

Older players are like buying bonds for your investment portfolio, you have a pretty good idea of what there going to pay in the next period with occasional defaults.  Younger players are more like growth stocks, you aren’t sure when or if they are going to pay dividends but when they do you can make huge returns.  Investors pay a premium for bonds (accept a lower rate of return) due to their stability, and teams pay more for older players than maybe their production seems to warrant for the same reason.

 photo Survivor_zpsee696878.jpg

If you go back to the payroll allocation, part of the shift is in the number of players in each group.  The 31-35 year-olds no longer get the largest chunk of payroll in part because there are more 26 to 30 year-old players.  Baseball is getting younger overall, so a larger portion of the money going to younger players is inevitable.  The 18 to 25 group isn’t getting a large change in payroll allocation because they are generally under team control, but the teams are extending the players at that age with the money showing up as they get into the next couple age groups.  Like Chris Sale, who is making $3.5 million this year on the extension he signed (he’s 25), but when he is 26, 27, and 28 he will make 6, 9.15, and 12 million respectively.

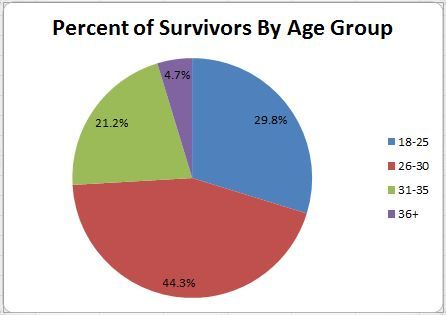
So the 36+ group, as you can see only 4.7% of the players, used to make about 20% of the total salaries paid, but now they make 15 or 16% (I don’t have Dave’s exact numbers).  Is that premium fair, four times more of the allocation than they make up of the overall player pool?  That is a tough question, and one I am working on.  If anyone can give me tips on how to dump lots of player game logs, that is probably what I am going to do next, but haven’t figured out how to do it without eating up my entire life.  Being more certain on this sort of thing, and having a relative risk measure for players could make contracts a lot easier to understand and predict.
The Tim Hudson Renaissance

As a general rule, giving multi-year contracts to 38-year-old pitchers coming off major ankle injuries is not a good idea. Yet Brian Sabean and the San Francisco Giants did just that, inking Tim Hudson to a two-year, $23M contract this off-season, and thus far have come out smelling like roses.

While Hudson has been a reliable and at times masterful starter during his long career, he is en route to his best overall year since 2003. The data further suggests that he is pitching better now than he has at any other point.

Examining Hudson’s career statistics suggest that his current pace, while not completely sustainable, is not a mirage by any means. The one stat that jumps off the page is his BB/9, which is a paltry 0.77. Of course that rate is bound to rise, but it’s certainly reasonable to expect it to stay in the low 2s. Hudson’s career low BB/9 is 2.10, and he hasn’t had a rate above 2.91 since 2006.

This season, Hudson’s strikeout rate—5.63—is actually lower than his career rate of 6.05. But he has never been a strikeout pitcher; his highest K/9 (8.71) came in 1999, his rookie season, when he also walked 4.09 batters per nine. He hasn’t had a strikeout rate above 6.51 since 2001.

What Hudson is now doing better than he has at any time in his career is limiting baserunners and stranding those that do manage to reach. His miniscule 0.88 WHIP is far off from his career total of 1.22, but it’s by no means a complete anomaly. As recently as 2011, Hudson has had a WHIP as low as 1.14; in 2003 he posted a career best of 1.08. While his current rate is likely to regress closer to the mean, he has proven capable of keeping batters from reaching base at an impressive rate.

When the WHIP does rise, it will likely be a result of an increased BB/9 and BABIP. Against Hudson in 2014, hitters have a BABIP of .243, a number well below his career mark of .278. But Hudson has posted similar rates in the past. In 2010, a year in which he pitched 228.2 innings, he held opposing hitters to a .249 BABIP. He hasn’t allowed a BABIP above .300 in a full season since 1999, though he threw just 136.1 innings that year.

Further, Hudson has stranded 80.8% of his baserunners thus far in 2014, his highest rate since 2010 (81.2). His groundball rate—60.7%—is a big reason why, as is his refusal to allow home runs. His HR/9 is a measly 0.51, a number he’s only bettered twice in his career (0.38 in 2004, 0.40 in 2007). While pitching in the friendly confines of AT&T park has helped, his FIP- of 83 is relatively close to his career mark of 88. In 2007, pitching half his games at Turner Field, Hudson posted a FIP- of 77.

So how is Hudson doing it? Besides the absurdly low walk rate, what has made him so effective this year?

Thus far, he is throwing his split/changeup and cutter with more frequency than his career rates from 1999-2013. His split/change—which he throws 14.60% of the time—has been especially effective this season, garnering a whiff/swing rate of 36.84. Before this season, the pitch amassed a whiff/swing rate of 27.94. His cutter, while getting slightly less whiffs this season (16.67%) than in years past (17.12% from 1999-2013), is forcing more ground balls (11.26 compared to 9.05).

Hudson’s curveball has also been a more valuable weapon this season than it has been in the past. While he’s throwing it at a rate that is almost identical to his career line, it gets him more whiffs (17.19%) than any of his other pitches besides the split/change (20.14). Before, batters whiffed at Hudson’s curve just 11.74% of the time.

When batters do put the ball in play, they aren’t hitting it very hard. Hudson’s LD% of 15.9 is the second lowest number he’s posted in his career, and a decent chunk below of his career mark of 18.0. In 2010, he had a career best 13.6%. This has resulted in Hudson throwing strikes at a higher rate than he ever has in his career. In 2014, 68.2% of the pitches he has thrown have been strikes, compared to a career rate of 63.7%.

As amazing as Hudson has been through 10 starts this season, the data suggests that, for the most part, his rates are legitimate and sustainable. Besides the infinitesimal walk rate, which translates to a low WHIP, and improved whiff rates on two of his pitches, Hudson isn’t doing anything that he hasn’t proven able to do in the past.


Performance With and Without Runners On, and Hitter Valuation

The increased prevalence of defensive shifts, as well as recent stories touting certain players as “shift-proof,” got me thinking: Is it a good thing to be shift-proof?  Is it inherently better to be a player against whom defensive shifting is less effective, or is there room for different players with different make-ups?  A downstream effect of defensive shifts is that, because teams shift less often (and shifts are less exaggerated) with runners on base, we start to see differences in a hitter’s performance with runners on versus with the bases empty.  We also notice other effects of players performing differently based on the number of baserunners.  In this post we’ll take a look at how we observe significant changes offensive performance (often fueled by changes in BABIP) of a few sample players when there are runners on base, versus with the bases empty.

Let’s take 3 players with very high similarity scores to each other: David Ortiz, Jason Giambi, and Carlos Delgado.  First, a look at their career stats:

Player G PA HR ISO BABIP AVG OBP SLG wOBA wRC+ WAR
Delgado 2035 8657 473 0.266 0.303 0.280 0.383 0.546 0.391 135 43.5
Ortiz 2020 8467 443 0.261 0.304 0.286 0.381 0.548 0.392 138 41.7
Giambi 2242 8864 440 0.241 0.294 0.277 0.400 0.518 0.395 140 49.3

Pretty comparable overall.  Giambi has accumulated more WAR, primarily through having a few more plate appearances, but also from having a better walk rate, which drives up his OBP, wOBA, and wRC+ significantly as well.

Now let’s look at their splits with runners on vs. bases empty:

Player

Split G PA HR HR/PA BB% SO% AVG OBP ISO OPS BABIP
Delgado Bases Empty 1932 4430 255 5.8% 11.7% 21.4% 0.275 0.374 0.273 0.922 0.303
Delgado Men On 1895 4227 218 5.2% 14.0% 18.9% 0.286 0.393 0.258 0.936 0.304
Ortiz Bases Empty 1862 4193 262 6.2% 11.2% 19.1% 0.271 0.356 0.282 0.908 0.281
Ortiz Men On 1851 4274 181 4.2% 15.2% 16.6% 0.302 0.406 0.240 0.948 0.327
Giambi Bases Empty 1999 4513 224 5.0% 13.0% 18.1% 0.256 0.367 0.228 0.851 0.271
Giambi Men On 2020 4351 216 5.0% 17.8% 17.1% 0.302 0.434 0.255 0.991 0.320

Here we start to see a lot of divergence.  With Ortiz and Giambi, we see a large increase in BABIP when there are runners on base (and corresponding increases to AVG and OPS).  With Delgado, there is only a trivial increase in BABIP, and a much smaller increase in OPS.

Here’s the difference in BABIP and OPS each player shows in the split between {bases empty} and {runners on}:

Player BABIP(runners on) – BABIP(empty) OPS(runners on) – OPS(empty)
Delgado 0.001 0.014
Ortiz 0.046 0.040
Giambi 0.049 0.140

Note that to some extent, all hitters tend to put up better numbers with runners on due to sampling bias – in an average “runners on” situation, a batter is more likely to be facing an inferior pitcher than in an average bases-empty situation.  Delgado’s splits are in line with the league-average splits for {bases empty} vs. {runners on}; in a given league season, the league-wide runners-on-vs.-bases-empty split in BABIP tends to range from 0.000-0.005; for OPS, the increase ranges from 0.010-0.030.  Ortiz and Giambi on the other hand show splits well outside this range that indicate there are other factors at play causing these effects.

Does this mean Ortiz and Giambi are tapping into some part of their psyche that allows them to suddenly transform into better players when runners are aboard?  Unlikely.  Ortiz and Giambi are pretty heavy pull hitters, especially looking at their ground ball spray charts, against whom defenses have often employed dramatic shifts to great effect.  However, with runners on base, these shifts tend to be less dramatic and less effective.  This is likely the primary reason for the large increases in BABIP with runners on (a 0.046 increase for Ortiz, 0.049 with Giambi).

Beyond this, although Ortiz and Giambi both show similar BABIP splits, they still differ greatly from each other in terms of their production with runners on.  Giambi’s OPS increases a whopping 140 points, while Ortiz’s only increases by 40 points.  This is largely due to Ortiz’s dramatic decrease in home run rate with runners on.  While Ortiz’s HR% drops by nearly 33%, Giambi has managed to continue hitting homers at the same rate when runners are aboard.  Do pitchers change their approach when facing Ortiz with runners on to “minimize the damage” and try to prevent him from hitting home runs?  Likewise Ortiz (based on the knowledge that pitchers will approach him differently) may change his approach at the plate as well.  The splits for other stats seem to bear this out, as Ortiz increases his walk rate and decreases his strikeout rate; this isn’t particularly revelatory, and in fact these trends are present for Giambi and even Delgado as well.

This has profound implications for player valuation.  Given 3 players who put up similar aggregate numbers over the course of the season, would you rather have the player who is going to produce at roughly the same level (similar AVG / BABIP / OPS) regardless of whether there are runners on base, or the player who is going to overproduce with runners on and underproduce with bases empty?  I’d go with the latter.  I’d prefer Ortiz to Delgado.  And then, since the decrease in Ortiz’s HR% with runners on is curious (and warrants further investigation), I’d prefer Giambi to Ortiz, Giambi being the even more extreme example of increased production with runners on.

As we start to see more and more defensive shifts (and if the assumption holds that shifts cannot be employed as effectively with runners on base), there will be more and more players who demonstrate these splits in performance.  WAR, for example, does not take this into account at all.  If a player is dramatically more productive (e.g. a 140-point increase in OPS!) with runners on, you would project his team to score more runs and win more games than if that player was replaced by a player who puts up equivalent full-season numbers (and hence, has the same WAR) but did not have the same splits.

It would be interesting to run some simulations (probably using Markov models) to more precisely quantify the impact a given player’s splits have on team run production.  Said impact would likely vary based on the team too (e.g. overall team OBP).  This could be similar to the analysis comparing how 2 players with similar wRC+ but different makeup (an OBP guy versus an ISO guy) can impact expected run totals for different teams in different ways.


Home-Run Environment And Win-Homer Correlation

Home runs are good, I think we can all agree on that, and in the presumably post-steroid environment they have been in decline.  Does that make the home run more or less important?  It is hard to say.  In some ways it means that they are more scarce, and you might expect that home run hitting teams might be at a larger advantage than previously.  On the other hand, teams that don’t hit a lot of balls out of the park will not be as far behind their peers if said peers are not taking the ball yard quite so frequently.  So which is it?

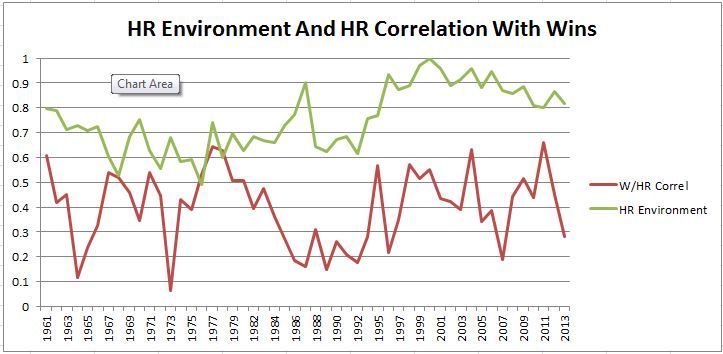
FanGraphs, of course, can give the answer.  I took every team in the expansion era (1961 and on) and then tracked two things year over year.  The first was how far each team was from the average home runs for a team, just home runs for a team minus the average of all MLB teams.  From there I calculated the correlation of those differences with the wins that the team accumulated in that year.  Then I tracked that correlation versus the overall home run environment.  To get them in the same scale I tracked home run environment as a percent of the max average home runs per team, so 2000 became 100%, or peak home run environment, as it was the highest average per team and every other year the average was some percent below that with the average in 2000 as the denominator.

I did omit 1994 and 1981 due to how much the seasons were shortened by strikes.  It made the overall graph harder to read.  The results look like this:


 photo HRenvironment_zps35a42fa7.jpg


And the answer is…it doesn’t matter!  Home runs are always positively correlated with wins, meaning it is never advantageous for a team to be below average when it comes to hitting home runs.  That correlation over time has a best fit line with a near zero slope.  Home runs are equally valuable with respect to winning in lower home run environments and the more recent high ones.  You can also see that the correlation is rather volatile ranging from barely positive to about .65 which is a fairly strong positive relationship.  Volatile, but never negative, so there are no years where a bunch of below average home run hitting teams took the league by storm.

The home run environment last year was back to 81.9% of the peak in 2000, and this year’s pace is a little slower than last with home runs in 2.38% of plate appearances rather than 2013’s 2.52%, which could reduce the total home runs hit by more than 8 per team for the year, though the heat of summer will probably close that gap up some.  It is likely though that the overall home run environment will be down to the levels we saw in 2011 and 2012, and maybe the drop off from 2000 has flattened out.

Anyway, I know everyone hates a non-result, there are published papers that have been published about the bias against them even, but this is still interesting to at least me.  You always want to hit home runs, we already knew that, but the value of the home runs should not be increased in times when they are scarce and they don’t become even more necessary during a homer boom.  This means that teams shouldn’t for instance overpay for a guy like Giancarlo Stanton right now because his power bat is more valuable in the current home run environment.  It means they should overpay so that their fans can enjoy the majestic blasts and feel content knowing they will be just as valuable as ever.


What Data Can Tell Us About Kansas City’s Home Run Struggles

After getting out homered 5-0 by the Angels this weekend, the Royals sit at an underwhelming 20 home runs in 49 games, good for 30th in the league and less than half of the league average of 45. Early in the season, it can be tough to distinguish if under-performance in a certain outcome is due to random fluctuation or an actual decline in talent. Luckily, we have a litany of data at our disposal that can help to answer this question.

Since Kansas City does not have a lineup stacked with power hitters, and playing in Kauffman Stadium makes hitting home runs more difficult than many other stadiums, it’s preferable to compare current production to a projection system instead of league average in order to get a sense of the scale of the Royals’ current power struggles. This already takes into account both the team’s lineup and ballpark factors, giving us a better comparison. In the preseason, Steamer projected that the Royals would hit 126 home runs in 2014. Applying that projection to the 49 games Kansas City has played, we get that the team was projected to have scored 38 home runs through this point in the season. Using the linear weights from the wOBA formula, we can calculate that had the Royals hit 38 home runs as Steamer projected, they would own a (league average) .317 wOBA and a wRC of 202. Instead, Kansas City has a team wOBA of .296 and a 173 wRC. In essence, these 18 home runs have cost the team 29 runs in total, or 2.9 WAR.

Things should change going forward, however. Steamer posts daily updated projections that change as more historical data becomes available (i.e. more games are played) . Taking into account the abysmal start by KC, Steamer has updated their projected year end total home runs from 126 to 102. We already know that 18 of that 24 home run difference is historical, so the change in home runs projected through the rest of the season amounts to only 6 for the remaining 113 games. After factoring in playing time adjustments, Steamer has now discredited Kansas City 9 home runs that were expected at the beginning of the season. Although this represents a non-trivial  drop in home run rates, it is significantly less severe than the pace the Royals have set so far this season.

This does make some sense. Steamer has years of major league performance data to shape player performance for each of Kansas City’s starters, and centuries of baseball data on which to base aging curves. It seems pretty unreasonable to significantly change a projection based on less than two months of data from the current season. This would be especially unreasonable given that home run rates do not stabilize for a given player until about 300 plate appearances. Eric Hosmer has the most PA on the team at 218, so it will probably be another month before we have an idea of whether or not the Royals’ power outage is anything more than random fluctuations.

Another reason we might expect that this trend will not sustain is that much of it appears to be luck-based. Over the past five years, the Royals have had a HR/FB of around 8%, and the lowest they posted over a full season in that time frame was 6.9% in 2010. So far this season, Kansas City has a HR/FB of 4.5%. In addition, the team has hit 7 more doubles than Steamer projected for the season so far, supporting the theory that the Royals have had more than their fair share of balls land just on the wrong side of the fence. This does not account for all 18 home runs that were projected to be hit and were not, however. Bad luck only explains so much, and the majority of KC’s offensive woes still should be credited to poor hitting.


Aaron Hicks: Why Won’t You Swing?

I’ll confess that I was once a firm believer in Aaron Hicks, and that I’d be remiss to cast him off after just 442 plate appearances in the major leagues. But the numbers don’t lie: he has been terrible in those plate appearances, sporting a .285 wOBA while amassing a -1.0 WAR.

Thus, I can understand why the switch-hitting center fielder would be a little reluctant to swing the bat. When he does, bad things usually happen. But a career Swing% of 38.7 is not going to work for a player of Hicks’ ilk. For perspective, Tim Lincecum’s career Swing% is 42.5. Yes, Tim Lincecum swings the bat more often than Aaron Hicks.

But what about drawing walks? Hicks certainly does that, and at an impressive rate (17.8% in 2014) to boot. Thanks to this increased number (which was just 7.7% in 2013), Hicks is getting on base at a respectable clip of .336, which aligns fairly well with his minor league career (.376).

While drawing walks is obviously a valuable trait, especially for someone who stole 32 bases as recently as 2012 in Double-A, Hicks is going to have to start swinging the bat at some point if he wants to have an extended major league career.

What’s most troubling about Hicks’ swing rates isn’t necessarily the low overall percentage; rather, it’s his penchant for taking pitches that are in the zone. This season, Hicks’ Z-Swing% is just 54.6, well short of the league average of 64.6. Further, 17 of Hicks’ 33 strikeouts this season have been looking. With a Z-Contact% of 88.6 and an overall Contact% of 80.2, this is unacceptable.

What happens when Hicks does actually swing the bat? Well, it’s admittedly not particularly pretty. He has a career LD% of 16.3, which puts him well below this year’s league average of 20.0. Almost half (48.1%) of his batted balls are hit on the ground, and the remaining 35.6% hit in the air.

But it’s fair to surmise that if Hicks would swing at more pitches in the zone, his LD% would see an increase, which would in turn increase his BABIP, which is just .247 in his career. Heck, even if he swung at more pitches out of the zone he’d probably see an increase in both of these numbers.

Looking at how pitchers are attacking Hicks gives further insight as to why his LD% is so low. This year, Hicks is seeing fastballs 54.4% percent of the time, compared to the league average of 57.6. Not a huge difference, but enough to suggest that pitchers feel more confident attacking him with offspeed and breaking pitches. Hicks is seeing 12.3% curveballs and 18.1% changeups, well above the league average of 9.8 and 10.4, respectively.

Ironically, Hicks’ LD per BIP against offspeed pitches is an astounding 28.57 this season, compared to rates of 19.57 against hard pitches and 11.11 against breaking pitches. Since 72.5% of the pitches that Hicks has seen this year have been either fastballs or changeups, it’s baffling that he remains so reluctant at the plate.

This data suggests that, while Hicks may never reach the expectations set when dubbed a top prospect, he can at least be a useful if not above average player for the Twins if he would just swing the bat more.


The Uncommon Careers of Adam Jones and Howie Kendrick

Brett Favre was fascinating to watch and not just because he won football games. Fans watched in awe of how he won football games. Favre was often referred to as a gunslinger with unorthodox mechanics and a propensity to make questionable decisions. Mike Holmgren claims to have “aged many years to that relationship” because Favre’s fundamentals and decision-making weren’t always enviable. And yet, Favre had an innate ability to overcome perceived weaknesses that many thought should have precluded him from success. Baseball players also succeed with apparent shortcomings and overcome the odds because they have some special talent in one area or another. Two current examples are Adam Jones and Howie Kendrick.

Adam Jones isn’t an elite baseball player in the same way that Favre was an elite football player, but Jones is very good. He also has a “flaw” that typically prevents hitters from being effective and yet, Jones has hit at an above-average level for his career. In this regard, Jones is a rare talent in the same vein as Favre and an interesting case.

Jones loves to swing the bat, as I’m sure all baseball players do. But Jones loves to swing the bat more than most. His career Swing% is close to 55% and has never fallen below 52% in any year of his career. He swings at a large percentage of pitches out of the strike zone as evidenced by his career 40.5% O-Swing%. This habit has led to a low career walk rate of 4.5%. The FanGraphs glossary would categorize this walk rate as “awful”, and it is. In fact, Jones’ walk rate is so low that we would expect him to be a below-average offensive player, which he is not.

In 2013, 101 players finished with a wRC+ above 100. Of those 101 players, 79 of them had a walk rate of over 7%. The top 16 players in terms of wRC+ had a double-digit walk rate. By contrast, only four players in all of baseball had walk rates above 10% and finished with a wRC+ of under 100. This data makes sense. Typically, players that know the strike zone and avoid swinging at poor pitches hit better than those who extend the zone frequently.  Of these 101 players with an above-average wRC+, only nine finished with a walk rate of under 5%. Those players are listed in the table below.

Player BB% wRC+
Starling Marte 4.4% 121
Shane Victorino 4.7% 119
Adam Jones 3.6% 118
Torii Hunter 4.0% 117
Howie Kendrick 4.5% 116
Jean Segura 4.0% 107
Daniel Murphy 4.6% 106
Salvador Perez 4.0% 105
Manny Machado 4.1% 101

Jones was the only player to have a walk rate under 4% and still have an above-average wRC+. He still finished in the top 50 in wRC+. His .285/.318/.493 slash line was solid, and he had an excellent .208 ISO.These are impressive numbers for someone who walked 25 times in 689 plate appearances.

You’ll notice Howie Kendrick on that list. Again, Kendrick isn’t a superstar, but he has been an above-average offensive player for his career. Kendrick also has a tendency to swing often, swinging about 54% of the time in 2013.  Even so, Kendrick slashed .297/.335/.439 while walking only 23 times in 513 plate appearances.

The 2013 season isn’t what makes these two players interesting. Many players have had solid seasons with poor walk rates. Jones and Kendrick are interesting because they have made a career out of walking very little and still producing quality offense. Both players debuted in 2006 and have around 4000 plate appearances. In the last 25 years, only six players with 3000 plate appearances or more have managed to maintain a walk rate of under 5% and a wRC+ of over 100.

Player BB% wRC+
Steve Garvey 4.6% 108
Howie Kendrick 4.6% 107
Adam Jones 4.5% 107
Tony Armas 4.7% 105
Ivan Rodriguez 5.0% 104
Brian Harper 3.9% 101

Pretty amazing. As their careers continue both players may have down years that take them off this list, but the fact that they have hacked their way to this level of production is astounding. They are truly rare players.

This rare talent also displays each player’s offensive weakness. Based on how other players have performed, Kendrick and Jones would likely be more productive offensive players if they swung at less pitches outside the strike zone and walked more. In the same interview linked above, Mike Holmgren mentions that Favre was able to tone down some of his poor tendencies in order to improve his performance. Favre was always going to look and play differently than other elite quarterbacks, but he started winning more consistently because those differences became less extreme.

Both Kendrick and Jones will likely need to improve their walk rates to remain good offensive players as they age. So far this season, Kendrick has shown signs of improvement. He has a 9.5% walk rate in 201 plate appearances.  Jones continues to swing as often as he can. He owns an almost unfathomable 2.5% walk rate. These numbers help explain why Kendrick has had two of the best months of his career while Jones has been mediocre.

Regardless of what happens going forward, Jones and Kendrick have had oddly productive offensive careers to this point. We can simultaneously appreciate their uniqueness while also seeing the blemishes related to that uniqueness. They aren’t elite offensive players, but they have remain productive in spite of a flaw that often keeps players from even reaching the major leagues.


Votto vs Casey vs Perez: Battle of Reds First Basemen

It’s funny how various factors affect how we interpret reality. Growing up, my family owned a boat. We would go fishing, water skiing, and tubing on the Ohio River and on several lakes. When I was a kid, I thought of this boat as a yacht. It was huge! I had all kinds of space to move around and acquire different angles of my brother being thrown from a tube. We had snacks and life jackets in hidden compartments. The seats were wide enough for me to lay down after an especially heinous wipeout. In my mind, we could have lived on that boat.

One time, I came home from college and my uncle and cousin wanted to take the boat out. I jumped at the chance to board our cruise liner and relive some of my youthful adventure. When it came time to board the boat, I realized something: our boat is tiny. The boat could only carry four people on the water legally. The seats were perfect for 12 year old me to lie down, but the extended version of myself could barely stretch my legs at all. I quickly came to a startling conclusion: my perception of our boat had not been entirely accurate. As a kid I didn’t have all the facts. I didn’t realize that only four people could ride in the boat at one time. My senses had deceived me. And for a long time, my memory had deceived me. The boat got bigger to me each year I was away from home. These are two different problems. Our senses may create a narrative that isn’t based in reality. We may also lose perspective on events, people, or experiences as time goes by.

We often do this. We remember things as grander than they actually were. Some of those things were great to begin with, but we embellish them to lofty heights. I recently read a comment from a Reds fan where he stated that besides 2010, Joey Votto has basically been Sean Casey as an offensive player. The commenter also stated that Tony Perez was a better hitter than Votto and insinuated that Votto’s 2010 season was a norm for Perez. Before I address these comments, I need to say a few things. All three players had great careers to varying degrees (Votto’s career still on going). All three players had and have strengths and weaknesses to their games. By examining the facts, I do not intend to belittle anyone of these great players. Let’s look at some numbers.

Player Games AVG OBP SLG HR ISO wRC+ WAR
Sean Casey 1405 .302 .367 .447 130 .145 109 16
Tony Perez 2777 .279 .341 .463 379 .184 121 58.9
Joey Votto 929 .312 .419 .537 163 .226 155 33.8

These numbers tell us several things. While all three players were great offensive players, Votto and Perez are and were a few steps above Casey. Casey was better than Perez at getting on base, but Perez power numbers dwarf Casey’s. Votto trumps Casey by a wide margin in both on-base ability and power. Casey’s career 109 wRC+ shows that he was a good offensive player; he just isn’t on the level of the other two.

The real comparison is between Votto and Perez.  In fairness to Perez, who played long enough to have some seasons that drove his career numbers down some, I decided to take his six-year peak and compare it to Votto’s six full seasons. In the table below, Perez’s numbers are from 1970-1975; Votto’s numbers are from 2008-2013.

Player Games AVG OBP SLG HR ISO wRC+ WAR
Tony Perez 898 .288 .359 .496 161 .208 138 30.2
Joey Votto 905 .312 .420 .537 159 .226 156 34.0

At their peak (which likely continues with Votto if he can stay healthy), Votto is a little bit better. wRC+ is a good indicator of how each player compared to league average in their era. To this point in his career, Votto has a 156 wRC+. Perez surpassed this number only twice in his 23 year career. Votto gets on base at a much better clip and according to SLG and ISO, he surprisingly hits for more power.

Perez was a phenomenal player. He also had a phenomenal team around him. To this point though, Votto has been a better hitter. Those who remember Perez as a great offensive force are correct, he just wasn’t as good in his peak as Votto has been. Perez had much better teammates than Votto and that might account for some selective memory. The Reds of the 1970s scored an abundance of runs. Perez was a big part of that. Votto’s Reds do not score nearly as much but not because of Votto’s efforts.

While our senses may cause us to draw faulty conclusions, the numbers tell a more complete and accurate story. Reds’ fans should celebrate what Votto has done in his career. We will likely look back at him as one of the greatest Reds’ hitters ever.


The Greatest Cardinal Catcher

Has Yadier Molina been great enough to get the title for the greatest Cardinal Catcher ever to play? Not quite. He is number 2, behind one of the most underrated catchers of all time. He still has to get past Ted Simmons, which he will probably do in a short time.

But until then, Ted Simmons it is.

Arguably a top 10 catcher to ever play the game, and probably a top 5 offensive catcher at that.  A player that had a wonderful 10 year stretch who unfortunately dropped off at the end of his career. A prized bat although only average at best defensively to below average, he posted great numbers in a 10 year peak that is hard to beat for any catcher. This is a player who should easily be in the Hall of Fame, but in his first and only ballot, he only received 3.7% of the votes.

From the years 1971 to 1980, he was almost unstoppable for a catcher, his lowest wRC+ in a season was 113, while his average for the stretch was 128. In comparison, Johnny Bench’s career wRC+ is 125. In a four year stretch, he averaged 138 wRC+. Fantastic numbers for a catcher. Only Mike Piazza and Joe Mauer have really been above that mark for any consistent time

His lowest WAR during this time was 3.8, and he had 5 seasons with 5.0 + WAR. Ernie Lombardi, who is in the Hall, only had 1 season with 5+ WAR. Mickey Cochrane, another Hall of Fame catcher, had 4 seasons with 5.0 + WAR. He is the 11th-best catcher by WAR, ahead of guys like Gabby Harnett.

From a traditional standpoint, he has raked up 2472 hits, second all-time for catchers. Also, 248 home runs, and while that is low for any other position, it puts him 10th for catchers. 1074 runs scored, good for 6th all time. 2nd in RBIs with 1389. He ranks up pretty well in the traditional stats was well as the more advanced metrics. And he did all of this before Mike Piazza, the greatest offensive catcher, ever sniffed at playing at the major league level, making his numbers historic as well.

It’s hard to imagine a guy so dominant at his position like this not in the Hall. Well, like I said earlier, he completely dropped off. In his last five seasons, his highest wRC+ was only 103, with his lowest at 60. Highest WAR was 1.0 while his lowest was -2.4. And he was always considered bad behind the plate.  During his great time as a catcher, 92% of the time he played was as a catcher. In his later years, all that time played caught up to him. Injuries plagued his career after he left St. Louis, only playing more than 150 games once in a season. While with St. Louis, he played over 150 games 9 times.

This is a player who just became overlooked. Not even sniffing at becoming a HOFer, even when he had the stats to make it. He is not even in the St. Louis Cardinals team Hall of Fame. Although a Veterans Committee hopefully will add Simmons to the Hall where he belongs, who knows when that will happen?

I don’t believe he is a Johnny Bench or Berra, but he was a fantastic catcher for the Cards, and deserves to be in the Hall. Especially when catchers like Ernie Lombardi are in it now.


The Dave Cameron Rules: A Manager’s Guide

A few days ago Dave Cameron published a post outlining some wild new rules for an alternative baseball. I missed it at the time, since I am on holiday in Sweden, but one Wi-Fi hotspot later, I was walking the streets of Stockholm thinking about the Dave Cameron Rules.

This post will make no sense to you unless you read the idea for “Daveball”, so go do that now. In it he asked a number of questions about what managers would do. This is my reply.

Overall Season Strategy

If every current game is divided by 3, the season schedule will be 486 games long. Playoff teams will lose 200 contests a year. The dramatically lower stakes make it easier to deliberately lose games.

Suppose you are facing Jose Fernandez. He will start Game 1 and probably continue to Game 2. Your own available pitchers are a mixed bag, so you save the best ones until the game(s) after Fernandez departs. As with bunts, every manager will need to calculate the risk and reward of trading unlikely wins for increased odds in another.

I also see a need for a new rule restricting roster moves to one time per day. (Not one move; one time.) This closes a new loophole wherein teams can call up a player for one three-inning game only. Not many teams have minor leaguers nearby to do this, but Texas, for example, could have an AA player report to Arlington instead of Frisco, call him up for Game 2, and have a spent pitcher hide in the clubhouse being “demoted”. This would give an unfair advantage to the few teams for whom this possibility exists.

Pitching

I see options for a manager under these rules. Broadly speaking, there are three. The first is only modest changes to status quo, such as bringing high quality relievers in at the sixth inning as well as the ninth.

The second option is to convert current mediocre starters into one-game pitchers. Consider the Washington Nationals, who have four pitchers capable of throwing two games in a day, and five pitchers, either borderline starters or long relievers, who could pitch one game a day well (Tanner Roark, Ross Detwiler, Taylor Jordan, Craig Stammen, Blake Treinen). Especially if you believe the weakness of a borderline starter is getting through a lineup the second time, they can suddenly become very valuable.

Here’s how to do it. (Listen up, Astros.) Convert a few of your guys and trade for some more. You could have around seven or even eight of these starters, plus relievers for the other innings and for getting out of trouble. The shorter starts will make these pitchers more effective. Today’s market for mediocre one-inning relief will transform into high demand for mediocre five-inning guys who can pitch effectively for three.

The third option is extreme: all short-outing guys, all the time. Every day, every pitcher only goes four or five outs. This would lengthen the games considerably, but on the other hand, fans could see a barrage of 98 mph high heat.

The major change to mound strategy will be an increased reliance on strikeouts and the near death of the intentional walk. I will explain this shortly.

Batting

Dave Cameron already pointed out several key changes to batting strategy: put all the best hitters at the top of the order, and pinch-hit early and often. (The pinch-hitter would actually function like a movable DH.) Sometimes it will be advantageous to work counts, but sometimes the short games will call for aggressiveness. Either way, the run-scoring environment will be very different. With a sudden surplus of decent pitching, and probably a slight increase in average velocity, batting will become harder.

Scoring, however, could be easier.

Baserunning

Under Dave Cameron’s rules, Billy Hamilton would become the most valuable player in baseball.

Here’s how it works. The logic of pinch-hitting for weak defenders, then returning them to the next game, applies to pinch-runners, too. If your slugger draws a walk, put in Billy Hamilton. Every time.

Let’s assume your team is fairly good, and has at least one baserunner in 95% of games. Billy Hamilton has scored about 62% of the time he reaches base, with an 83% steal success rate. To compare, Mike Trout has scored about 42% of the time he reaches. There are other factors at work, but I’m on holiday, so ignore them. Hamilton should be running for any player, if the situation demands it, but for sale of argument (and of me writing this on a phone) assume that in 95% of 486 games, Billy Hamilton increases your odds of scoring by 20%. That’s 92 additional runs per year, and not over replacement level, either. Suddenly an elite runner becomes the most valuable weapon in the game.

Three factors could limit the damage. First, managers could be dumb or unlucky and use runners at the wrong times. Second, defenses could invent some kind of wild new “no steals defense”. I have no idea what this would look like, but teams would be forced to try.

Finally, every team will acquire their own super-runner. (Currently a running-only player is a waste of bench space, but the opportunity to use him or her three times per game without penalty would change the math.) Oakland would call up Billy Burns. Some teams would sign actual Olympic sprinters, train them in fundamentals like pitch recognition and sliding safely, and set them loose. (This is how we would acquire the first female player.) If Usain Bolt breaks for second base, a catcher will throw to third to limit the damage.

More than anything else, the runners will change baseball. Intentional walks will never be used with one or zero men on base. Unintentional walks will force wild pitchers out of the league. Strikeouts will be a priority as the third-inning hitting strategy is simply to get on first base.

Fielding

I couldn’t think of much here, except for almost universal use of the no-doubles defense (especially once the enemy has used his runner). Probably shifts would be more common.

Conclusion

Dave Cameron’s rules would accelerate some trends we already see in baseball: more strikeouts, more speed, more reliance on defense. But it would also inspire madness, like nine-man starting rotations comprised of suddenly valuable borderline starting pitchers, and female sprinters charging toward home plate on squeeze plays. The game would be unrecognizable and loony, but also a lot of fun. And Billy Hamilton would punch a ticket to the Hall of Fame.