Archive for Strategy

2017 HBL Dynasty League Prospect Draft – So Deep You’ll Love It

The HBL is what many around here would call a “home league”, though I generally take that comment to mean the level of skill is lower than that of an expert level league, which in this case would do a disservice to describe the talented owners we have. Over the course of 18+ years this group has been together, we’ve honed something I now refer to as “Hampshire-style dynasty”. The key components to this style of fantasy baseball are: 25 man roster (1C, 3OF, DH, 9P, 7 Bench), $217 salary cap (25-man only), 10 man minor league roster and an annual “prospect draft” each year during the All-Star break. While many of you fantasy players are getting twitchy, accidentally clicking on your live scoring 6-10 times a day for the four day break, we’re enjoying a glorious, leisurely-paced live draft for our future man-crushes.

Hampshire-style dynasty actually shares a few similarities with the Ottoneu-style keeper leagues, but the minor league portion of the roster is set to mimic real-life baseball. Minor league player salaries, upon promotion, are set based on the round they are selected. $4 for a first-rounder, $3 for a second, $2 for a third and $1 for a fourth. This ensures that you’ll be able to keep most players a minimum of 3 years before their salaries become a decision point, and for super-star players it’s common to see them kept for 6 to 9 years before being released back into the auction. The feel is something very similar to the arbitration salary escalation process.

I share the background because I feel this feature is a fantastic one for those of you playing or creating dynasty leagues. The reason I wrote the article, though, is because I’m hoping to share the names of some further-off prospects to drive discussion. Because we roster 120 minor league players, we’re pretty well clear of the Baseball America Top 100 list, but both The Dynasty Guru’s Top 300 Prospects and the FG Consensus prospect rankings list are a useful base from which to begin monitoring prospect names. Both midseason prospect updates from BA and BP come out the week before our draft, and the new MLB draft class along with the J2 signings make for a really interesting first two weeks of July for us prospect hounds.

2017 HBL Prospect Draft
ROUND 1
# Owner Player Team Pos Highest Level
1 O’Connor Vladimir Guerrero Jr. Blue Jays 3B A+
2 Helmers Francisco Mejia Indians C AA
3 Vonderharr Mitch Keller Pirates SP A+
4 Duginske/Pelto Luis Robert White Sox OF R
5 Beyler Bo Bichette Blue Jays 2B R
6 Woody Walker Buehler Dodgers SP AA
7 Jabs Michael Kopech White Sox SP AA
8 Kummer Triston McKenzie Indians SP A+
9 Jabs Forrest Whitley Astros SP A+
10 Rogers Scott Kingery Phillies 2B AAA
11 Kummer Brendan McKay Rays 1B/SP 2017 Draftee
12 Biesanz Hunter Greene Reds SP/SS 2017 Draftee
SANDWICH ROUND (COMPETITVE FINISH PICKS)
# Owner Player Team Pos Highest Level
13 Kummer Rhys Hoskins Phillies 1B AAA
14 Rogers Mike Soroka Braves SP AA
15 Jabs Kolby Allard Braves SP AA

The first round of the draft normally consists of a few staple “types”. The guys we missed on last year that were fast movers (Guerrero Jr., Kingery, Bichette, Mejia), the new high-profile international signees (Robert), and whichever pitchers we missed last year that progressed quickly and now have industry hype around them (Kopech, Keller, Buehler, McKenzie, et al). Depending on the year, the current MLB draft class may get some love in the first round as well (McKay, Greene)

Though I didn’t myself have a first round selection, I had Vlad Jr. as the number one player available. There are some players like Hoskins or Mejia who are closer to having a fantasy impact, but we’re generally drafting for ceiling here. Among the top arms available Mitch Keller has been my favorite for going on a year now. Both Guerrero Jr and Keller were on my list as possible fourth round selections last year, but I didn’t pull the trigger (Delvin Perez, SS, STL was my sole 4th round selection in 2016 because I’m a sucker for shortstop prospects).

The Competitive Finish Round, which are picks awarded to those teams who finish in 4th through 6th place (just outside “the money”) kicked off what forever shall be known as the “holy cow the Braves have a lot of starting pitching prospects” draft.

2017 HBL Prospect Draft
ROUND 2
# Owner Player Team Pos Highest Level
16 Jabs MacKenzie Gore Padres SP 2017 Draftee
17 Helmers Willie Calhoun Dodgers 2B AAA
18 Duginske/Pelto Chance Sisco Orioles C AAA
19 Helmers Kyle Wright Braves SP 2017 Draftee
20 Beyler Sixto Sanchez Phillies SP A
21 Woody Franklin Perez Astros SP A+
22 Melichar Derek Fisher Astros OF MLB
23 Melichar Ryan Mountcastle Orioles SS A+
24 Melichar Juan Soto Nationals OF A
25 Rogers Dominic Smith Mets 1B AAA
26 Todosichuk Royce Lewis Twins SS R
27 Beyler Carson Kelly Cardinals C AAA

Round 2 featured a couple players I had pegged as first round talents on my board with Calhoun and Fisher. It didn’t hurt that their proximity to impact is < 1 year. I’m also biased against selecting many pitchers, especially prior to AA. The probability of them washing out, having arm/shoulder injuries, or taking the [insert pitcher name who flew through the minors, was called up, didn’t fare well for three years, but you owned him in parts of all three seasons only to see a league-mate hit the lotto after you dropped him for the fifth time name here] and having to live with that shame/guilt.

Juan Soto was an interesting case. I’d honestly not heard his name before the BP midseason list came out and they ranked him #12. Once I started hearing things like “Victor Robles” I took notice and decided he was likely worth the gamble. My other picks in this round included Derek Fisher who I concluded was a safer high-ish ceiling guy with both speed and power (and currently nowhere to play in Houston, nor a decent lineup slot if he did), and Ryan Mountcastle who by all scout accounts won’t actually stick at SS but I’m hoping for a Brad Miller type. Mountcastle can’t take a walk, but we use AVG and Total Bases, so you can guess how many [poops] I could give so long as he can make it to the Show. Maybe he can learn from Adam Jones . . . or really any Orioles player, they really don’t seem to value OBP in that organization, do they?

I was happy to see so many pitchers and catchers go, because my draft strategy basically has me ignoring them.

2017 HBL Prospect Draft
ROUND 3
# Owner Player Team Pos Highest Level
28 Melichar Jhailyn Ortiz Phillies OF A-
29 Helmers Austin Beck Athletics OF R
30 Vonderharr Luis Ortiz Brewers SP AA
31 Kummer Estevan Florial Yankees OF A
32 Beyler Riley Pint Rockies SP A
33 Woody Jack Flaherty Cardinals SP AAA
34 Vonderharr Shane Baz Pirates SP R
35 Duginske/Pelto Leody Taveras Rangers OF A
36 Melichar Taylor Trammel Reds OF A
37 Rogers Dylan Cease White Sox SP A
38 Helmers Luiz Gohara Braves SP AA
39 Todosichuk Fernando Tatis Jr. Padres SS A

I kicked off Round 3 with a player I decided I couldn’t wait on, even though I really wanted to get him in the fourth round so that his starting salary could be $1 someday down the road.

I love Jhailyn Ortiz. A lot. Probably too much. You may or may not remember him from the Vladimir Guerrero J2 class. Well I did, and I just started seeing some hype articles on the kid this week. I got scared and jumped to grab him. This is the type of player, the “fast movers”, that we generally miss in our draft (myself included) and end up being #1 of 1 the following year. His power potential is unmatched and I’m glad to own his ceiling.

My leaguemates all seemed generally bummed when Florial went off the board. I hadn’t read much on him but when there’s that much chatter when a single player goes off the board that’s generally a good sign for the owner who took him.

The other player of note in this round is Austin Beck, who was dubbed “future hall-of-famer” by his team. This is the type of crazy prognostication smack-talk that becomes lore.

I chose another player in this round, Taylor Trammel from the Reds. He’s your typical toolsy prep kid with speed and power. We all draft these guys every year. Sometimes they’re Monte Harrison and sometimes they’re Andrew McCutchen.

2017 HBL Prospect Draft
ROUND 4
# Owner Player Team Pos Highest Level
40 Rogers Jesus Sanchez Rays OF A
41 Helmers Thomas Szapucki Mets SP A
Vonderharr **PASS**
42 Kummer JB Bukauskas Astros SP 2017 Draftee
43 Biesanz Colton Welker Rockies 3B A
44 Woody Kyle Lewis Mariners OF A+
45 Melichar James Kaprielian Yankees SP A+
Duginske/Pelto **PASS*
46 Melichar Yordan Alvarez Astros 1B A+
47 Melichar Cole Tucker Pirates SS A+
48 Helmers Jeren Kendall Dodgers OF 2017 Draftee
49 Biesanz Michael Chavis Red Sox 3B AA

The fourth round is where things really get fun. We’re really past all the highest ranked talent on the industry lists and now you’re just using your intuition to try and snag the guys who will become the 2018 1st round picks — a year early. I was lucky enough to have traded for a few extra fourth round picks and had 3 picks in a row near the back of the round.

One player, I was sitting on all draft was Yankees 55FV SP James Kaprielian. He’s had Tommy John surgery this year, but with any luck I was able to snag a 1st round talent at a 4th round price. Having elite $1 pitchers to call up and hitch your wagons to for 4-9 years is every owner’s dream in this league. I’m just hoping he can be another TJ success story. I believe that if he doesn’t get hurt he’s right up there with Keller and Buehler in the fist round this year.

My other two picks aren’t the most conventional draft choices, but sometimes you just have to go with your gut. Truth be told, Colton Welker was snagged infront of me, so I had to scramble for my last guy, who ended up being Cole Tucker. Tucker is ranked as the #5 Pirates prospect on MLB Pipeline and #7 here at FG by Longenhagen. I skipped rival Pirates SS prospect, Kevin Newman (#4 MLB, #5 FG) because I love the steals that Tucker has piled up in his time in the minors. I can see he doesn’t have 60 or 70 grade speed, but when you’re gambling on ceiling you have to throw up a few hail mary shots. I was able to watch some video on Tucker, and the scouting reports told me the same thing my eyes told me, which is that he’s awfully “slappy” for a 6’3 180lb former first round pick. Also, in the video I found, his hands are all over the place from the left side of the plate (he’s a switch hitter). I’m scared and excited all at once.

The last pick I made was Yordan Alvarez. I was so caught up hoping no one noticed him or was writing about him to notice that he made the Future’s Game roster. Much like Jhailyn Ortiz, Alvarez is a former J2 signee as well and also has big time power. He was just recently promoted to A+ after destroying baseballs in A to the tune of a .297 ISO. I like the sound of that.

I’ve had a great time writing up our league’s draft and I hope it’s given some of you dynasty league owners some more names to talk about. I’d love to see comments about who you think got great value in this draft, as well as anyone that wasn’t taken that you might have drafted.

I can tell you that the top players left from the BA Midseason list after we were done drafting were: Luis Urias, Anthony Alford, and pitchers Brandon Woodruff, Alex Faedo, Ian Anderson, Anthony Banda, Erick Fedde, Justus Sheffield, Tyler Mahle, Matt Manning, Beau Burrows, and Nick Niedert. I considered some of these arms with my fourth round picks, but as I said, I prefer to see most of them pitch at AA and spend a higher pick on them if I really like them.


There Is Hope for Kevin Siegrist

To say that Kevin Siegrist has really struggled in 2017 would be an understatement. After allowing 15 earned runs in 31 appearances through June 22, he was placed on the DL with a cervical spine sprain. With an ERA near 5, Cardinals fans have been left wondering what happened to the player who led the league in appearances (81) and finished third in holds (28) in 2015.

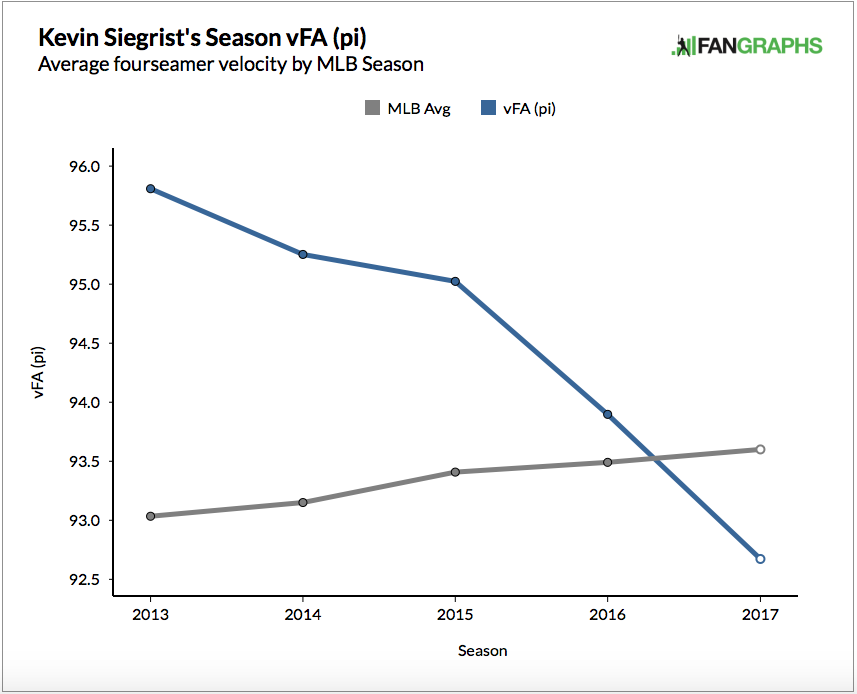
At first glance, Siegrist has an obvious issue — a very clear and very serious velocity problem. Take a look at this graph.

HdTlDcq.0.png

The velocity of his fastball has decreased every year since 2013. It hovered around 95.8 mph at one point, but more recently it’s dropped well below 93 mph. That’s a significant decrease, as the steep slope indicates. And for the first time, Siegrist, who is a reliever, has a fastball velocity well below a league average that includes starting pitchers.

If you have ever looked at aging curves, for hitters or pitchers, then you know that skills decline with age. Certainly, pitching velocity is no exception to this rule. Still, Siegrist is an extreme case.

cdohu0v.0.png

Velocity very clearly declines with age and Siegrist has fallen right in line with this trend. For the first two or three years of his career, his changes in velocity pretty closely matched the aging curve. However, for the last two years, there has been a marked decrease.

In case you haven’t gotten the point, here’s one more graphic that shows Siegrist’s velocity problem.

dFMO5Fj.0.png

This slope looks more like something I would ski down than data you want to see from a pitcher’s velocity. Clearly, Siegrist had an excellent stretch in 2015 and he produced the numbers to back that up. Other than that, we see a pretty consistent decline.

So, is that it for Kevin Siegrist? A slow decline into oblivion? I don’t think so. I actually expect him to far surpass expectations in the second half of the year.

What if I told you, Siegrist has actually improved this year? He’s not telegraphing his pitches. He has improved his tunneling. (For extra reading, here are primers on tunneling from The Hardball TimesBaseball Prospectus, and FanGraphs.)

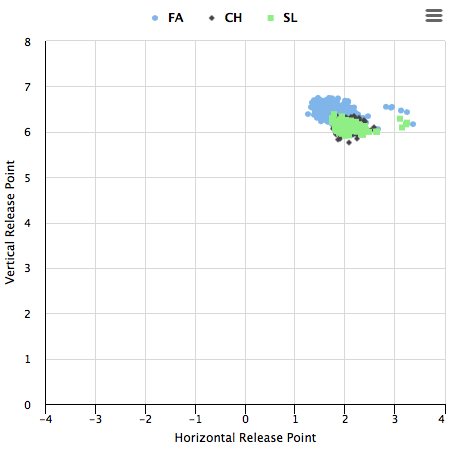
Essentially, tunneling is the ability of a pitcher to repeat his delivery with similar, if not identical, release points. If a pitcher is able to do this, a batter has less time to recognize the pitch and a lower chance of getting a hit. If a pitcher’s release points are completely different, say for his fastball and changeup, a hitter can more easily distinguish between the two and put a better swing on the ball.

KacwLaW.0.png

These are Siegrist’s release points from 2015 (his most successful year).

XKPHtpM.0.png

And here are the release points from the first half of 2017.

Let’s keep in mind we’re talking about inches here, not feet. Still, the differences between these two years are significant. The release points from 2015 are more spread out than the data from 2017. Siegrist has improved his ability to replicate pitch deliveries. Unfortunately, due to his decreased velocity, this hasn’t resulted in any type of noticeable success.

In 2015, the changeup and the slider release points overlapped nicely, but the fastball release points stick out like a sore thumb. In 2017, with the addition of a cutter, there is much more overlap among the pitches. If he can keep this up, it should translate to long-term success.

Moving away from release points, pitch virtualization data confirms the same hypothesis: that Kevin Siegrist has improved his ability to replicate his delivery.

ntGolVd.0.png

This is the data from 2015. To the average viewer, and even probably to you and me, this doesn’t look too bad. At the 55-foot mark, the pitches have pretty similar locations. Even at the 30-foot mark, it’s probably pretty difficult to distinguish between five of his six pitches.

If we compare it to the 2017 data, we see a considerable difference.

Hc7PwQP.0.png

It’s pretty clear, right? At 55 feet, the release points aren’t “pretty similar,” to use my own wording, they’re practically identical. And the trajectories remain extremely close to one another until about the 20-foot mark, when they break. 20 feet at 93 miles per hour (an all-time low velocity for Siegrist) gives the batter about a tenth of a second to decide what to do.

There is no denying that Kevin Siegrist has a velocity problem that he would do well to fix. And if the first half of 2017 is any indication, it needs to happen fast. It is unfortunate that he has not been able to reap the benefits of an improved delivery. The consistency in release points that Siegrist has shown during an abysmal 2017 is encouraging and should provide a source of hope going into the second half of the season.


Stop Throwing Fastballs to the Astros

Everything’s Gonna Be Aoki

I went to SunTrust Field on July 4th to see the Astros versus the Braves, and little did I know the fireworks during the game were going to be far more explosive than the ones afterward. I got to see the most productive offense in baseball put up 16 runs against the Braves (and their usually stellar rookie pitcher Sean Newcomb). It’s undeniable how remarkably talented the Astros offense is. So, I set out to answer a seemingly-simple question: “why?”

I got the idea for this article while I curiously flipped through their team statistics to try to see what clicked. My first reaction when looking at batted ball data, hard hit rate, K%, BB%, etc. was “wow…they look entirely human.” It was strange how normal the advanced metrics show the Astros to be. They walk a decent amount and don’t strike out a lot, but they’re tied with the Pirates and behind the Red Sox in BB/K, so while that helps, it can’t be the only reason they’re this good. They lead the league in ISO, which tells us that their slugging percentage is pretty high, but doesn’t really explain why.

The table that jumped out at me was this:

In my article about Brad Peacock, I talked a little bit about the utility (and disutility) of using pitch-type linear weights to predict future pitching success (in short, the variation from year-to-year for pitchers is pretty high). Well, this is certainly more than noise. The Astros hit the absolute crap out of fastballs. For me, the only question is whether this is simply a result or if it can be used as a predictor.

I think there are two important distinctions to draw between the way we’re using pitch-type linear weights here and what we did earlier.

First, these are team-wide as opposed to pitcher-specific. The problem with these is that they capture a lot of context. That’s really the whole point of the stat. If you hit a fastball for a single and score the two runners from scoring position, your wFB is going to be much higher than if you begin the inning with one. However, because we’re looking at team-wide statistics, we should be getting measurements from enough distinct contexts that the noise begins to fade slightly. This is much different than examining Peacock’s statistics after four starts (two of which happened against the same high-strikeout team).

Second, we’re looking at change in offensive run expectancy, not defensive. This could be a metric like BABIP, where pitching is highly dependent on external factors, while it is a bit more focused on skill for hitters. This raises the question “is there such a thing as a fastball hitter?” The linked article was the closest I could find to directly answering the question (I’ve looked all over the place and can’t figure out who the author is, but as far as I can tell he’s decently connected with the baseball analytics community). Either way, if we take this guy at his word, his model does suggest that some hitters do perform significantly (statistically) better against fastballs.

This doesn’t completely solve all the problems with just looking at wFB (like the fact that the Astros are a naturally good-hitting team and will have many at-bats with runners in scoring position where the expected run value will be high), so we will have to devise a way to control for the context and just look at performance on a pitch-by-pitch basis.

Instead of reinventing the wheel with trying to prove the existence of fastball hitters, this article seeks to prove a strong relationship between fastball-hitters and overall success. If so, this could have drastic implications for how to pitch to teams like the Astros, or even which players to target when trying to replicate the “worst-to-first” transition as the Astros have.

Do “Fastball-Hitting” Teams Succeed More?

Here’s the relationship between fastball linear weights for 2017 teams and their weighted runs above average:

This should be an obvious relationship. For starters, they’re both weighted measures of how many runs a team is expected to produce. So, if you produce more runs on fastballs relative to other teams and hold everything else constant, you by definition are going to increase your total runs relative to other teams. However, the R-squared value does raise some eyebrows. Basically, this means that about 80% of the variation in “weighted runs above average” can be explained only by looking at the wFB statistic of each team. In a sport with as much variation as baseball, that’s actually fairly decent. But, we can do better.

I decided to look at the fastball linear weight for each team and divide that by the total wRAA. This should give us a decent idea of how many of those runs created came on certain pitches. This is kind of a weird comparison, because wRAA calculates the expected runs based off of weighted on-base average (wOBA), while pitch-type linear weights scoop up all of the situational context as explained above. However, it can still give us a general idea of how many expected runs a team generates off of a certain pitch relative to league average.

Here’s the relationship between fastball run percent versus weighted runs above average (please excuse the shaky highlighting):

This surprised me quite a bit. What this says is that about 76% of the variation in wRAA (in 2017) can be explained solely by looking at the wFB/wRAA. I should also mention that even though the dataframe is called “astros” it includes the stats for every major-league team in 2017. In short, the percentage of runs you generate off of fastballs correlates pretty strongly with the total amount of runs you score. Weird stuff.

Closing Thoughts

There are, of course, many problems with latching on to this one observation as the basis for total change in team management. For one thing, some teams may be good at hitting fastballs just because they see them more than every other pitch. A complete 180 in the way teams pitch could bring with it a heavy response by the league’s hitters that mitigates some of the advantage, making this a self-denying prophecy.

That being said, I have a hunch that the Astros are a good fastball-hitting team by design. I think the fact that roughly 60% of pitches seen by hitters are fastballs is an inefficiency that the Astros are effectively exploiting. I also believe this is part of the logic in the recent curveball revolution. Theo Epstein’s short and sweet reaction to the pitch usage of the 2016 World Series between two of the most data-driven organizations in baseball was simply “More breaking balls!”

It’s worth noting, however, the Astros haven’t always been this dominant with respect to hitting fastballs.

The expected run change this year is almost three times as much as last year’s value. If this is by design, why didn’t it happen last year? I’m not entirely certain, but the ridiculousness of the 95.6 value they put up in the first half this year should be a major tip. That doesn’t just happen by accident. If they have a wFB of 0 for the entire second half of the 2017 season, they would still be good for the 26th best fastball-hitting season of all time (…since 2002). That is absolutely absurd. If you’re a fan of the game, please recognize just how good the Astros are. If you’re a pitcher, you better hope they don’t make an example out of you. And for your own good: don’t throw them too many fastballs.


Does Speed Kill?

Speed kills. At least, that’s what people say.

Speed is certainly a good tool to have. All else equal, any manager would pick the faster guy. Of course, speed is a huge asset in the field, especially for outfielders. Good speed increases range, providing a sort of buffer zone for players who don’t get a good jump on the ball or who don’t read the ball well off the bat. No one in their right mind, when given the choice, would pick the player with less range (again, all else equal). And so we can all agree that speed very clearly increases a player’s value in the field.

Whether or not speed increases a player’s value at the plate is a different story. The faster guy may leg out an infield hit every now and then or stretch a single into a double or a double into a triple, but this won’t significantly increase a player’s value outside of a small uptick in average.

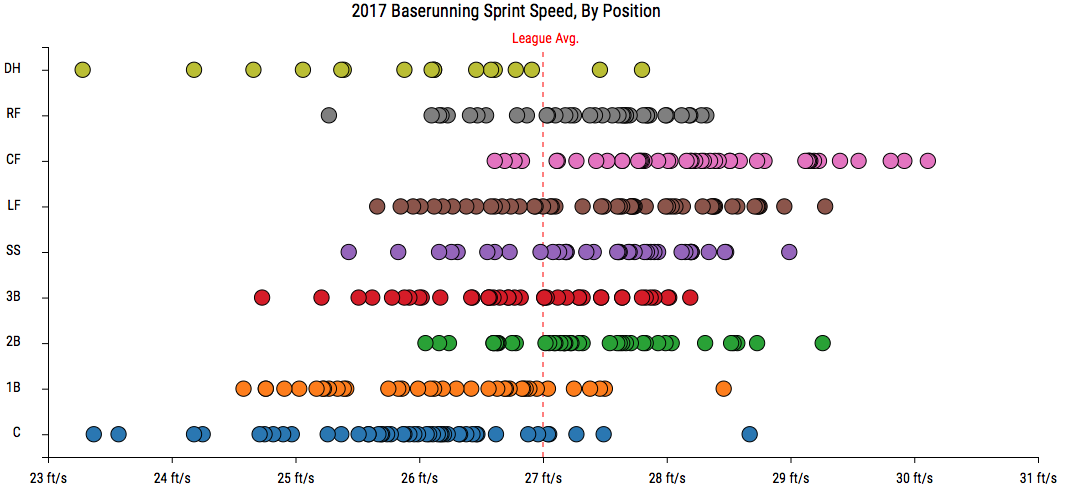
Luckily, Baseball Savant’s sprint-speed leaderboard gives us some interesting data to examine (you can find the interactive tool here).

wSkcbNu.0.png

Here, we can see that the league average sprint speed is 27 ft/s. Catchers, first basemen, and designated hitters are typically below league average. And it comes as no surprise that outfielders, especially center fielders, are typically above league average.

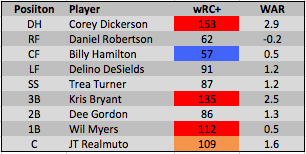
If we look at the fastest player at each position for 2017, we can come to a better understanding of the value of speed.

scWVCyU.0.png

Notably, of the nine players on this list, only four of them have a wRC+ above 100 — league average. Is this significant? Probably not as a stand-alone statistic. But it is safe to say that speed does not directly correlate to value. And it certainly doesn’t correlate to value at the plate. Even when examining the WAR column, you won’t be blown away. Dickerson and Bryant are having great years, but for the most part these players represent a pretty average group.

As mentioned previously, only four of these players are above average in terms of creating runs (highlighted in red and orange). The players with wRC+ values in red have not had success because of their speed. They all have ISOs that are at least 50 points above league average. Basically, their success can be attributed to power, not speed.

However, JT Realmuto’s ISO is essentially league average. Did speed boost his value that much? (NOTE: speed is not taken into account when calculating wRC+; still, the value of each outcome, which is considered in the calculation, can be affected by speed) Realmuto’s speed puts additional pressure on opposing defenses, especially relative to other catchers, but I would be very hesitant to say that speed alone created a difference of 9 wRC+ between him and the average player.

Billy Hamilton is the fastest player in the league. And while most would call him a plus defender, very few would call him a good all-around player. His wRC+ value of 57 is seventh-worst out of all qualified players (highlighted in blue). Although he leads the league in stolen bases, even that wasn’t enough to raise his WAR above a dismal 0.5. We can safely say that speed does not correlate to success.

What about specific teams? Do teams compiled of speedsters at every position win more games?

w9geMYB.0.png

Here is the same image as above with only Marlins players highlighted. Miami has a player with above-average speed at every single position, save for Justin Bour at 1B who has been a top-20 player in the MLB based on offensive production this year. Without question, the Marlins have a lot of speed, but still, they are six games under .500 and 10.5 games out of the wild-card race in the National League.

HXJEqCo.0.png

Here is the same image with San Diego players. The Padres are a speedy team. They have not one, but two players above league average at three different positions. Even their catcher, Austin Hedges, is only slightly below league average while still significantly faster than the average catcher. Despite having one of the fastest teams in the MLB, the Padres are 14 games below .500 and 19 games out of first place in the NL West.

Speed isn’t a stand-alone tool. It is a great complement to someone who makes contact at high rates (see: Ichiro) and it can put pressure on a defense, forcing fielders to rush to make a play. Furthermore, it is a crucial tool in the field, increasing range for all players, most significantly for outfielders. However, speed in and of itself is by no means an indicator of overall value. In baseball, speed doesn’t kill.


The Cardinals Might Have Lost Three Wins on the Bases

The Cardinals’ have struggled to run the bases for the better part of two years now. So far, the only tangible effect has been third-base coach Chris Maloney’s “reassignment” to the minor leagues. Nevertheless, Cardinals manager Mike Matheny has continued to preach aggressiveness on the basepaths.

I intend to show the effect the Cardinals’ outs on the bases have had on their ability to score runs. A run-expectancy matrix can help. A run-expectancy matrix shows you the number of runs, on average, a team can expect to score from a given on-base state to the end of the inning. For example, with the bases loaded and no outs, a team can expect to score about 2.2 runs by the end of the inning. On the other hand, with nobody on and two outs, the offensive team’s run expectancy is about 0.098 runs. Here’s the basic run-expectancy matrix:


To estimate the number of runs the Cardinals have left on the bases, I charted every out on the bases thus far in 2017 (53). In each of those 53 instances, I charted the actual outcome and the outcome had the mistake not been made. Then, I subtracted the run-expectancy of the actual outcome from the mistake-free one.

In total, the Cardinal’s actual run expectancy is about 22 runs lower than it would be without baserunning mistakes. If you add those 22 runs to the Pythagorean record formula, the Cardinals should be 38-37, or 1.5 games behind the Brewers.

Not all outs on the bases are created equal, though.

All those formulas are useful, but they make a few key assumptions. First, they assume average speed on the bases. Second, they assume an average hitter at the plate. The creators of run-expectancy arrived at the above numbers by studying the results of MLB games over a six-year period. That’s thousands of innings and at-bats for the numbers to even out. But, when you look at just 53 instances, it’s possible for there to be some small-sample-size error. So let’s look at a couple of specific plays from this season.

April 18

With the Cardinals leading the Pirates 1-0 in the 5th, Greg Garcia came to bat with Jose Martinez on first. With nobody out the run expectancy was 0.8.

Garcia lined a double into center. Martinez rounded third and scored easily, but Garcia was thrown out trying for third. Now, it’s possible a throw from the outfield was cut off by the first baseman and redirected to third to nab Garcia. However, quick review of the video shows that not to be the case.

With one run in, the Cardinals could have expected about 1.1 more runs had Garcia stayed put at second. Instead, with nobody on and one out, their run expectancy dropped to .59. There’s about 1/2 of one of those 22 runs.

Luckily the Cardinals hung on for a one-run win.

May 13

Leading the Cubs 3-1, Magneuris Sierra was on first with one out and the pitcher, Carlos Martinez, at bat. Sierra tried to steal second (Lester was on the mound) but was thrown out for the second out.

Run expectancy says the Cardinals went from scoring about .5 a run on average to .2. But the pitcher was hitting. Assuming Carlos would have bunted him over, the run expectancy would have risen to .319. Lower than it was, but higher than if Carlos would have, say, struck out.

This is an example of a time where run-expectancy breaks down. In the National League, pitchers hitting has a tendency to ruin even the best laid plans. And because most formulas make the basic assumptions mentioned above, it’s hard to criticize Sierra’s mistake.

May 18

I bet you’re surprised I got this far without mentioning Matt Carpenter.

Well, on May 18 Carpenter committed one of the stupidest, irresponsible, boneheaded, bordering-gross-criminal-negligence baserunning mistakes I’ve ever seen.

Carlos had pitched an utter gem, and the game was 0-0 in the 9th. Carpenter lashed a sure double into left. It appeared the Cardinals were well on their way to a win, as their run expectancy rose from about half a run to 1.1.

Then Carpenter rounded second, and headed for third.

He was nailed at third easily. The Cardinals run expectancy dropped all the way down to 0.25. They didn’t score in the inning, and went on to lose the game.

As you can see, run expectancy isn’t the perfect tool for evaluating baserunning. Sometimes calculated risks have to be taken based on the speed of the runner or quality of the hitter, two things run expectancy ignores.

Taking the extra base is always a calculated risk. By ignoring the times the Cardinals have been successful, I was setting them up for failure in this scenario. But when you are among the league leaders in outs on the bases, the particulars of those outs require some serious consideration.

The conclusion is this: the Cardinals reckless baserunning has cost them as many as three wins thus far this season.

This article first appeared in The Redbird Daily.


The Secret to the Twins’ Surprising Start

Almost one year ago, I took my initial stab at sabermetrics writing about how the Twins’ fabled philosophy of “pitch to contact” was being stifled by the club’s own inability to field the ball. If you are putting that much faith in your defense, it would make sense that you would have the defensive ability to back up your philosophy. For a while, this was true for the Twins. I am not going to rehash what I already wrote in August of 2015, but if I haven’t summarized myself adequately enough yet, I’ll attempt to do so again: the Twins fostered a philosophy in pitch to contact that relied on their defense, yet from 2010-2015 their defense slowly deteriorated, as did their pitching and overall record. My thought was that if the Twins were able to improve on this sub-par defense, they would be able to bail out their pitching, rather than continue to hamper it. I relied a lot of the idea of fielding-independent pitching, so if you are unaware with that concept, read about it here.

Fast forward to 22 months later, and the Twins have some new captains running the ship. These guys value math, and have started to take a more analytical look at the Twins. The most noticeable difference so far in the Twins’ somewhat surprising season (although as of this posting the team has fallen back to earth somewhat) is their improved defense. To this date, the Twins have the fourth-best defense according to Defensive WAR. Last year, they were the second-worst defense. This idea has already been written about, showing that my prediction nearly two years ago was correct. The whole idea that, on average, a good defense can bail out pitching still holds, and I ran a regression to prove it. On average, a one-unit increase in your FIP-ERA difference increases your defensive rating by 49 points. This is quite the turnaround, showing how valuable a defense can be, and this number, in combination with batting and pitching WAR, can be quantified to show its overall impact on a club’s record. I’ll spare the calculation, but one can see how this improved defense has helped lead the Twins to their surprising start.

Unfortunately, the Twins’ pitching (besides two great starts from Ervin Santana and Jose Berrios) has been awful, so any defensive gains this season have been erased by having the second-worst ERA and FIP in baseball, despite the 13th-best FIP-ERA metric. To this point in the season, the Twins have the same ERA as they did last year, but their FIP-ERA difference was a horrendous -0.52. They have a positive FIP-ERA difference this year at 0.12, showing that their pitching has actually gotten worse from last year to this current season. In some ways, their defense has kept the team above .500. Turns out my prediction was right: improve the defense, and the team will be noticeably better. If the Twins’ pitching would have stayed at the same point as last season, (4.57 FIP), in combination with their FIP-ERA metric, the Twins would be in the top-20 for pitching this season. Unfortunately, the regression of the pitching staff (independent of the defense) has kept the Twins from fully benefiting from their improved defense.

Before I wrap this up, a quick side-note on the Cubs this year. Last season, the Cubs had far and away the best defense in baseball, the best FIP-ERA in baseball, and the best ERA in baseball. This year, as any baseball fan would recognize, the Cubs have been struggling, especially with their pitching. Coincidentally, the Cubs’ pitching this year has dropped to 14th by ERA, along with their defense, which is also ranked 14th. Their FIP-ERA metric is at 13th in baseball, so their regression in defense may be partly to blame for their pitching struggles.

To sum, from 2010-2015 the Twins’ defense deteriorated, leading their pitching staff to do the same based on their pitch-to-contact philosophy. I wrote a year ago that the Twins needed to improve their defense if they wanted to continue this philosophy. They improved their defense, which has fueled a surprising start for the club, and has kept the team from bottoming out with their horrendous pitching staff.


Appendix

Linear Regression and Plot

Untitled


A Situational Lineup: Management Questions With No Clear Answers

It has come to my attention that in the 1880’s and early 1890’s an interesting management phenomenon presented itself around baseball. At this time, managers were not required to submit a lineup card before the start of the day’s game. Due to this, the first time through the batting order could be constructed the way the manager saw fit, based upon situations in the game. That being said, once the lineup went through its progression once, its construction would pervade throughout the rest of play. In lieu of this, an interesting set of strategical questions come into play. How would managers set lineups if this rule existed today? How would this effect run totals for the season for a given team? Would lineup construction change its form or remain largely the same as the way it is done now? This article is not one that analyzes or provides solutions but, instead, provides questions that are interesting and engaging to any baseball connoisseur.

The implications and strategy behind this lineup maneuverability are something that provides tons of differing opportunities for discussion. I think the lead-off hitter, if this rule was applied to the game today, would remain mostly the same. Managers would continue to look for an on-base machine to start off the game in a positive fashion. Along with this, I believe that the seven through nine batters would remain mostly static. Managers would look to place their worst hitters and their pitcher in these spots in order to diminish their number of at-bats in impact situations. With these assumptions established, a world of possibilities open up for the two through six hitters in the lineup. Each manager would approach this construction differently based upon the day’s match-up and the game’s progression. That said, here are a set of interesting scenarios that can provide interesting implications for the progression of a game and for run production in that game.

Let’s assume we’re the Angels and we have their current set of middling players that play alongside a healthy, and studly, Mike Trout. It’s the top of the first inning and the first two outs have already been made, no one’s on base, and we have to choose who will hit. Although there are no runners in scoring position, would you (as the manager) decide to hit Trout in this spot? Or, would you wait and hit Trout to lead off next inning and hope he starts off the inning strong? Or, would you wait to bat Trout sixth and hope that the first two batters in the next inning get on base and Trout can drive them in?

If you choose the latter, the implications of such would be a diminished number of at-bats in the game for Trout. Would it be worth it to wait on an impact situation to have Trout hit for the first time, even if this led to one less at-bat for the rest of the game? I think, personally, in this scenario I would hit Cameron Maybin in the three hole, following Yunel Escobar and Kole Calhoun. I think Maybin has enough pop to hit a home run every once in a while with the bases empty. I also think that if he got on base, I’d hit Trout directly following in the four hole. If it were a single by which Maybin got on, he would go first pitch and try to swipe second. If he got thrown out, it would be fine and I’d have Trout leading off my next inning, followed by Albert Pujols and Luis Valbuena. If he swiped the bag, we would now have a runner in scoring position for our best hitter, which is exactly what we want.

I can see as I’m writing that my ideas are getting harder and harder to follow, but I think this is a direct result of the vast array of possibilities this type of management choice presents. It would be interesting to see major-league managers, much more knowledgeable than myself, go about making these decisions on a daily basis. What do you think would be the best lineup set in this situation? And what other situations would be interesting to discuss as baseball fans?


The 2016 Strike Zone and the Umpires Who Control It

Introduction

One of the most-discussed issues in Major League Baseball is the consistency of the strike zone. The rule-book strike zone states “The STRIKE ZONE is that area over home plate the upper limit of which is a horizontal line at the midpoint between the top of the shoulders and the top of the uniform pants, and the lower level is a line at the hollow beneath the kneecap. The Strike Zone shall be determined from the batter’s stance as the batter is prepared to swing at a pitched ball.” After watching games throughout the regular season and playoffs, it is easy to realize this is not the strike zone that is called. Each umpire has tendencies and dictates his own strike zone and how he will call a game. With the rise of PITCHf/x and Trackman in the last few years, umpires have been increasingly monitored and judged for their accuracy and impartiality. For this reason, umpires are criticized for incorrect calls more than ever before and I believe are now trending towards enforcing the rule-book strike zone more than in years past.

The purpose of this research will be to do two things. First, I will focus on identifying overarching themes where I look at finding how umpires are adjusting to modern technology but also how the rule-book strike zone is not the strike zone we know. After this, I will dive into a few umpire-specific tendencies. The latter would be helpful to teams in preparing their advance reports by knowing how certain umpires call “their” strike zone dictated by situations in a game.

Analysis

Using PITCHf/x downloaded through Baseball Savant, I have looked at major-league umpires since 2012 in regards to their accuracy in correctly labeling pitches, primarily strikes, and their tendencies dictated by specific situations. While the height of the strike zone is often influenced by the height of the batter, there are other factors to take into account such as the how the batter readies himself to swing at a pitch. Unfortunately, the information publicly available to conduct this research does not include the batter handedness, pitcher name, or measurements of individual strike-zone limits. For this reason, a stagnant strike zone serves our needs best. The height of the strike zone shall be known as 1.5 feet from the ground to 3.6 feet from the ground. This is the given strike zone of a batter while using the pitchRx package through RStudio when individual batter height is not included.

All PITCHf/x data is from the Catcher/Umpire perspective, having negative horizontal location to the left and positive to the right. The width of home plate is 17 inches, 8.5 inches to both sides where the middle of the plate represents 0 inches. After calculating the average diameter of a baseball at 2.91 inches, we add this to the width of the plate. Therefore our strike-zone width will be 17 + 5.82, or 22.82 inches. The limits we will then set are going to be -.951 to .951 feet (or 11.41/12 inches). Throughout the paper I will be referring to pitches that fall within the boundaries of our zone as “Actual Strikes” and pitches correctly identified as strikes within this zone as “Correctly Called Strikes.”

Called Strike Accuracy By Year

As Table 1 shows, correctly identifying strikes that fall in the parameters of the rule-book strike zone has risen substantially. While 2015 has a higher percentage of correctly called strikes, 2016 PITCHf/x data from Baseball Savant was incomplete, with 28 days’ worth of games unavailable at the time of this research. A rise of 5.90 percent correctly called strikes from 2012 to 2015 shows the rule-book strike zone is being more strictly enforced.

table-one

While this provides some information, we can also look into where strikes are correctly being called using binned zones. Understanding that the evolution of umpires over the last five years is taking place and trending toward correctly identifying strikes more today than in years past, we can analyze where, in the strike zone, strikes have been correctly labeled.

Called Strike Accuracy by Pitch Location

In Table 2, we can see a tendency among umpires. Strikes are called strikes more routinely over the middle of the plate and to the left (from umpire perspective). As I have mentioned before, the publicly available PITCHf/x data I used did not include batter handedness and I am unable to determine who is receiving the benefit or disadvantage of these calls. Presumably from previous research on the subject, lefties are having the away strike called more than their right-handed counterparts, explaining the separation between correctly identifying strikes in zones 11 and 13 versus 12 and 14.

Binned Strike Zone
binned-strike-zone

table-two

While one may argue that there should not be strikes in these bordering zones, we consider any pitch that crosses any portion of the plate a strike. Due to our zone including the diameter of the baseball on both sides of the plate, the outer portion of the plate includes pitches where the majority of the ball is located in one of these zones.

Called Strike Accuracy by Individual Umpire

When gauging an umpire’s ability to correctly identify a rule-book strike, an 85.67% success rate sets the mark with Bill Miller, while Tim Tschida ranks at the bottom of this list, only calling 71.57% correctly. We can infer from Tables Three and Four along with Table One, that while umpires are calling strikes within the strike zone more often, they are still missing over 17% of these pitches. It is important to note that this information does not take into account incorrectly identifying pitches outside the rule-book strike zone as strikes, which when considering an umpire’s overall accuracy, should absolutely be taken into account.


table-three

table-four

Called Strike and Ball Accuracy by Count

One of the most influential factors in whether a taken pitch is called a strike or a ball is the count of the at-bat. We have all seen pitches in a 3-0 count substantially off of the plate called a strike, just as we have seen 0-2 pitches over the plate ruled balls. Table Five shows the correct percentage of strikes and balls by pitch count. While this shows that umpires are overwhelmingly more accurate at identifying strikes as strikes in a 3-0 count (91.06%) as compared to an 0-2 count (56.66%), we must acknowledge this only paints part of the picture. Umpires are conversely most likely to correctly labels balls in 0-2 (98.73%) counts and misidentify balls in 3-0 (90.32%) counts. I included their accuracy of correctly identifying both strikes and balls here as opposed to throughout the entire paper because we can clearly tell through this information that umpires are giving hitters the benefit of the doubt over pitchers. Umpires are far more likely overall to correctly identify a ball than a strike, as evidenced by the fact that there are no counts during which umpires correctly call less than 90% of balls.

table-five

The data in Table Five is corroborated by the visualizations in Figure One and Figure Two. These visualizations of the strike zone include pitches off of the plate and we can see that in a 3-0 count, a more substantial portion of the rule-book strike zone is called strikes while also incorrectly identifying balls as strikes. While in a 0-2 count, a smaller shaded area of the rule-book strike zone works with our findings that less strikes are identified correctly but more balls are correctly called.

figure-one-and-two

Called Strike Accuracy by Pitch Type

The next area I looked at was whether pitch type significantly altered the accuracy of umpires. In order to do this, I grouped all variations of fastballs into “Fastball” and all other pitches into “Offspeed”, while omitting pitch outs and intentional balls. I was able to see how umpires fared in correctly identifying strikes by pitch type in Table Six.
table-six

Not surprisingly, we see Bill Miller near the top of the list with both Offspeed and Fastball accuracy. For umpires as a whole, the difference in accuracy between the two is not large (79.05% Offspeed accuracy vs. 78.91% Fastball strike accuracy). On the other hand, what may come as a surprise is the fact that eight of the top ten highest accuracies were for Offspeed pitches.

Called Strike Accuracy for Home and Away

One of the most-mentioned tendencies of referees or umpires in any sport is home-team favoritism. Whether a foul or no-foul call in basketball, in or out-of-bounds call in football, or a strike or ball ruling in baseball, many think that the home team receives more of an advantage than their visiting counterparts. Looking at top and bottom half of innings, away and home team respectively, we can identify trends and favoritism in major-league umpire strike zones.

While a difference of .62% accuracy may seem like a lot, especially in a sample size of over 650,000 total pitches, we can look at this on a game-by-game level to see the actual discrepancies. For simplicity’s sake, we can assume 162 games a season, making for roughly 11780 games played in our data set (this subtracts all games from the unavailable 2016 data). This leaves us with 23.03 Correctly Called Strikes out of 29.05 Actual Strikes for away teams per game, meaning that 6.02 strikes were not called. As for home teams, we have 22.04 Correctly Called Strikes a game with 28.02 as the Actual Strikes, averaging 5.98 missed strikes a game. By this measurement we can see that more hitter leniency was given to the away team than the home team.

During this time frame, while a higher percentage of strikes were judged correctly, hitters were given more leniency as the away team than the home team on a game-by-game basis.

table-seven

Called Strike Likeliness in Specific Game Situation

Included in Table Eight are the three most and least likely umpires to call any non-fastball a strike below the vertical midpoint of our zone. I split the strike zone at 2.55 vertical feet and looked at any pitch (not necessarily within the zone) below that height. Here, we are not judging an umpire’s accuracy of correctly identifying pitches, but rather looking at where a certain umpire may call specific pitches. We can see that Doug Eddings is 5.34% more likely to call a strike on a non-fastball as compared to Carlos Torres.

While this does not paint the entire picture, we are able to see how their tendencies can play an important role in the game. Information like this may be valuable to a team in deciding how to pitch a specific batter, which reliever to bring into a game, or factor into being more patient or aggressive while at the plate.
table-eight

Conclusion

External pressures and increased standards are undoubtable effects on umpire strike zones. As evidenced throughout this paper, strike zones are called smaller than the rule-book strike zone specifies. And while umpires are trending toward correctly identifying strikes, situations such as count and pitch type can affect their judgment.

While the system in place is not 100%, we must understand that these umpires are judging the fastest and most visually-deceptive pitches in the world and are the best at what they do. Major League Baseball must use modern technology to their advantage and provide the best training for umpires to achieve the goal of calling the rule-book strike zone. Another option, while more drastic and difficult to implement, may include adapting the definition of the rule-book strike zone, something that has not been changed since 1996.


When Do Pitchers Try Harder?

Pitch counts have become an integral part of the game of baseball, so much so that it’s impossible to find a TV telecast that doesn’t display the pitch count side-by-side with the score and the inning. Yet pitch counts continue to be maybe the most annoyingly simple and arbitrary metric used to craft crucial in-game strategy. 99 mph fastball down the middle: +1 pitch. 76 mph curveball in the dirt: +1 pitch. Intentional ball: +1 pitch. Dirty ball tossed to the umpire: +0 pitches. Pitchout +1 pitch. Warmup pitches: +0 pitches. My goal here is not to fix this problem — just explore some interesting data that I believe should eventually be used to bring pitch count into the modern era.

Right now, I’m just going to look at 4-seam fastballs and how hard they’re thrown. All data comes from the 2016 regular season. Thank you Baseball Savant. The question I set out to answer is simple: When a pitcher needs to make a pitch, does he try harder? Common sense says yes, of course this is what happens. Relievers throw harder than starters in general because they don’t have to worry about throwing more quality pitches in later innings. But the data shows that pitchers change their effort levels within innings as well, especially when they have two strikes and/or runners in scoring position. Eventually, we should be able to use this knowledge to craft a better pitch count that takes this extra effort into account. Read the rest of this entry »


dSCORE: Pitcher Evaluation by Stuff

Confession: fantasy baseball is life.

Second confession: the chance that I actually turn out to be a sabermetrician is <1%.

That being said, driven purely by competition and a need to have a leg up on the established vets in a 20-team, hyper-deep fantasy league, I had an idea to see if I could build a set of formulas that attempted to quantify a pitcher’s “true-talent level” by the performance of each pitch in his arsenal. Along with one of my buddies in the league who happens to be (much) better at numbers than yours truly, dSCORE was born.

dSCORE (“Dominance Score”) is designed as a luck-independent analysis (similar to FIP) — showing a pitcher might be overperforming/underperforming based on the quality of the pitches he throws. It analyzes each pitch at a pitcher’s disposal using outcome metrics (K-BB%, Hard/Soft%, contact metrics, swinging strikes, weighted pitch values), with each metric weighted by importance to success. For relievers, missing bats, limiting hard contact, and one to two premium pitches are better indicators of success; starting pitchers with a better overall arsenal plus contact and baserunner management tend to have more success. We designed dSCORE as a way to make early identification of possible high-leverage relievers or closers, as well as stripping out as much luck as possible to view a pitcher from as pure a talent point of view as possible.

We’ve finalized our evaluations of MLB relievers, so I’ll be going over those below. I’ll post our findings on starting pitchers as soon as we finish up that part — but you’ll be able to see the work in process in this Google Sheets link that also shows the finalized rankings for relievers.

Top Performing RP by Arsenal, 2016
Rank Name Team dSCORE
1 Aroldis Chapman Yankees 87
2 Andrew Miller Indians 86
3 Edwin Diaz Mariners 82
4 Carl Edwards Jr. Cubs 78
5 Dellin Betances Yankees 63
6 Ken Giles Astros 63
7 Zach Britton Orioles 61
8 Danny Duffy Royals 61
9 Kenley Jansen Dodgers 61
10 Seung Hwan Oh Cardinals 58
11 Luis Avilan Dodgers 57
12 Kelvin Herrera Royals 57
13 Pedro Strop Cubs 57
14 Grant Dayton Dodgers 52
15 Kyle Barraclough Marlins 50
16 Hector Neris Phillies 49
17 Christopher Devenski Astros 48
18 Boone Logan White Sox 46
19 Matt Bush Rangers 46
20 Luke Gregerson Astros 45
21 Roberto Osuna Blue Jays 44
22 Shawn Kelley Mariners 44
22 Alex Colome Rays 44
24 Bruce Rondon Tigers 43
25 Nate Jones White Sox 43

Any reliever list that’s headed up by Chapman and Miller should be on the right track. Danny Duffy shows up, even though he spent most of the summer in the starting rotation. I guess that shows just how good he was even in a starting role!

We had built the alpha version of this algorithm right as guys like Edwin Diaz and Carl Edwards Jr. were starting to get national helium as breakout talents. Even in our alpha version, they made the top 10, which was about as much of a proof-of-concept as could be asked for. Other possible impact guys identified include Grant Dayton (#14), Matt Bush (#19), Josh Smoker (#26), Dario Alvarez (#28), Michael Feliz (#29) and Pedro Baez (#30).

Since I led with the results, here’s how we got them. For relievers, we took these stats:

Set 1: K-BB%

Set 2: Hard%, Soft%

Set 3: Contact%, O-Contact%, Z-Contact%, SwStk%

Set 4: vPitch,

Set 5: wPitch Set 6: Pitch-X and Pitch-Z (where “Pitch” includes FA, FT, SL, CU, CH, FS for all of the above)

…and threw them in a weighting blender. I’ve already touched on the fact that relievers operate on a different set of ideal success indicators than starters, so for relievers we resolved on weights of 25% for Set 1, 10% for Set 2, 25% for Set 3, 10% for Set 4, 20% for set 5 and 10% for Set 6. Sum up the final weighted values, and you get each pitcher’s dSCORE. Before we weighted each arsenal, though, we compared each metric to the league mean, and gave it a numerical value based on how it stacked up to that mean. The higher the value, the better that pitch performed.

What the algorithm rolls out is an interesting, somewhat top-heavy curve that would be nice to paste in here if I could get media to upload, but I seem to be rather poor at life, so that didn’t happen — BUT it’s on the Sum tab in the link above. Adjusting the weightings obviously skews the results and therefore introduces a touch of bias, but it also has some interesting side effects when searching for players that are heavily affected by certain outcomes (e.g. someone that misses bats but the rest of the package is iffy). One last oddity/weakness we noticed was that pitchers with multiple plus-to-elite pitches got a boost in our rating system. The reason that could be an issue is guys like Kenley Jansen, who rely on a single dominant pitch, can get buried more than they deserve.