Archive for Research

Probabilistic Pitch Framing (part 1)

Let’s take a look at some recent pitches and assess the framing job by the catchers.

Exhibit A: pitch #4 in this sequence from Freddy Garcia to Lucas Duda, as framed by Gerald Laird.


Hey, great framing job, Gerald Laird! That pitch was clearly a rulebook ball and you got a strike called for your pitcher. 1 point for you.

Exhibit B: pitch #3 in this sequence from Jeff Samardzija to Joey Votto, as framed by Dioner Navarro.


Boo, terrible framing job, Dioner Navarro! You just cost your pitcher what was clearly a rulebook strike! -1 points for you.

To the best of my knowledge, this is how most pitch-framing calculations currently work.  We check to see if the pitch was in the zone, and give the catcher a positive or negative credit for pitches that were called differently from how they “should” have been called.  But is that really answering the right question?

Consider the two (extreme, cherry-picked) examples above.  In example A, a pitch was called a strike that was just off the outside corner of the plate to a left-handed hitter on a 3-0 count.  It is almost certainly the case that no one in the ballpark was surprised at the result of that pitch.  After all, we know that the strike zone as it is called to left-handed hitters extends a bit off the corner, and that on 3-0 counts the umpire tends to extend the strike zone a bit anyway.  So should Gerald Laird get full credit for getting that pitch called a strike?

Exhibit B is the exact opposite case in many ways.  We had an 0-2 count on a left-handed hitter, and the pitch was near the top of the strike zone.  Given that the strike zone as it is called shrinks somewhat in an 0-2 count, and that it is shifted away to a left-handed hitter, the catcher was unlikely to get that call.  So should Dioner Navarro get a full demerit for that pitch being called a ball?

Let’s do some crude calculations.  The pitch to Duda was 0.974 feet from the center of the plate, and 2.01 feet off the ground.  Since the start of the 2012 season, there have been (according to the best data I can find) 203 pitches to left-handed hitters in a 3-0 count that fell between 0.9 and 1.2 feet from the center of home plate (in the right-handed batter’s box) and ended up between 1.6 and 2.4 feet off the ground.  Over 77% of those pitches (157/203) were called strikes.  Laird shouldn’t get much credit at all for that frame job, right?

Similarly, let’s explore exhibit B.  The pitch to Votto was 0.671 feet from the center of the plate and 3.341 feet off the ground.  I can find 89 pitches that fell between 0.47 and 0.83 feet from the center of the plate (inside to a lefty, of course) and ended up between 3 feet and the top of the strike zone to left-handed hitters in an 0-2 count.  Of these, 50 (56%) were called balls.  So should we really be penalizing Dioner Navarro all that much for that frame job?

As I hinted above, we have been answering the wrong question.  We shouldn’t be comparing what a catcher did to the rulebook strike zone.  We should be comparing what a catcher did to the probability that the call would have gone the way it did anyway.  It doesn’t matter what the actual strike zone is; all that matters is how the umpires are calling it.  This turns the calculation from a binary one (like the calculation of fielding percentage) to a probabilistic one (like the calculation of plus/minus).  Under this system, Laird would have received a credit of 0.23 for his frame, and Navarro a demerit of 0.44 for his framing.

In part 2 of this series, we will actually go about constructing the formal system to do this so we don’t have to do crude approximations like the ones above (spoiler: it will look a lot like the excellent work Matthew did here).  There will be math, yes, but there will also be lots of pretty pictures and maybe even an animated gif!  In part 3, we will actually apply this system to see which catchers have done the best frame jobs since the start of 2012 (assuming I can associate catcher data to my pitch f/x data by then).

Huge thanks to MLB for making the pitch f/x data freely available (seriously, how awesome is that?), Mike Fast for teaching me how to make a pitch f/x database, and Brooks Baseball for making the images in this post.  Also, thanks to you for reading this post and adding helpful, insightful comments below.


On Slow Fastballs

While thinking about Jeff’s post on the fastballs of over 100 miles per hour, I thought it might be informative to look at the pitchers who have pitched their fastballs the slowest this year.  No, it’s not as flashy as those who live at the top of what’s humanly possible, but it makes for an interesting contrast.  What’s more, you’ll often hear broadcasters say something along the lines of “you don’t need to throw 100 if you can locate your fastball.”  Is that true for pitchers who aren’t anywhere near 100?

There have been 683 fastballs this season (as of September 13th) that registered below 80 MPH according to pitch f/x (grouping together fastballs, 4-seamers, 2-seamers, and cut fastballs).  Two men alone account for 526 of them, with a third adding another 80.  Any guesses on who they are? (Hint: Jamie Moyer is retired.)

Read the rest of this entry »


The Supposedly Decreasing Importance of Strikeouts

Note: I have no idea if I’m the first to do this, but quite frankly I don’t care.

Let me start by apologizing for the Papelbon thing. It was a pretty stupid article, and I was basically just looking for something to write about. While I’m at it, I should probably apologize for the bFI thing–I thought that would come out better than it did–and the last part of the Pettitte thing–when a guy’s gone 28-6 against you, you tend to harbor some animosity towards him. With all that said, I feel like this is a pretty good one, even if it is rather brief. So, without further ado…

By now we’re all sick of hearing it. Strikeouts don’t matter anymore for hitters! They’ve lost their stigma¹! These crazy kids today don’t know about plate discipline! For the most part, these criticisms all seem to be saying the same general thing: Strikeouts (or the lack thereof) are no longer correlated to offensive success.

Well, I can’t speak for you, but I have really grown sick of these baseless assertions. Other writers have touched on the fact that there is virtually no correlation between strikeouts and offensive performance², but these are all within the past several years. What I wanted to prove was that there has never been a correlation between the two.

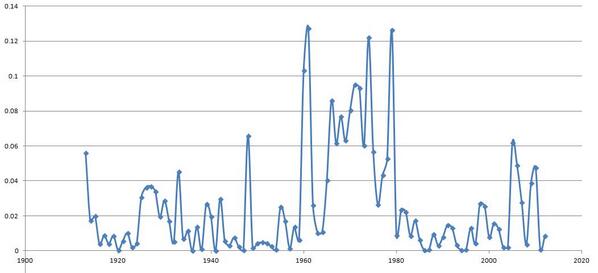
The methodology was pretty simple: Since wRC+ is the tell-all offensive statistic, I simply found the correlation, measured by R-squared³, between K% and wRC+ for every season from 2012 going back to 1913 (the first year that strikeouts were recorded for batters). I then graphed the resulting R-squared⁴ values by year for every year, of which there were 100.

And what, you ask, were the results?

Graph

“Well, golly, them folks was right!”, the reader might be inclined to say. Indeed, it would seem that–although the R-squared values have fluctuated heavily over the years–they are, overall, at a lower level than they once were. This would mean, of course, that strikeouts did matter more in the days of yore.

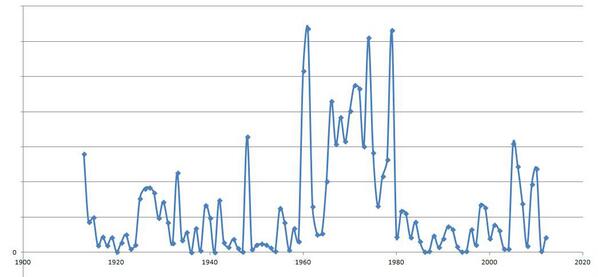
But wait! All hope is not lost! For you see, I purposefully excluded one key aspect of the graph in question: the labeling on the y-axis (i.e. the one upon which the R-squared values were measured, i.e. the vertical one). Put that back on, and what do we discover?

Graph2

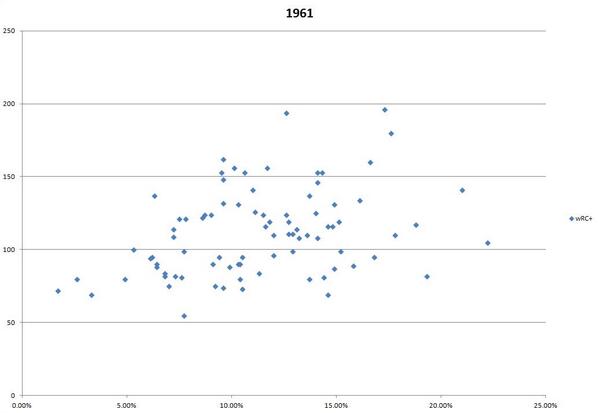
For the entirety of baseball’s history, there have only been FOUR YEARS with an R-squared above .1. Remember, R-squared is on a 0 to 1 scale, and the higher the number, the greater the degree of correlation; an R-squared of .1 is basically what you get if you draw random points on a graph. Or, to put that another way:

Graph3

That’s a scatter plot of the strikeout rates and wRC+s of players from the 1961 season (i.e. the one with the “highest” correlation). Does that LOOK like a correlation to you? Hopefully, you answered no (because of the way the internet works, I can’t know what your answer was, or even if you answered); any monkey⁵ with even a basic grasp of statistics could see that those two variables aren’t connected in any way.

What, then, does this mean?

Not only are strikeouts not correlated to offensive success now, they never have been, and probably never will be. Now, can we please stop saying they are⁶?

—————————————————————————————————————————————

¹I tried looking up specific quotes, but searching “strikeout stigma” just returned some ADHD thing.

²And, of course, scatter plots reflecting such will generally be more elliptical than straight.

³In case you’re unedumacated, R-squared measures the degree of correlation between two variables. It returns a value between 0 and 1; the higher the value, the greater the correlation, and vice versa.

⁴I’m forced to say “R-squared” to avoid confusion between that and the footnotes.

⁵Really, a monkey would probably be the one drawing the scatter plot.

⁶Or were. You know what I mean.


Starters Destined for the Bullpen

Relievers tend to be failed starters. Most front offices have come to realize that a closer or a late-inning arm is not worth a big multi-year deal or a first-round draft pick. Instead, general managers are building quality bullpens out of failed pitching prospects, former starters, and journeymen relievers. Find a hard thrower who hasn’t managed to develop a full repertoire and stick him in the bullpen where he can air it out for one inning and get by throwing only one or two pitches. Or get a starter with wild platoon splits and convert him into a specialist who gets same-handed hitters out. Look at the Royals or the Rangers bullpens, the league leaders in relief WAR. Other than a post-Tommy John surgery Joe Nathan, you won’t find a big name there, or a big salary (Nathan’s 2/14 is the most expensive).

By initially using Z-Contact%, and then looking at factors such as pitch mix, walk rates, and fastball velocity, I identified six pitchers who I think are likely to end up in the bullpen. Three of the pitchers have trouble missing bats, despite being hard throwers, and a trip to the bullpen might allow them to pick up some extra velocity while focusing on a more limited repertoire. The other three have swing and miss stuff, but factors such as a lack of control or durability, or difficulty in developing secondary pitches have limited their effectiveness as starters.

Has a Fastball But Not Much Else

Joe Kelly has appeared in 57 games for the Cardinals since 2012, 28 of them being starts. Despite averaging over 94 mph on his fastball, Kelly has been more of a groundball pitcher. As a starter in 2013, he has posted strikeout and walk rates of 13.5% and 9.8% respectively.While Kelly’s changeup is solid, his curveball and slider are likely not good enough to keep him in the starting rotation. Despite Kelly’s smaller frame, he has managed to avoid the longball. Unless the 25 year-old masters a third pitch, the bullpen is a good spot for him.

Tyler Chatwood has started 17 games for the Rockies this season, and thanks to very high groundball rates has done well, even with poor strikeout and walk rates. As the righthander is only 23, I may be jumping the gun on calling him a relief pitcher, but his declining velocity and reliance on the fastball signal reliever to me, not to mention his undersized frame. While he has improved on his career strikeout and walk rates of 13.4% and 10.3%, his rates this year are still below average. Chatwood’s changeup is below average, and he needs to develop a reliable pitch to get lefthanded hitters out. Moving to the bullpen may preserve his velocity and allow him to focus on his slider.

Henderson Alvarez has started all 54 games he has appeared in since 2011. After returning from a long DL stint, Alvarez has shown some improvement from his 2012 season when he posted strikeout and walk rates of 9.8% and 6.7%, respectively. However, the righthander had had difficulties with lefthanded hitters, as his wOBA splits of .374/.248 show. Much of this is due to his struggles with his changeup. Alvarez has gained confidence in his slider, and it has been effective against righties. The 23 year-old will get a chance to stick in the Marlins rotation, but his smaller frame, limited pitch mix and injury history will likely relegate him to the bullpen.

Misses Bats…And the Strike Zone

Alexi Ogando has bounced around between the bullpen and the starting rotation. He started in 2011, relieved in 2012, and is starting in 2013. However, he has had durability issues. His second-half numbers in 2011 dropped off significantly with increasing innings, and he has taken two trips to the DL in 2013. Furthermore, his fastball velocity is down from 95.1 in 2011 and 97.0 in 2012 to 93.1 in 2013. This has caused his swinging strike rate to plummet from 13.2 to 7.9.  His walk rate is also up significantly. Ogando was strong as a starter in 2011, and he still shows swing and miss stuff, but a return to to the relief role he held in 2012 would do him well, particularly if Joe Nathan departs as a free agent.

Nathan Eovaldi is a 23 year-old flamethrowing righthander. However, the young hurler has not yet developed a reliable secondary pitch. Accordingly, his strikeout rate is well below the league average. Also, while his control has been better this year, he still walks hitters at an above-average rate. Though his fastball can get whiffs as shown by his above-average swinging strike rate, his lack of secondary pitches has given him difficulty in finishing off hitters. He had some success with his slider in 2012, but has struggled to command it consistently in 2013. If Eovaldi can stay healthy and learn a secondary pitch, he will remain a starter. More likely, he will slot into a high-leverage bullpen role where he can focus on airing out his already potent fastball.

Tim Lincecum won back-to-back CY Young awards in 2008 and 2009. The last couple years have not been as kind to Lincecum. His fastball velocity has dropped by 2 mph, and his walk rate has gone up. Furthermore, his HR/FB ratio has shot up to the 13-15% range, well up from his career rate of 9%. Lincecum still has swing and miss stuff, as his swinging strike rate has not dropped off from his career rate. Lincecum was utilized as a multi-inning reliever in the 2012 World Series, and dominated in that role. While Lincecum proved a lot of skeptics wrong by remaining healthy in a starter role, transitioning to the bullpen can maximize his effectiveness. However, depending on how much money he signs for this offseason, his new team may have an incentive to try and keep him in the rotation.

While a good starting pitcher will always have more value than a good relief pitcher, moving these pitchers to the bullpen can maximize their productivity. All of them profile as at least solid relievers, and at this point in their careers, I have my doubts that any of them, with the possible exception of Lincecum, can handle the rigors of starting.


The Oakland A’s and Winning Without Good Starting Pitching

The Oakland Athletics starting pitchers have posted a 106 xFIP-, and accumulated 9.5 WAR, figures that are 23rd and 19th in the MLB, respectively. As the below table shows, pitching independent stats do not show much love for the Athletics starting pitchers, with their walk rate being the only number not around the bottom third of the league.

 Stat xFIP- K% BB% GB% WAR
 Number 106 17.8 6.7 38.8 9.5
Rank      T-23rd         21st         T-7th          30th       T-19th

However, the A’s starting pitchers fare better in terms of defense-dependent stats, and with the exception of Brett Anderson, they have managed to stay healthy.

 Stat ERA- BABIP LOB% HR/FB RA9 WAR Innings
 Number            97        0.273          73.7            9.7          12.0        862.2
Rank        T-7th            1st         T-6th            7th           8th            5th

Finally, to give you an idea of how pedestrian their staff has been (at least in terms of sabermetric numbers, more on that later), I prepared a table of the A’s starting pitchers this year.

Pitcher Innings xFIP- K% BB% BABIP LOB% HR/FB WAR Fbv
Bartolo Colon 164.1 104 13.0 3.8 0.297 77.8 5.8 3.0 89.7
Jarrod Parker 176.1 110 16.8 7.9 0.256 75.4 9.0 1.7 91.7
Dan Straily 134.1 110 19.4 8.5 0.271 71.2 9.2 1.4 90.4
Tommy Milone 143.0 109 17.7 6.1 0.283 71.7 11.1 1.0 87.1
A.J. Griffin 182.0 107 19.8 6.6 0.250 77.2 12.3 1.2 88.9
Sonny Gray 39.0 73 24.4 6.4 0.264 67.2 6.7 1.1 92.9
Brett Anderson 23.2 91 21.3 11.7 0.366 55.6 17.6 0.1 91.2

The Coliseum is the 8th-most difficult park in terms of hitting home runs, and the A’s fly ball rate of 42.0% leads the MLB (no other team gets a higher percentage of fly balls than groundballs). Gray has been excellent in the six starts he has made, with a 53.7 GB%. Other than Anderson and Gray, no A’s starting pitcher has a GB% above 42.3%. Put a team full of fly ball pitchers in a big ballpark with a good outfield defense, and you have a recipe for overachieving peripherals. This helps explain how the A’s starting pitchers have managed to put together a 3.79 ERA despite a 4.25 xFIP, easily the biggest positive gap of any team.

Except for newcomer Gray (18th overall in 2011), the A’s have not used high draft picks to get these pitchers. In fact, since 2003, the A’s have only selected four pitchers out of their nineteen first round picks. Colon was an inexpensive free-agent signing. Parker and Anderson were acquired in trades with the Diamondbacks where the A’s gave up Haren and Trevor Cahill after getting some solid years out of those arms. Milone, a former 10th-round pick, was acquired as part of the Gio Gonzalez trade. Straily was a 24th-round pick in 2009. Griffin was a 13th-round pick in 2010. If you click on the links, (or just keep reading) you will find out that one other player from those two rounds has reached the majors. (Keith Butler, who managed a 5.44 xFIP in 20 innings with the Cardinals this year). Most players drafted in those rounds are no longer playing affiliated baseball, not starting games for a playoff-bound team.

As the A’s starting pitchers are currently 23rd in the MLB in xFIP- and CoolStandings puts their playoff odds at 98 percent, I thought it would be interesting to see how many teams had made the playoffs with their starting pitchers possessing a cumulative xFIP- of 106 or worse. As xFIP- only goes back to 2002, the search was restricted to the 2002-2013 era.

The 2011 Diamondbacks finished 94-68, winning the NL West.  Diamondbacks starting pitchers posted a 107 xFIP, good for 25th in MLB. Thanks to some innings eaters, they tallied 12.0 WAR, 15th in the MLB. Like the A’s, the Diamondbacks had a staff of fly ball pitchers, as they posted the lowest groundball percentage in the league. Despite playing at cozy Chase Field, their HR/FB ratio was only 9.8%, due in part to their rotation getting the fourth-highest infield-fly rate. They also had the third-lowest walk rate in the MLB. Featuring an outfield of Chris Young, Gerardo Parra, and Justin Upton, the Diamondbacks led the MLB in UZR. The rotation featured excellent seasons from Ian Kennedy and Daniel Hudson, with a side of Josh Collmenter. Nobody else reached +1 WAR. The Diamondbacks beat their Pythagorean record by +6 wins. Their 28-16 record in 1-run games was the best in the MLB.

Okay, so only one team has made the playoffs with an xFIP- of 106 or worse, and the 2011 Diamondbacks were knocked out in five games by the Brewers. So, to see if I could include some more teams, I expanded the search to include teams whose starting pitchers finished 23rd or worse in xFIP-.

The 2006 Mets won the NL East, going 97-65. Their starting rotation  featured a 104 xFIP-, which was 24th in the MLB. Like the A’s and Diamondbacks, this was a staff of flyball pitchers, which finished 28th in groundball percentage. Outfielders Carlos Beltran and Endy Chavez ran down many of those flyballs. Unlike the A’s and Diamondbacks, the 2006 Mets were heavy on strikeouts and walks. The staff finished 8th in strikeouts and 7th in walks. Overall, the starting rotation was 26th in WAR, with a 40-year-old Tom Glavine leading the team at +2.5, followed by 34 year-old Pedro Martinez and 36 year-old Orlando Hernandez at +2.0 and +1.7, respectively. Headed by Billy Wagner and Aaron Heilman, the Mets bullpen finished 2nd in WAR and xFIP, and 4th in innings. Mets hitters also finished 7th in wRC+. Furthermore, the Mets beat their Pythagorean record by +9 wins, going an MLB-best 31-16 in 1-run games.

The 2006 Oakland A’s won the AL west at 93-69 with a starting rotation that had a 104 xFIP, 23rd in the MLB. That staff featured strong years from Barry Zito and Dan Haren, who helped the A’s rotation throw the 4th most innings in the MLB, which allowed them to accumulate a more respectable 11.9 WAR, 17th in the MLB. Unlike this year’s version of the A’s, the 2006 staff was middle of the pack in groundball percentage. The bullpen featured contributions from a bevy of relievers, finishing 5th in relief WAR, despite throwing the 7th fewest innings. The hitters were patient but generally lacked power, as they finished 2nd in walk rate and 25th in ISO. An old Frank Thomas and a young Nick Swisher combined to hit over 40 percent of the team’s home runs. The fielding was solid but far from spectacular. Like the Diamondbacks and Mets, they beat their Pythagorean record by a substantial margin.  Their 32-22 record in 1-run games helped them finish with +8 wins.

And that’s it. No other team has made the playoffs since 2002 after having their starting pitchers finish 23rd or lower in xFIP-. To tally it up, that’s one team that has made the playoffs with a starting rotation that posted an xFIP- of 106 or worse, and only two more that made the playoffs while finishing 23rd or worse in xFIP-, one of those being the A’s. The A’s success this year isn’t quite unprecedented, but it’s close. Unlike the other teams mentioned, the A’s have played to their Pythagorean record. Rather than emphasizing velocity (A’s starters are 28th in fastball velocity) Billy Beane has sought out young strike throwers who can stay healthy (and Colon, an old strike thrower). By putting them in a big ballpark with good outfielders, the A’s have managed to make below-average starting pitchers look solid. Billy Beane and the A’s are finding a way to beat sabermetric pitching stats such as xFIP and FIP.  By drafting pitchers later and making the most out of less than electric arms they have managed to insure themselves against the risks associated with young pitchers.


Pitching Backwards: Is The Fastball The Best Pitch in Baseball?

The fastball is the holy grail of pitching. Listen to a baseball broadcast, particularly one that involves a former pitcher, and you are likely to hear something along the lines of “the fastball is the best pitch in baseball and always will be.” However, since 2002, fastball usage has been declining, and since 2007, runs scored have been declining as well. The strategy of pitching backwards has been cited as a reason for the strikeout increase and the decrease in runs scored. Also, as the below table shows, fastball velocity for starting pitchers has steadily increased since 2002, which has also been cited as a reason for the current offensive environment.

Year Fb% Fbv ERA K%
2002 63.10% 89.5 4.41 16.00%
2003 63.00% 89.5 4.52 15.60%
2004 61.30% 89.7 4.62 16.00%
2005 60.70% 89.7 4.36 15.60%
2006 59.70% 90 4.69 15.90%
2007 59.70% 89.8 4.63 16.10%
2008 59.70% 90.3 4.44 16.60%
2009 59.00% 90.8 4.45 17.10%
2010 57.30% 90.7 4.15 17.60%
2011 56.40% 91 4.06 17.70%
2012 55.90% 91 4.19 18.70%
2013 56.30% 91.2 4.03 18.70%

To investigate the idea of the fastball being the best pitch in baseball, I first sorted all qualified starting pitchers since 2002 by fastball usage. Then, I sorted all qualified starting pitchers by fastball velocity. The first table is sorted by fastball usage, going from the most fastball-heavy to least fastball-heavy in descending order. Not surprisingly, Bartolo Colon utilizes his fastball more than any other starting pitcher. I excluded knuckleballers Tim Wakefield and R.A. Dickey from the list.

Fbv WAR/200 IP BABIP HR/FB K% BB% GB% FB%
League 90.3 2.4 0.295 10.7 16.8 7.9 43.0 35.0
Group 1 90.6 2.5 0.297 10.4 14.8 7.7 48.0 30.2
Group 2 90.7 2.7 0.294 10.3 18.5 8.8 43.9 34.3
Group 3 90.5 2.8 0.294 10.3 16.7 7.4 42.1 35.8
Group 4 91.0 2.4 0.292 10.7 16.8 7.7 44.5 33.8
Group 5 90.8 2.9 0.295 10.1 17.9 8.2 43.2 35.0
Group 6 89.7 2.6 0.296 10.6 16.9 7.4 42.5 35.1
Group 7 89.5 2.6 0.297 10.3 16.7 7.3 41.8 35.8
Group 8 90.6 2.7 0.294 10.5 18.4 8.0 43.2 35.0
Group 9 89.6 2.6 0.290 10.5 17.7 7.7 41.5 36.6
Group 10 89.1 2.9 0.291 10.7 17.0 6.7 43.2 35.0

The group that used their fastball the most had the least strikeouts, which should not be surprising for anyone who has seen Colon pitch. Several groundball, pitch-to-contact types such as Kirk Rueter and Aaron Cook populated the first group. The least effective groups were Group One which used their fastballs the most, and Group Four, which had the highest average fastball velocity. Interestingly enough, the walk rates are all over the board. Group Two had the highest walk rate. Group Ten, which was composed of pitchers who used their fastballs sparingly, had the lowest walk rate by a wide margin. Overall, there is not much of a connection with fastball usage and success. The average WAR/200 IP of the first five groups is the same as the last five groups. If the fastball is the best pitch in baseball, pitchers who throw it more often are not more effective.

The below table is a listing of all qualified starting pitchers, sorted in descending order by fastest average fastball velocity.

Fb% WAR/200 IP BABIP HR/FB K% BB% GB% FB%
        League 59.3 2.4 0.295 10.7 16.8 7.9 43.0 35.0
       Group 1 62.3 3.6 0.293 9.7 21.1 8.2 44.3 34.4
       Group 2 60.7 3.3 0.296 10.3 19.7 7.9 43.6 34.7
       Group 3 63.2 3.2 0.292 10.0 18.9 7.9 45.0 33.5
       Group 4 59.3 2.8 0.294 10.4 18.8 8.3 42.5 35.9
       Group 5 58.7 2.9 0.295 10.4 17.5 7.1 43.7 34.4
       Group 6 61.8 2.2 0.295 11.1 15.5 7.6 44.6 33.6
       Group 7 58.3 1.9 0.296 10.9 15.6 7.8 43.8 34.0
Group 8 58.2 2.5 0.295 10.7 15.7 7.3 43.1 34.7
Group 9 59.0 2.3 0.291 11.0 15.4 7.2 42.7 35.0
Group 10 55.8 2.1 0.292 10.3 14.2 7.3 40.9 36.5

This chart lends more support to the assertion that the fastball is the best pitch in baseball. As you would expect, strikeout rates decrease with declining fastball velocity. Overall, there is a strong link between average fastball velocity and pitcher quality. There also appears to be a link between fastball velocity and HR/FB rate, though Group 10 messes things up.

Not surprisingly, it looks pretty clear that fastball velocity is a significant predictor of success. However, offspeed offerings have been emphasized more in later years, as overall fastball usage has steadily dropped. Justin Verlander, owner of the third fastest fastball for starting pitchers in the Pitch f/x era has thrown his fastball less than 60% of the time during that period. On the other hand, hard thrower Daniel Cabrera threw his fastball on nearly 75% of his pitches over the course of approximately 900 largely unproductive innings.

The rise in strikeouts and drop in runs scored has largely corresponded with increasing offspeed usage. Pitchers are throwing more offspeed pitches, and hitters sitting on the fastball are being caught off guard. As a way of adjusting to the current run of pitching dominance, I have to wonder if pitch recognition and plate-discipline skills will have a more prominent emphasis. Perhaps raw home-run power and bat speed have been overemphasized. (How often would Wily Mo Pena strike out if he played today?). With the way pitchers can control and command their offspeed pitches (walk rates have not risen with decreasing fastball usage), the old strategy of sitting on the fastball may need to be tweaked if hitters are going to catch up with pitchers. Strikeouts are not inherently bad, (a look at this year’s strikeout leaderboard confirms my statement) but today’s hitters are also walking less despite seeing less pitches in the strike zone. The Pitch f/x data in the table below illustrates this phenomenon.

Year K% BB% Zone% O-Zone Swing%
2008 17.50% 8.70% 50.30% 28.00%
2009 18.00% 8.90% 50.40% 27.90%
2010 18.50% 8.50% 50.40% 28.40%
2011 18.60% 8.10% 50.10% 28.90%
2012 19.80% 8.00% 49.50% 29.30%
2013 19.70% 7.90% 49.20% 29.60%

Of course, pitch recognition is not nearly as exciting as raw power, and chicks probably don’t dig plate discipline like they dig the long ball. However, combating the recent run of strikeout-driven pitcher dominance by valuing pitch recognition and plate discipline is almost certainly a better approach than seeking out contact hitters in the way that Diamondbacks GM Kevin Towers has done. Despite his statements about valuing hitters with pitch recognition, his 2013 squad chases more pitches than the 2010 team which set the MLB strikeout record. While fastball velocity plays a crucial role in a pitcher’s success, even the hardest throwers are mixing in plenty of offspeed pitches to keep hitters off balance. Hitters without the ability to adjust are being exploited.


Concerning Jim Johnson and Groundball Relievers in General

Despite leading the AL in saves,  Orioles closer Jim Johnson is having a rough year compared to 2012 when he posted a 2.51 ERA and saved 51 games in 54 opportunities. Early in 2013, an enthusiastic Orioles sportswriter named Johnson the best closer in baseball, a statement that doesn’t look quite so good a few months later. As a closer who relies on the groundball, Johnson is something of an odd bird (pun intended). In 2012 his 15.2 K% ranked 130th out of 136 qualified relievers and his Zone-Contact% was 2nd highest. This year his 18.0 K% ranks 111th out of 140 qualified relievers and his Zone-Contact% is 9th highest. While Johnson has struck out a few more hitters, he has also walked slightly more, from 5.6% to 7.1%, and his groundball rate is down. Overall, his fielding-independent numbers are basically the same as last year. Various explanations have been offered for Johnson’s lack of success in 2013 compared to 2012. Bill Castro, the Orioles interim pitching coach (check out his 1979 season) attributes Johnson’s struggles to overthrowing, and a failure to locate down in the zone which has resulted in less early contact outs. I prepared the following chart to check up on these explanations.

Bottom Third% MiddleThird% UpperThird% 2-Seam velo Z-Contact% GB%
2012 14.0 14.5 8.3 94.2 92.9 62.3
2013 14.5 14.4 7.7 93.7 90.6 56.2
    Career 14.7 14.6 8.3 94.2 90.2 57.5

So Johnson is throwing slightly more pitches in the lower third of the zone, and actually getting more swings and misses on pitches in the zone. The overthrowing statement seems faulty, as Johnson’s velocity on his sinker is actually down. A look at the Pitch f/x data shows that his sinker has flattened out slightly from last year, though the difference is slight overall. The following chart shows what kind of contact batters are making off Johnson compared to last year.

BABIP HR/FB HR% HR Per Contact
2012 0.251 6.8 1.1 1.4
2013 0.323 12.5 2.1 2.9
          Career 0.286 8.0 1.5 2.0

And to go in even more detail the following two charts show BABIP by zone and then the slugging by zone for Johnson.

BABIP
Lower Third Middle Third Upper Third
2012 0.289 0.296 0.259
2013 0.292 0.486 0.423
               Career 0.286 0.298 0.343
SLG
Lower Third Middle Third Upper Third
2012 0.294 0.283 0.516
2013 0.321 0.561 0.515
               Career 0.331 0.382 0.503

So balls put in play against Johnson have been falling for hits more frequently this year and those hits have been more damaging in each third of the strike zone. In particular, the pitches Johnson has thrown over the middle have been getting hammered. Last year, the results on those pitches were quite tame. Granted, this is a pretty small sample size of balls in play, and nowhere near the point where BABIP is expected to stabilize, but it goes to show that Johnson has not fared nearly as well when hitters are making contact in 2013. But, this is not an uncommon issue for high-contact, groundball pitchers. David Robertson can suffer through a .335 BABIP in 2012 and still post a 2.67 ERA on the strength of a 32.7 K%. Pitchers like Johnson who cannot strike out hitters regularly are subject to variance on batted balls. Take a look at most groundball, contact-type pitchers, and you’ll find years where BABIP and ERA go through the roof. With the 60-70 inning seasons relievers work, the results can get skewed very badly. To get a sense for where Johnson stands relative to other groundball relievers, I did an analysis of all qualified relievers since 2002 and separated the 30 highest and 30 lowest groundball rates (Johnson was 24th).

GB% K% BB% BABIP LOB% Fbv Fb% HR% HR Per Contact WAR/60 IP SD/MD
League 44.1 19.5 9.5 0.292 73.3 91.5 62.8 2.4 3.5 0.3 1.7
GB-Heavy 60.5 16.9 9.1 0.294 73.0 90.3 72.7 1.7 2.3 0.4 1.7
GB-Light 31.2 24.4 8.7 0.264 77.0 91.2 64.7 3.0 4.6 0.6 2.3

So not a whole lot of good things to say about the groundball heavy group. Jonny Venters was the only member of the group with a strikeout rate above 20%. They limit home runs pretty well, which is to be expected with so few fly balls. However, many of those groundballs are going for hits, while fly balls that aren’t leaving the yard are twice as likely to be outs.  That 30 point difference in BABIP is pretty huge, and that’s over a sample of more than 20,000 balls in play for each group. Overall, the decrease in home runs isn’t worth the extra hits and walks. With guys like Kenley Jansen and Rafael Soriano, it’s not surprising that the fly ball group features a much better ratio of shutdowns to meltdowns. For the most part, the groundball group is filled with situational guys that have bounced around with sporadic success. While relievers of all types tend to be unreliable, groundball and contact types are subject to the additional randomness of batted ball variance.

Seasons with inflated BABIP and ERA should be an expected consequence for a contact pitcher like Johnson. Of course, it would have been very difficult for the Orioles to demote Johnson to a lower-leverage bullpen role after the success he had in 2012. However, all signs indicate that Johnson is an average bullpen arm whose performance last season far outweighed his ability. He is better suited for the role he played in 2010 as a mid-leverage arm who was not limited to one inning. The Orioles should look for a strikeout arm for high-leverage situations. While Buck Showalter has consistently defended Johnson, not too many managers will bring back a closer after a season leading the league in blown saves.


It’s Time for the Rockies to Change Their Pitching Strategy

Since 2002 (the batted ball era), the Colorado Rockies pitchers have the 4th highest groundball percentage in the MLB. On its face, this seems like a good strategy, as Coors Field has an effect on batted and thrown baseballs that is not pitcher-friendly. Rockies’ pitching coach Jim Wright emphasizes pitching down as key to the success of the staff. However, the emphasis on groundballs has caused the Rockies to get into relationships with pitchers such as Shawn EstesAaron Cook and Jeff Francis, hurlers that lack strikeout stuff. And lest we forget, this same club famously gave Mike Hampton, a groundball pitcher who never averaged more than 6.9 K/9, what was then the richest contract in sports history. As a consequence, Rockies pitchers have the 5th lowest strikeout rate in the MLB since 2002. Compounding this problem is the fact that the Rockies have the 6th highest walk rate. Of course, there is the counter-argument that it is harder for pitchers to get strikeouts at Coors Field due to the effect that the altitude has on offspeed pitches. Additionally, it would seem that a pitcher could be forgiven for nibbling a little at the high altitude. I did a little research to determine how much of the poor strikeout and walk rates are due to Coors Field and how much could be attributed to the pitching style the Rockies advocate. I found that only three teams have higher walk rates in road games, and only four teams have lower strikeout rates. So Coors Field is not entirely at fault for the lack of strikeouts and proliferation of walks.

Since 2002,  Coors Field has the second-highest HR/FB ratio behind only the Reds’ Great American Ballpark. I took a look at the Home/Away splits of the five parks with the highest HR/FB ratios since 2002 to see if they tried to combat the longball in a style similar to the Rockies.

HOME
         Team              HR%          HR Per         Contact         HR/FB            GB%         BABIP            K/9          BB/9           xFIP            ERA
       League 2.6 3.6 10.2 44.3 0.291 7.0 3.1 4.14 4.06
          Reds 3.4 4.6 12.8 42.5 0.291 7.0 3.0 4.21 4.42
      Rockies 3.0 4.0 12.5 46.3 0.311 6.4 3.3 4.27 4.96
    Blue Jays 2.9 4.0 12.1 46.2 0.292 7.1 3.1 3.93 4.27
       Phillies 2.9 4.1 12.1 44.8 0.288 7.4 2.9 4.08 3.99
       Orioles 3.1 4.2 12.1 44.0 0.294 6.4 3.5 4.51 4.61
AWAY
         Team             HR%           HR Per         Contact         HR/FB            GB%         BABIP            K/9           BB/9           xFIP            ERA
       League 2.7 3.0 10.7 43.8 0.296 6.7 3.4 4.36 4.45
          Reds 2.7 3.7 10.5 43.4 0.299 6.5 3.4 4.41 4.43
       Rockies 2.5 3.4 10.0 44.9 0.297 6.5 3.7 4.48 4.56
    Blue Jays 2.7 3.7 10.8 43.4 0.300 6.5 3.7 4.56 4.48
        Phillies 2.6 3.6 10.3 43.9 0.295 6.8 3.2 4.24 4.21
        Orioles 2.9 4.0 11.2 45.1 0.294 6.5 3.5 4.39 4.91
OVERALL
Team HR% HR Per Contact HR/FB GB% BABIP K/9 BB/9 xFIP ERA
League 2.7 3.7 10.4 44.0 0.294 6.9 3.3 4.24 4.24
Reds 3.0 4.1 11.6 42.9 0.295 6.8 3.2 4.31 4.42
Rockies 2.7 3.7 11.2 45.6 0.305 6.5 3.5 4.38 4.76
Blue Jays 2.8 3.9 11.4 45.6 0.293 6.8 3.3 4.08 4.26
Phillies 2.8 3.8 11.2 44.3 0.292 7.1 3.0 4.09 4.09
Orioles 3.0 4.1 11.5 43.7 0.297 6.4 3.6 4.54 4.76

So the Rockies strategy of pitching to groundballs has led to some success in limiting longballs. Among these teams, only the Blue Jays can match the Rockies HR Per Contact rate for home games. The Rockies overall HR rate and HR Per Contact rate is league average, thanks to a road HR rate that only two teams can best. Unfortunately for the Rockies, home runs are not the whole story, and their team xFIP and ERA are 7th and 11th worst on the road. Overall, their team xFIP and ERA are 8th and 2nd worst. The Phillies, Blue Jays, and Reds all have strikeout rates at or above league average. Since 2008, the Blue Jays and Reds have stepped up their strikeout efforts. Meanwhile, the Rockies are 29th in strikeout rate in 2013.

Don’t be fooled by the recent success of Jhoulys Chacin and his HR/FB ratio of 4.9%, the Rockies need to focus more on strikeouts than groundballs. While groundballs have helped limit home runs, the Rockies are still giving up plenty of hits, walks, and runs. Strikeouts need to enter the equation for the Rockies staff to be successful. For a couple of years they had the perfect marriage of both with Ubaldo Jimenez, but none of the three pitchers obtained in the trade with the Indians (a well-timed one) has panned out. Perhaps if the Rockies acquired strikeout pitchers, they could configure their rotation so that those pitchers threw more innings on the road. It’s not as if they haven’t utilized a non-traditional approach with their pitching staff before. The Rockies probably shouldn’t spend 250 million to acquire strikeout pitchers like the Yankees did with C.C. Sabathia and A.J. Burnett when they moved into the cozy confines of the new Yankee Stadium. More than twelve years later, the Mike Hampton signing still has a bad taste in their mouth.  However, there is precedent for developing and acquiring strikeout arms at an affordable cost.

Look at the Reds. Since Walt Jocketty took over as GM in 2008, the Reds have managed to develop and acquire strikeout arms as a means to limit runs in homer-happy Great American Ballpark. The 2013 Reds are 4th in K/9 and 4th in xFIP and ERA. Aaron Harang’s contract was bought out once his strikeout stuff diminished. Homegrown product Tony Cingrani has been striking out hitters at an incredible rate in his first 100 innings with the big league club. The organization’s patience with Homer Bailey has been rewarded. Edinson Volquez posted excellent strikeout rates before being used to acquire Mat Latos and his devastating slider. And of course, they signed the flamethrowing international free agent Aroldis Chapman. While rotation mainstays Mike Leake and Bronson Arroyo are never going to blow anybody away with their stuff their ability to limit walks has allowed the Reds to rely on them as back-end innings eaters. Chapman’s 6 years/30 million is the biggest commitment to any of the above pitchers.

Currently, the Rockies farm system is not loaded with strikeout pitchers. Tyler Matzek is intriguing, but his strikeouts are way down this year as he has moved up a level and attempted to improve his control, and he is far from a sure thing. Tyler Chatwood has shown some promise at the big-league level, but his secondary pitches will have to be refined for him to have long-term success. Chad Bettis was blowing away Double-A hitters before a recent callup, but his innings against MLB competition have been predictably average. Most likely, this is not a quick fix, but more of a long-term strategy which will have to be implemented across several drafts.


Pitcher STUFF Ratings or, It’s Too Bad Rich Harden Couldn’t Stay Healthy

Of course, the concept of “stuff” is very subjective, and my formula is not so much of an attempt to quantify a subjective concept as it is an attempt to measure how well pitchers do things we associate with great stuff. Because I used Pitch f/x data exclusively, the ratings were limited to pitchers from 2007 to the present.

My formula is ((4*O-Zone Swing% *O-Zone Whiff%)+(3*Whiff%)+(5*Zone-Whiff%)+(2*IFFB%)*(FBv/100)*(4))

I will probably tinker with the formula, and will welcome any suggestions with regards to improving it. I have only applied it to starting pitchers. Of course it can be applied to relievers, but their scores run much higher unless some kind of a “relief penalty” is applied. The STUFF ratings for all starting pitches who threw at least 160 innings since 2007 run between 3.4 and 9.7. The following list presents the top 15 career STUFF pitchers since 2007.

1. Rich Harden 9.7. If you’re having trouble remembering just how filthy Harden could be, visit his player page. Harden got swings and misses like no other starter. In 2008 he had an unearthly 48 ERA- and 68 xFIP- despite the fact that injuries had already started to take their toll on his fastball velocity, as it dropped to 91.7, compared to 94.1 the year before. In 141 innings in 2009, he got whiffs on 22.6% of swings on pitches in the zone. Max Scherzer, the 2013 leader in that category, gets whiffs in the zone at an 18.4% clip. When Aroldis Chapman averaged 100 mph on his fastball in 2010, he sat at 21.9%. Unfortunately, a litany of injuries would decimate Harden’s career, and he was recently released by the Twins, an organization known for their disdain for swing and miss stuff.

2. Matt Harvey 9.4. The young right-hander with the dynamic fastball places near the top in all five of the STUFF factors, with only Scherzer, Harden, and Escobar topping his 17.6 Zone-Whiff%. Besides the fastball, Harvey also features a slider, curveball, and changeup. Harvey’s plethora of filthy offerings produces whiffs on over a quarter of his pitches overall. Furthermore, Harvey is one of the rare pitchers who has actually experienced an increase in fastball velocity since his debut season.

3. Yu Darvish 9.2. Darvish uses his assortment of pitches to produce whiffs on over half of swings at pitches he throws outside of the zone, easily the best in the sample. Combine that with a whiff rate of 15.9%  for swings on pitches in the zone and you get an overall whiff rate of 28.6%, also the best in the sample. Pitch f/x credits Darvish with six different pitches, four of which he throws at least 12 percent of the time. Though Darvish averages 92.9 mph on his fastball, he has thrown his slider nearly as often as his four-seamer and two-seamer combined. The unconventional approach has produced five games of 14+ strikeouts in 2013.

4. Kelvim Escobar 8.9. Escobar only had one year of data, but what a year it was. At the age of 31, Escobar’s fastball velocity surged to 94.1, higher than any of the pre-pitch f/x years, and he utilized an excellent changeup to get whiffs on over a third of swings at pitches he threw outside of the zone and a quarter of swings overall. However, in spring training of 2008, Escobar was diagnosed with a shoulder injury that required surgery and except for a 5 inning stint in 2009, he never returned to the majors.

5. Michael Pineda 8.7. Like Escobar, Pineda only has one year of data in the sample due to shoulder surgery. Elite fastball velocity combined with a slider that helped generate swings on a third of the pitches he throws out of the zone and contact on less than sixty percent of those swings earns him this ranking. The big righty also used his height to get one of the highest infield fly rates in the sample. Pineda was placed on the DL shortly after an August 2 rehab start resulted in stiffness in his shoulder, and it appears unlikely that the righthander will pitch again in 2013.

6. Matt Moore 8.6.While Moore’s fastball velocity has dipped steadily since he came into the league in 2011, its overall average is still 93.6. Moore’s ranking is based heavily on his 2012 STUFF rating of 9.3, his 2013 rating has fallen to 7.4. Moore has battled elbow soreness this year, and hopefully this will not be a long-term issue and he can return to the form that generated a dominant 19.0 Zone-Whiff% in 2012.

7. Francisco Liriano 8.6. Liriano’s slider has long been one of the best pitches in the game, and only Darvish can top his whiff rate on pitches outside the zone. Since joining the Pirates, Liriano has been using the slider even more, throwing it on 37.1% of his pitches. Liriano is also throwing his changeup more than he ever has before. While his 13.1 Zone-Whiff% in 2013 is one of the lowest numbers of his career, the offspeed pitches have resulted in a 36.1% chase rate, the highest of his career. It’s anyone’s guess as to how long Liriano’s oft-troubled elbow holds up, but Pirates fans should enjoy the ride while it does.

8. Cole Hamels 8.5. A master of deception, Hamels’ changeup has helped him produce a career whiff-rate of 24.5%. Among pitchers on this list, Hamels 90.9 mph fastball is faster than only fellow changeup artist Johan Santana. However, the 8-9 mph difference between his fastball and changeup produces a 33.8 chase rate, the 5th highest in the sample, and his 37.0 rate in 2013 leads the majors. Hamels has also been very durable, among the top 15 STUFF pitchers, only Justin Verlander has thrown more innings.

9. Stephen Strasburg 8.5. While Strasburg’s fastball velocity has fallen from its pre-Tommy John high of 97.6, his 95.9 average is still tops Felipe Paulino, the next closest in the sample by 0.7 mph. While we will probably not see the pure electricity of the pre-injury Strasburg which produced a 9.5 STUFF rating in 2010, Strasburg still gets whiffs on over 15% of swings on pitches in the zone and 25% overall. If the Nationals’ controversial innings-management plan pays dividends and the 25 year-old can stay healthy, he should be getting whiffs for years to come.

10. Max Scherzer 8.3.  It seems fitting that a noted sabermetrician would obtain a high ranking on a list based on Pitch f/x and batted-ball data. To the misfortune of AL hitters, Scherzer has vastly improved his secondary pitches while maintaining his fastball velocity. Before his trade to the Tigers, Scherzer threw his fastball over two-thirds of the time. With the Tigers, Scherzer’s fastball usage has decreased each year, and his use of secondary pitches, particularly his changeup, has increased. Not surprisingly, this has resulted in higher chase and whiff rates, and his Zone-Whiff%  of 19.9 since 2012 leads the majors.

11. Clayton Kershaw 8.1. Kershaw burst onto the scene in 2008 as a 20 year-old rookie with a 94 mph fastball and 73 mph 12-6 curveball. Since then he has added a slider to make life even more miserable for hitters. Kershaw ranks near the top in all five of the STUFF factors. Kershaw appears to be the odd bird that can use his pitch arsenal as much to suppress BABIP as to generate swings and misses, and this factor probably keeps him from being ranked even higher.

12. Tim Lincecum 8.0. You would be hard-pressed to find a smaller starting pitcher than Lincecum. While that height limits his ability to get infield flies, the dynamic changeup more than compensates for his lack of size. Of the top 15 pitchers, only Darvish and Liriano have higher whiff rates on swings at pitches out of the zone. Lincecum’s fastball velocity has steadily dropped from its high of 94.0 in 2008 to 90.2 in 2013. Since 2011, Lincecum has been throwing a slider more often, and while he has been prone to the longball, he still gets whiffs on a quarter of swings. While Lincecum is no longer the pitcher that won CY Young awards in 2008 and 2009, he is a very intriguing free agent, and at the least, it seems that he could be a dominant reliever.

13. Chris Sale 8.0. The lanky, or perhaps paper-thin lefthander has made a successful transition from the bullpen to the rotation. After experiencing a predictable velocity drop from the move, Sale has actually regained some of that velocity this year, as his fastball has jumped from 91.3 to 92.4. Since moving to the rotation, Sale has added a changeup to go along with his excellent slider. Sale’s herky-jerky sidearm delivery and late movement have helped him generate a 32% chase rate, 5th best among pitchers on this list. While concern’s about Sale’s elbow and durability are certain to persist, Sale is on pace for over 200 innings this year after throwing 192 last year.

14. Johan Santana 7.9. Shoulder troubles robbed Santana of some of his fastball velocity, and his average of 90.3 is the slowest among pitchers in the top 15. However, his changeup was devastating. In its heyday in 2007, Santana had a Zone-Whiff rate of 23.2%. While some of Santana’s best years were in the pre-Pitch f/x era, the Mets still got highlights such as a 36.0 chase rate in 2009, and the no-hitter in 2012. Santana’s changeup also had the effect of suppressing BABIP,  as noted by a .276 career mark. Of the top 15, only youngsters Harvey and Moore can top Santana’s 12.9 IFFB%.

15. Justin Verlander 7.9. It took Verlander a couple of years to fine-tune the curveball, but when he did, he started churning out elite swing-and-miss rates. Since 2012, Verlander has been utilizing the changeup more than the curveball, and it too has produced excellent whiff rates. The secondary offerings go along with an average fastball velocity of 94.8 that only the less battle-tested Stephen Strasburg, Matt Harvey, and Felipe Paulino can top. Since 2007, Verlander has thrown over a 100 more innings than Cole Hamels, the next closest person on this list.

Clearly, the list favors younger, less tested pitchers. But I don’t think there’s anything wrong with that. As pitchers age, their velocity declines, and while Felix Hernandez is a better pitcher throwing 92 then when he was a young flamethrower, he probably doesn’t create the same kind of excitement in fans or fear in hitters when he averaged 96 with his fastball.

I also made a list of the worst 15 starting pitchers by STUFF since 2007. I didn’t think it would be worth anyone’s while to go through the list, but suffice it to say that the worst three were Steve Trachsel, Sidney Ponson, and Livan Hernandez. Yeah, I’d say that sounds about right. Aaron Cook of the 1.9 K/9 in 2012 also made the list. The following table is a comparison of the best and worst 15 starting pitchers since 2007 by STUFF rating.

  BABIP        LOB% xFIP- ERA-
Best 15 0.284 75 85 82
Worst 15 0.304 74 107 112

So the best STUFF pitchers seem to have an ability to limit hits on balls in play and overachieve their peripheral stats, while the worst STUFF pitchers allow hits at slightly above the league average and underachieve their peripherals. Some of this is due to infield flies, which was a factor in the STUFF formula. The best 15 had an IFFB% of 11.0, while the worst 15 had an IFFB% of 7.4. But there are other factors involved. Tim Lincecum has a 7.4 IFFB% and a .296 BABIP while Nick Blackburn has a 8.6 IFFB% and a .309 BABIP while the BABIP of their respective teams since 2007 is .297 and .300. Both of these pitchers are well past the stabilization point for BABIP. So it seems that pitchers with dominant STUFF have some control over hits on balls in play outside of IFFB. Of course I cherrypicked an example, and I’m sure there are counterexamples, but the general idea seems good. Great STUFF can have an effect beyond generating swings and misses.


The Basic Fortune Index (Or bFI, If You Are So Inclined)¹

Note: I have no idea if I’m the first to do this, but quite frankly I don’t care.

Last Friday against the Rockies, Matt Wieters had a plate appearance that perfectly epitomized his 2013 season. Coming to the plate in the bottom of the 3rd, with the Orioles up 2-0, two outs in the inning, and the bases loaded, Wieters worked Juan Nicasio for an eight-pitch full count; on the ninth pitch of the at-bat, Wieters hit a perfect, textbook line drive…right to DJ LeMahieu at second, for the third out of the inning.

While watching this game with my father, I was forced to restrain him from destroying the flatscreen upon which this atrocity had been viewed. My level of outrage was not nearly at that of my progenitor’s, however, for I–being more statistically inclined than him–knew that Wieters had been rather unlucky on batted balls this season; after another lineout in Saturday’s game, and two more on Tuesday against the Diamondbacks², Wieters now has a .596 BABIP on line drives, “good” for 170th out of 183 qualified players. At this late in the season, a player’s numbers start to level off to what they’ll be at season’s end, and despite the reassurances of experts, Wieters has not ceased to be unlucky.

Which got me thinking…

Would there be a way to measure how lucky or unlucky a player has been as a whole? Not just for one individual stat, but for an entire stat line, over the course of a whole season? After exhaustive Google searches returned nothing, I decided to take matters into my own hands. Using my rudimentary statistical knowledge, and the findings of Mike Podhorzer–who created equations for xK% and xBB%–and Jeff Zimmerman–who devised an xBABIP equation–I created a basic equation to determine how lucky a player has been 0verall³. Because I have absolutely no idea how linear weights and all that shit works, I kept it simple:

bFI = 100*((xK%–K%) + (BB%–xBB%) + (BABIP–xBABIP))

I call it the Basic Fortune Index; I would’ve called it the Luck Index, but I didn’t want to confuse it with Leverage Index. Basically, I took the difference between each player’s xK% and K%, BB% and xBB%, and BABIP and xBABIP, added them together, and then multiplied it by 100 for shits and giggles. Since a lucky hitter would have a lower K% than expected (as opposed to a higher BB% and BABIP than expected), I took the difference from xK% to K%, instead of the other way around. A positive bFI would indicate a lucky player, and a  negative value would indicate an unlucky player. Also, due to time constraints, I was only able to compile stats for the AL.

On to the leaderboards⁴!

Player K% xK% kdiff BB% xBB% bbdiff BABIP xBABIP bdiff bFI
Joe Mauer 0.175 0.218 0.043 0.12 0.119 0.001 0.383 0.343 0.04 8.4
Miguel Cabrera 0.144 0.147 0.003 0.138 0.097 0.041 0.363 0.335 0.027 7.1
Billy Butler 0.145 0.18 0.035 0.129 0.116 0.013 0.323 0.304 0.019 6.7
David Ortiz 0.138 0.156 0.018 0.123 0.109 0.014 0.333 0.301 0.032 6.4
Josh Donaldson 0.168 0.2 0.032 0.109 0.109 0 0.33 0.319 0.012 4.4
Mike Trout 0.17 0.194 0.024 0.138 0.13 0.008 0.376 0.366 0.01 4.2
Jhonny Peralta 0.225 0.221 0.004 0.08 0.087 -0.007 0.379 0.339 0.04 3.7
Mike Napoli 0.337 0.336 0.001 0.109 0.119 -0.01 0.36 0.314 0.046 3.7
Evan Longoria 0.238 0.235 -0.003 0.108 0.111 -0.003 0.318 0.279 0.04 3.4
Torii Hunter 0.164 0.166 0.002 0.042 0.042 0 0.343 0.316 0.027 2.9
Dustin Pedroia 0.113 0.165 0.052 0.108 0.102 0.006 0.317 0.347 -0.03 2.8
Adrian Beltre 0.097 0.113 0.016 0.07 0.069 0.001 0.324 0.317 0.007 2.4
Carlos Santana 0.178 0.218 0.04 0.135 0.133 0.002 0.299 0.317 -0.018 2.4
Jose Bautista 0.16 0.2 0.04 0.129 0.131 -0.002 0.259 0.274 -0.015 2.3
Jacoby Ellsbury 0.145 0.149 0.004 0.077 0.088 -0.011 0.34 0.311 0.029 2.2
Jason Kipnis 0.215 0.23 0.015 0.115 0.13 -0.015 0.35 0.329 0.021 2.1
Victor Martinez 0.107 0.148 0.041 0.08 0.092 -0.012 0.298 0.306 -0.008 2.1
Daniel Nava 0.178 0.195 0.017 0.1 0.111 -0.011 0.342 0.327 0.015 2.1
Kendrys Morales 0.17 0.176 0.006 0.067 0.077 -0.01 0.325 0.3 0.025 2.1
Adam Lind 0.202 0.216 0.014 0.1 0.099 0.001 0.319 0.314 0.004 1.9
Desmond Jennings 0.202 0.218 0.016 0.091 0.099 -0.008 0.306 0.299 0.007 1.5
Chris Davis 0.292 0.277 -0.015 0.103 0.103 0 0.354 0.327 0.027 1.2
Lorenzo Cain 0.197 0.216 0.019 0.08 0.079 0.001 0.317 0.326 -0.008 1.2
Colby Rasmus 0.301 0.271 -0.03 0.08 0.099 -0.019 0.363 0.306 0.057 0.8
Prince Fielder 0.175 0.19 0.015 0.11 0.103 0.007 0.288 0.303 -0.015 0.7
Ben Zobrist 0.143 0.136 -0.007 0.103 0.094 0.009 0.302 0.298 0.003 0.5
Kyle Seager 0.165 0.19 0.025 0.088 0.104 -0.016 0.309 0.313 -0.004 0.5
Mitch Moreland 0.206 0.234 0.028 0.08 0.091 -0.011 0.265 0.279 -0.014 0.3
Robinson Cano 0.13 0.133 0.003 0.115 0.095 0.02 0.311 0.333 -0.022 0.1
Nick Markakis 0.099 0.124 0.025 0.079 0.075 -0.004 0.295 0.318 -0.022 -0.1
Alejandro De Aza 0.217 0.224 0.007 0.073 0.094 -0.021 0.33 0.317 0.013 -0.1
Jason Castro 0.261 0.258 0.003 0.098 0.103 -0.005 0.345 0.343 0.001 -0.1
Eric Hosmer 0.138 0.153 0.015 0.068 0.071 -0.003 0.32 0.333 -0.013 -0.1
Nelson Cruz 0.239 0.234 -0.005 0.077 0.089 -0.012 0.299 0.284 0.014 -0.3
Alex Gordon 0.207 0.217 0.01 0.08 0.098 -0.018 0.311 0.306 0.005 -0.3
Justin Morneau 0.179 0.193 0.014 0.066 0.07 -0.004 0.294 0.308 -0.013 -0.3
Brandon Moss 0.275 0.267 -0.008 0.09 0.087 0.003 0.29 0.289 0.001 -0.4
Adam Jones 0.185 0.177 -0.008 0.03 0.029 0.001 0.33 0.328 0.002 -0.5
Albert Pujols 0.124 0.159 0.035 0.09 0.089 0.001 0.258 0.288 -0.031 -0.5
Shane Victorino 0.114 0.141 0.027 0.052 0.068 -0.016 0.309 0.327 -0.018 -0.7
Chris Carter 0.368 0.355 -0.013 0.118 0.112 0.006 0.296 0.296 0 -0.7
Manny Machado 0.156 0.136 -0.02 0.039 0.056 -0.017 0.338 0.31 0.028 -0.9
James Loney 0.128 0.13 0.002 0.074 0.066 0.008 0.337 0.357 -0.019 -0.9
Ian Kinsler 0.093 0.132 0.039 0.088 0.109 -0.021 0.271 0.301 -0.03 -1.2
Mark Reynolds 0.317 0.32 0.003 0.11 0.107 0.003 0.288 0.306 -0.018 -1.2
Vernon Wells 0.163 0.148 -0.015 0.062 0.047 0.015 0.266 0.28 -0.013 -1.3
Howie Kendrick 0.171 0.171 0 0.051 0.051 0 0.344 0.357 -0.013 -1.3
Edwin Encarnacion 0.098 0.142 0.044 0.122 0.117 0.005 0.255 0.317 -0.063 -1.4
Erick Aybar 0.088 0.103 0.015 0.043 0.44 -0.001 0.299 0.328 -0.029 -1.5
Brett Gardner 0.201 0.202 0.001 0.083 0.097 -0.014 0.333 0.336 -0.002 -1.5
Nick Swisher 0.218 0.23 0.012 0.121 0.118 0.003 0.292 0.322 -0.03 -1.5
Michael Bourn 0.228 0.216 -0.012 0.063 0.073 -0.01 0.344 0.338 0.006 -1.6
Mark Trumbo 0.26 0.254 -0.006 0.083 0.07 0.013 0.274 0.298 -0.024 -1.7
Austin Jackson 0.21 0.208 -0.002 0.095 0.083 0.012 0.32 0.35 -0.03 -2
Salvador Perez 0.12 0.093 -0.027 0.042 0.038 -0.004 0.299 0.29 0.01 -2.1
Alexei Ramirez 0.1 0.071 -0.029 0.03 0.008 0.022 0.314 0.328 -0.014 -2.1
Jed Lowrie 0.136 0.106 -0.03 0.083 0.081 0.002 0.315 0.308 0.007 -2.1
Nate McLouth 0.14 0.147 0.007 0.088 0.084 0.004 0.305 0.338 -0.033 -2.2
Coco Crisp 0.114 0.148 0.034 0.109 0.11 -0.001 0.256 0.312 -0.056 -2.3
Alex Rios 0.167 0.151 -0.016 0.066 0.07 -0.004 0.315 0.318 -0.003 -2.3
Ryan Doumit 0.168 0.19 0.022 0.084 0.094 -0.01 0.272 0.308 -0.036 -2.4
Yunel Escobar 0.124 0.125 0.001 0.086 0.092 -0.006 0.286 0.308 -0.022 -2.7
Drew Stubbs 0.29 0.257 -0.033 0.072 0.068 0.004 0.333 0.333 0 -2.9
Yoenis Cespedes 0.233 0.23 -0.003 0.076 0.079 -0.003 0.256 0.283 -0.027 -3.3
Mike Moustakas 0.137 0.14 0.003 0.066 0.086 -0.02 0.251 0.268 -0.018 -3.5
Jose Altuve 0.133 0.107 -0.026 0.055 0.041 0.014 0.311 0.335 -0.024 -3.6
Brian Dozier 0.188 0.212 0.024 0.081 0.094 -0.013 0.278 0.327 -0.049 -3.8
Lyle Overbay 0.222 0.207 -0.015 0.068 0.076 -0.008 0.303 0.318 -0.015 -3.8
Adam Dunn 0.285 0.286 0.001 0.132 0.145 -0.013 0.283 0.31 -0.027 -3.9
Matt Wieters 0.172 0.175 0.003 0.081 0.088 -0.007 0.244 0.28 -0.036 -4
Michael Brantley 0.108 0.094 -0.014 0.073 0.076 -0.003 0.3 0.323 -0.023 -4
Elvis Andrus 0.143 0.155 0.012 0.081 0.098 -0.017 0.301 0.343 -0.041 -4.6
Paul Konerko 0.146 0.158 0.012 0.078 0.071 0.007 0.26 0.326 -0.066 -4.7
J.J. Hardy 0.118 0.124 0.006 0.057 0.07 -0.013 0.253 0.296 -0.043 -5
Matt Dominguez 0.164 0.162 -0.002 0.038 0.056 -0.018 0.248 0.283 -0.035 -5.5
Josh Hamilton 0.246 0.24 -0.004 0.067 0.067 0 0.264 0.317 -0.052 -5.6
Alcides Escobar 0.126 0.118 -0.008 0.032 0.025 0.007 0.271 0.325 -0.055 -5.6
Alberto Callaspo 0.106 0.159 0.053 0.072 0.119 -0.047 0.256 0.319 -0.064 -5.8
Asdrubal Cabrera 0.22 0.211 -0.009 0.06 0.075 -0.015 0.288 0.323 -0.035 -5.9
Ichiro Suzuki 0.097 0.108 0.011 0.045 0.047 -0.002 0.292 0.364 -0.072 -6.3
Maicer Izturis 0.094 0.097 0.003 0.069 0.066 0.003 0.248 0.326 -0.078 -7.2
Raul Ibanez 0.256 0.249 -0.007 0.069 0.084 -0.015 0.278 0.33 -0.052 -7.4
David Murphy 0.117 0.128 -0.011 0.076 0.083 -0.007 0.228 0.288 -0.061 -7.9
Jeff Keppinger 0.088 0.07 -0.018 0.039 0.049 -0.01 0.263 0.33 -0.067 -9.5
J.P. Arencibia 0.295 0.255 -0.04 0.04 0.06 -0.02 0.253 0.324 -0.071 -13.1

Wieters ended up 70th out of the 85 players, as his xBABIP wasn’t as high as I thought it would’ve been.

After compiling this table, I noticed a trend (one that has been noticed by others before me): the “lucky” players were mainly good players, whereas the “unlucky” players were mainly bad offensive players. I then matched each player’s wRC+ up with their bFI, and made a table of the result⁵:

Player bFI wRC+ Player bFI wRC+ Player bFI wRC+
Joe Mauer 8.4 143 Nick Markakis -0.1 91 Coco Crisp -2.3 96
Miguel Cabrera 7.1 207 Alejandro De Aza -0.1 104 Alex Rios -2.3 99
Billy Butler 6.7 124 Jason Castro -0.1 120 Ryan Doumit -2.4 91
David Ortiz 6.4 160 Eric Hosmer -0.1 114 Yunel Escobar -2.7 101
Josh Donaldson 4.4 139 Nelson Cruz -0.3 123 Drew Stubbs -2.9 87
Mike Trout 4.2 179 Alex Gordon -0.3 99 Yoenis Cespedes -3.3 98
Jhonny Peralta 3.7 125 Justin Morneau -0.3 101 Mike Moustakas -3.5 80
Mike Napoli 3.7 109 Brandon Moss -0.4 115 Jose Altuve -3.6 83
Evan Longoria 3.4 138 Adam Jones -0.5 125 Brian Dozier -3.8 100
Torii Hunter 2.9 118 Albert Pujols -0.5 111 Lyle Overbay -3.8 98
Dustin Pedroia 2.8 110 Shane Victorino -0.7 102 Adam Dunn -3.9 121
Adrian Beltre 2.4 142 Chris Carter -0.7 108 Matt Wieters -4 91
Carlos Santana 2.4 127 Manny Machado -0.9 110 Michael Brantley -4 106
Jose Bautista 2.3 133 James Loney -0.9 124 Elvis Andrus -4.6 69
Jacoby Ellsbury 2.2 110 Ian Kinsler -1.2 101 Paul Konerko -4.7 77
Jason Kipnis 2.1 137 Mark Reynolds -1.2 96 J.J. Hardy -5 99
Victor Martinez 2.1 101 Vernon Wells -1.3 79 Matt Dominguez -5.5 80
Daniel Nava 2.1 123 Howie Kendrick -1.3 116 Josh Hamilton -5.6 93
Kendrys Morales 2.1 124 Edwin Encarnacion -1.4 145 Alcides Escobar -5.6 54
Adam Lind 1.9 124 Erick Aybar -1.5 94 Alberto Callaspo -5.8 94
Desmond Jennings 1.5 110 Brett Gardner -1.5 104 Asdrubal Cabrera -5.9 91
Chris Davis 1.2 183 Nick Swisher -1.5 111 Ichiro Suzuki -6.3 78
Lorenzo Cain 1.2 88 Michael Bourn -1.6 90 Maicer Izturis -7.2 63
Colby Rasmus 0.8 122 Mark Trumbo -1.7 114 Raul Ibanez -7.4 122
Prince Fielder 0.7 115 Austin Jackson -2 103 David Murphy -7.9 75
Ben Zobrist 0.5 113 Salvador Perez -2.1 85 Jeff Keppinger -9.5 51
Kyle Seager 0.5 128 Alexei Ramirez -2.1 84 J.P. Arencibia -13.1 70
Mitch Moreland 0.3 99 Jed Lowrie -2.1 112
Robinson Cano 0.1 136 Nate McLouth -2.2 105

Apparently, the correlation was not as strong as  I had initially hoped (thanks, Dunn and Ibanez!), as the .53746 R Squared implies.

In the end, it’s probably not a very good statistic–more of a Pseudometric–which, to be fair, is why I named it the Basic Fortune Index. Like most everything I post here, there really wasn’t a point to this whole thing. In addition, it’s fairly likely that, if this is actually published, someone will be so kind as to inform me that there is already a better stat out there for determining the luck of a hitter, and that–despite the disclaimer–I should care about this. If, however, this is an original idea, I invite those more statistically knowledgeable than myself to expound upon it (assuming, of course, I receive all the credit).

———————————————————————————————————————————-

¹How should that be capitalized?

²I refuse to use their nickname, and usage of it by anyone else should be considered cause for legal euthanasia.

³I wanted to use HR/FB%, but since Parts 6 and 7 of this series were never released, I was forced to go without.

⁴All stats are as of Tuesday, August 20th.

⁵I tried to put in the graph, but couldn’t figure out how.