Archive for Player Analysis

Playing Probability: Drew Pomeranz and Anderson Espinoza

The Drew Pomeranz-Anderson Espinoza trade has plenty of unknowns. With Pomeranz in the midst of a breakout season and blowing by his previous innings totals and Espinoza at the age when you normally would be graduating high school it is hard to know what to expect. Will Pomeranz continue to dominate or will he return to his previous self where he was either injured or mediocre? Will Espinoza blossom into the pitcher everyone sees when they watch his stuff, or will he fail to get his command under control and turn into the pitcher that his 4+ ERA in Single-A might seem to predict? To evaluate a trade like this you would have to do a lot of guesswork on the futures of these players. So instead of digging into the details it can be best to zoom out, and play the probabilities.

Predicting the futures of prospects is one of the most difficult tasks. Not only do you have to deal with the small samples of short minor-league seasons, but you have to project how those statistics will translate one, two or even three levels above their current competition. Additionally, you have to predict how the player will grow and mature as he enters his prime years. While some try to discover the answers to this question on an individual scale, it can be more effective to embrace the randomness present in each individual human being and create an average performance level for similar groups of players. To do this I tried to think of ways to quantify what makes Espinoza such a noteworthy prospect.

First, I thought that maybe the combination of age and strikeout rate that Espinoza has produced at Single-A Greenville this year might stand out and place him in a small group of notable players. A quick look at even his same team however seemed to prove this hypothesis wrong, as his teammate Roniel Raudes has almost identical statistics to Espinoza this year and is the same age. Raudes however is ranked 24th in Baseball America’s Red Sox preseason rankings, demonstrating that Espinoza’s stats this year are not anything incredibly special by themselves, even when accounting for age.

Next I examined how starters who have debuted for at least 50 innings in a year by age 21 have fared in the major leagues, since Espinoza is predicted to arrive in either his age 20 or 21 season. There are 44 pitchers that meet these qualifications and debuted between 1990 and 2005, some of which are big names (such as Hernandez, Sabathia, Greinke and Kerry Wood) while others not so much. In the time before they were scheduled to reach free agency, these players accumulated on average a total of roughly 8.2 wins above replacement of production over that span. There are some problems with this calculation, however. For one, almost a third of starters debut by age 21, so it is not terribly extraordinary. For every Felix Hernandez in this group there in a Rich Hunter who had one good minor-league season, which prompted a promotion to the big leagues. In his case, his career lasted only that one season. There are also pitchers such as Bud Smith in this group who were once top prospects but faltered in the big leagues. In his case he was once ranked first in the Cardinals’ system, a spot ahead of Albert Pujols, which can work as a friendly reminder that not all big name prospects pan out.

Another way of looking at Espinoza’s value is just to take his prospect ranking for what it is. Kevin Creagh and Steve DiMiceli have done research to try to put a trade value on prospects using Baseball America’s prospect rankings. The following table outlines their findings.

Tier Number of Players Avg. WAR Surplus Value
Pitchers #1-10 22 14.6 $69.9M
Pitchers #11-25 43 8.3 $39.0M
Pitchers #26-50 85 6.4 $29.8M
Pitchers #51-75 104 3.7 $16.5M
Pitchers #76-100 113 3.5 $15.6M


Analyzing data on Baseball America lists from 1994 to 2005, the two men created this table to calculate the average surplus value of players from each tier of the rankings. (Their process is fairly complicated, so it is worth it to take a look at their process here in an earlier version of the study). This can be a very simple yet effective way to evaluate prospects based on both their stats and scouting report (since both are used to create the rankings) while also eliminating as many individual biases as possible (of course the prospect rankings are subject to those same problems).

In Espinoza’s case, he was just recently ranked 15th on the Baseball America midseason top-100, a five-spot jump from his preseason rank (though six players ahead of him have now graduated to the big leagues). This ranking puts him in the second tier of pitchers on the BA rankings and in line to have an average surplus value of 39 million dollars with a projection of 8.3 wins. This is almost exactly the 8.2 wins calculated earlier, though found through a very different method. While these rankings are in no way perfect, it is about as close as you can get to putting a concrete value on Espinoza’s skills (especially since both methods seem to agree), so we will use the $39 million value as a benchmark to compare with Pomeranz.

Moving on to Pomeranz, it is important to find a way to factor in all the different scenarios. You might have multiple ideas about how to take into consideration both this year’s statistics and those of the past, to try to come up with some sort of middle ground. While this is the right idea, this method is going to rely on assumptions that are unlikely to be made completely accurately. Instead we can use projection systems are much better at doing these calculations for us. For Pomeranz, this is the best way to include all the information about the many aspects of his performance and boil it down to one number.

Based on the depth chart projection on FanGraphs (the average between ZiPS and Steamer weighted for projected playing time), Pomeranz is projected to be worth about 1.3 wins the rest of the way. This is considerably worse than he has been so far this year, though much better on a per-inning basis than previous years, and still a valuable player. Using this projection, you can also project out the final two years of his contract assuming that he will continue pitching up to the same standard, by just doing a little math.

With roughly 46% of the season remaining at the All-Star break, you can use his rest-of-season projection to estimate his value over a full season, which ends up being 2.8 wins. First, though, you must use the same process as in the prospect ranking analysis to discount future performance since production today is considered more valuable than years down the line. Multiplying the value of each subsequent season by 0.92 you can account for the future discount rate of 8% (used in the prospect evaluation). Performing this adjustment results in 2017 and 2018 being valued at 2.6 and 2.4 wins respectively for a total of 6.3 wins over the three years with the Red Sox. At eight million dollars per win this totals to be around $50.4 million worth of production.

Finally, we must account for surplus value by subtracting how much Pomeranz is projected to make in arbitration. This year he is only making $1.35 million, but that should see a substantial increase after an All-Star season. I have little experience projecting arbitration but it seems reasonable that he would see his contract jump up to around $6 million in 2017 and see a more modest improvement up to around $10 million after a decent but somewhat less valuable season.  These estimates would total to around $17 million going to Pomeranz from the Red Sox in the three years, and subtracting this from the $50.4 million, you end up with around $33 million in surplus value.

In the end these surplus values are very similar. Espinoza’s value comes in a little higher at $39 million compared to Pomeranz at $33 million, but the $6 million gap is nothing the Red Sox would have to lose sleep over. In reality though that gap is just the gap in average outcomes for both players and it is more likely to be much more lopsided toward one side or the other. While this seems to show that the Padres are getting a slightly better deal, you can easily rationalize this trade for the Red Sox by saying that wins today matter more now for the Red Sox than for the average team since they are in the midst of a tight wild card and division race where they are favored over the division leader in the playoff odds on both FanGraphs and Baseball Prospectus. That way of looking at it does make it much more appealing for Boston. It was a trade that they had to make given their situation. Not a great trade, not a bad trade, but an adequate trade that could turn out either way.

The real takeaway from all this however is on San Diego’s side of the deal. For them it wasn’t just an adequate deal, and it wasn’t even just a good deal. It was a great deal! For them, the pushing of wins down the road is a net gain for them as opposed to a net loss as it is for the Red Sox. They pushed Pomeranz’s average outcome of 6.3 wins (which was being wasted on an noncompetitive team) down the road to a time when they may be competitive and wins will matter much more. Not only that, but they also increased the projected output to 8.3 wins. While it is possible that Espinoza could flop and be a major bust, that is all part of the math that works in the Padres’ favor. For every underwhelming Espinoza, there is a great Espinoza; one that was acquired in exchange for a player that had little value to the club at this point in time and someone the team will get to watch for years to come.


Why Dylan Bundy Will Succeed as a Starter

(Originally written before last Sunday)

It was announced that Orioles pitcher Dylan Bundy will start this Sunday on the road against the Rays. The move makes sense — the Orioles need good starting pitching and Bundy could become a good starter. I think Bundy will do very well as a starter, and in this article I’ll talk about why.

Dylan Bundy’s career started with incredible promise. Drafted fourth overall, his first eight starts in the minors were punctuated by a 0.00 ERA and a 20/1 K/BB ratio. By the end of the year, he was considered the top prospect in all of baseball. The next few years were rife with injuries — first Tommy John surgery in 2013, followed by complications in his shoulder which caused him to miss almost the entire year in 2014. Bundy hasn’t looked like the same pitcher since. His fastball velocity this season started at 92 MPH, much lower than the high 90s we saw in the minors. But since the beginning of June, Bundy has made a remarkable turnaround. Since June 9, the numbers are beyond outstanding, with 14.1 IP, 19 SO, only 4 BBs, and 0 earned runs. But the peripheral stats are even better.

I am currently in the process of writing an article about how I think the most important skill of a starting pitcher is getting to two strikes quickly. Since June 9, Bundy has done this better than any pitcher in baseball. In the top 10: Clayton Kershaw, Max Scherzer, and Stephen Strasburg, arguably three of the best pitchers in baseball. This obviously is not to say that Bundy is one of the best pitchers in baseball; his track record is far, far too short to proclaim that. But it bodes well for Bundy that over the past month he is controlling the ball as well as baseball’s top pitchers.

Bundy’s fastball velocity is also encouraging. Bundy throws a rising four-seam fastball, which bodes well for his ability to miss bats. But at the low 90s, he wasn’t able to generate a lot of swings and misses, and as a fly-ball pitcher was susceptible to home runs. Last appearance, Bundy threw his fastball harder than he’s ever thrown it.

12917_P_FA_20160706

The chart may not look like much, but there’s a clear trend here: Up. His fastball velocity has increased over 4 MPH since the beginning of the season, which is a gigantic leap.

The Orioles desperately need starting pitching, and Bundy could be that answer. The Orioles do not have the worst starting pitching in the league. In terms of WAR, that is currently the Reds. But the Orioles’ staff is really bad, even if they look worse pitching in a hitter’s park. Chris Tillman is their only competent starter, while the rest of their rotation contain some of the worst pitchers in the league. So stretching Bundy into a starter seems appealing.

There is a risk that Bundy will be much worse as a starter. Pitchers are notorious for throwing harder in the bullpen than they would as a starter, and given that the majority of Bundy’s success has come at a higher velocity, it would be reasonable to assume Bundy will not be nearly as effective as a starter as he is as a long reliever. I think this is correct thinking; we should not expect Bundy to start and still average 11 K/9. But his numbers as a reliever have been elite, so there is a lot of room for Bundy to come down and still be a quality starting pitcher. Starting pitcher is where Bundy has the most upside, and the sooner he gains experience, the sooner we can expect him to improve.

Bundy will probably do well this Sunday, especially against a Rays team that strikes out the second-most in the league. Don’t think this is a mirage. Bundy has the stuff and command to succeed, and I think we will see that as a starter.


The WIS Corollary

Interestingly enough, one of the major postwar genres of Anglo-American literature was the academic comedy. Popularized in large part by Philip Larkin and the “Movement,” authors strove to poke fun at academic institutions and the conventions followed by the terrifically aloof professors. The most famous novel to fall into this genre is Lucky Jim by Kingsley Amis. The book features Jim Dixon, a poverty-stricken pseudo-pedant with a probationary position in the history department of a provincial university. A veritable alcoholic, Dixon attempts to solidify his position by penning a hopelessly yawn-inducing piece entitled “The Economic Influence of the Developments in Shipbuilding Techniques, 1450 to 1485.” Short novel made shorter, it doesn’t help him retain his position, but it does succeed in illustrating the banal formalities that academic writing necessitates.

In sabermetrics, there is a heavy reliance on sometimes inscrutable jargon, acronyms that sound like baby words (“FIP!”), and Mike Trout’s historical comps (Chappie Snodgrass is not a very good one in case anyone is wondering) that quite understandably renders the average fan mildly frustrated and the average fan over sixty wondering how we will ever make baseball great again. Typically, I enjoy those articles very much because they communicate news efficiently and analytically. Occasionally, however, articles stray into the Jim Dixon range of absolute obscurity, examining the baseball equivalent of “Shipbuilding Techniques,” whatever that may be. Such writings form the cornerstone of sabermetrics as they mesh history, theory, and sometimes economics.

Fortunately or unfortunately, my article today isn’t quite Dixon-esque, but it retains some of that style’s more tedious elements. It falls more closely into the category of two-minute ESPN quick sabermetric theory update. I don’t think that’s a thing. Seemingly pointless introduction aside, please consider what you know about DIPS theory. I won’t insult your intelligence, but it was developed by Voros McCracken at the turn of the millennium and has served as one of the principal tenets of the pitching side of sabermetrics ever since then. The theory, in its most atomic form, essentially posits that pitchers should be evaluated independently of defense because it’s something they cannot control. Hence “defense-independent pitching statistics.”

Certainly, it was a revolutionary concept and one that has even gained quite a bit of traction in the mainstream sports media. Announcers talk about how a certain pitcher would look a lot better pitching in front of, say, the Giants instead of the Twins. Metrics like xFIP only serve to quantify that idea.

But every grand theory or doctrine (DIPS is essentially sabermetric doctrine at this point) requires a corollary to frame it. And so I propose something I like to call the “WIS Corollary to DIPS,” where WIS stands for Weather Independent Statistics. The natural extension of evaluating pitcher performance independently of defense is to evaluate players independently of weather because it also exists outside of player control.

The basic idea of this is that weather plays enough of a role in enough games to superficially alter the statistics of players such that they cannot be accurately and precisely compared with the other players in the league because all of them face different environmental conditions. Taking that into consideration, all efforts must be made to strip out the effects of weather when making serious player comparisons. Coors Field is why Colorado performances are regarded with such skepticism, while the nature of San Francisco weather and AT&T Park is supposedly why that location serves as an apt environment for the development of pitchers.

Think about it — it’s something we already do. We look at home/road splits, we evaluate park factors, we try and put players on +/- scales. We talk about this constantly even at youth games. I have heard parents say many times, “If only the wind hadn’t been blowing in so hard he might have hit the fence.” It’s honestly a commonly held, yet generally unquantified, notion that the general public has.

Player X hits a blooper at Stadium C that falls in front of the left fielder for a hit. Player Y hits a blooper at Stadium D with the exact same exit velocity and launch angle as Player X’s ball, but it carries into the glove of an expectant left fielder. Should Player X really get credit for a hit and Player Y for an out? Basically all statistics, striving to communicate objective information, would say yes. If this kind of thing happens enough times over the course of a season, it can make a significant difference. A couple of fly balls that leave the park instead of being caught at the fence would put a dent in a pitcher’s ERA, while changing a player’s wRC+ by no small sum.

For that reason, players should be measured as if they play in a vacuum. One of the biggest goals of sabermetrics is to isolate player performance in order to evaluate him independently of variables he cannot necessarily control. Certainly, this has some far-reaching consequences if the idea gets carried out to its natural conclusion. Someone would likely end up developing a model that standardized stadium size, defensive alignment for varied player types, and other things of that nature. I’m not necessarily advocating for that, just for stripping out the effects of weather.

WIS by itself isn’t radical, but the extent to which it’s applied could be considered as such. As of now, it’s something consciously applied a relatively small portion of the time, but I think that it’s something that should be considered as much as possible. Obviously, there are issues with this. You can’t very well modify “raw” statistics like batting average or ERA so that they reflect play in a vacuum. What you could conceivably do is create a rather complicated model that requires a complicated explanation in order to describe how the players should have performed. And that’s something which brings us to an important point; the metrics that would employ this information would not be for the average fan; rather, they would be aimed at the serious analyst.

This is something I’ve already tried to employ with a metric I created called xHR, which uses the launch angle and exit velocity of batted balls to retroactively predict the number of home runs a player should have hit. The metric is still in development, but I think it’s something that works relatively well and can be applied to other types of metrics. For instance, an incredibly complex and comprehensive expected batting average could utilize Statcast information to determine whether a given fly ball would have been a hit in a vacuum based on fielder routes and the physics of the hit. By no means am I trying to assert that I have all, if any, of the answers. The only thing I’m trying to do here is to bring debate to a small corner of the internet regarding the proper way to evaluate baseball players.

Probably the most crucial thing to understand here is that the point of sabermetrics is to accurately and precisely evaluate players in the best possible way. Sabermetricians already do an incredible job of doing just that, but perhaps it’s time to take things a step further in the evaluation process by developing metrics that put performances in a vacuum. I know that baseball doesn’t happen in a void, but the best possible way to compare players is to measure them* as if they do.

WIS Corollary — One must strip out the effects of weather on players in order to have the most accurate and precise comparison between them.

*Oftentimes it’s necessary to compare players while including uncontrollable factors, like sequencing, especially when doing historical comparisons. It’s important to note that the WIS Corollary is applicable only in very specialized situations, and would generally go unused.


David Price Is About to Go Off

View post on imgur.com

On June 25, this was David Price’s tweet to family, friends and fans.  It was a clear signal that he knew the patience of the Boston fans and media was wearing thin.

Fast forward to the All-Star break and his “Made for TV” stats (those that casual fans know best) are underwhelming: a 9-6 record with a 4.34 ERA, which is worse than the MLB average of 4.23.  It’s not so much his ERA that’s the problem to fans, but more his inability to be consistent from start to start.  Price has three starts of six-plus innings allowing two or fewer runs, but also has four starts of allowing six or more runs.  With the rest of the rotation producing an atrocious 4.86 ERA, the Sox desperately needed Price to be the one to stop the bleeding, something he hasn’t been able to do.  But that doesn’t mean his underlying skills have deteriorated and all of a sudden he’s become a league-average pitcher.  In fact, the advanced metrics say he’s been extremely unlucky and that he’s due for a big second half. 

View post on imgur.com

* Rank is solely being used to establish a baseline for Price as a top 10 pitcher.

In 2014 and 2015 combined, Price was ranked in the top 10 of all pitchers in four of the skill-based statistics: K%, BB%, xFIP and SIERA (the latter two being ERA estimators with a weighting towards more pitcher-controlled outcomes).  Through the 2016 All-Star break, Price has maintained or improved his top-10 rank in K%, xFIP and SIERA but dropped a few spots in walk rate.  Despite the move from 9th to 10th in K% rank, his K rate is actually up from 26.2% to 27.1%.  The reason for the drop in rank is that 2016 newcomers to the list Jose Fernandez, Noah Syndergaard and Drew Pomeranz did not meet the minimum innings qualifier for the 2014/2015 combined list.  On the flip side, Price’s xFIP and SIERA are higher than they were the past two years, but he has improved his ranking versus his peers.  This is because xFIPs and SIERAs are both up 10% league-wide versus last year (due to all the home runs being hit) while Price’s increases are smaller.

So what is happening?  If his base skills are fine, why is his ERA so high and his performance so inconsistent?

View post on imgur.com

So everyone is familiar with ERA and can easily infer that 4.34 is no bueno for a $217-million pitcher.  But there is a reason these stats are labeled “Non Skill-Based” — that’s because these stats are influenced by factors outside of the pitcher’s direct control (defense, luck, sequencing, variance, etc…) and therefore have wide variability over small samples.  Three of these stats (HR/FB%, BABIP and LOB%) explain why David Price is a great rebound candidate for the second half.

HR/FB%

Price’s current HR/FB (home runs per fly ball) rate is 15.2% — which is good for being ranked 76th out of 97 qualified starting pitchers.  The past two years combined he ranked 19th.  To put this in context, Price’s career average is 9.4% while the 2016 league average is 12.9%.  Price has never recorded a full season (>150 IP) HR/FB rate higher than 10.5%.  Also, on balls hit into play against Price this year, 31.3% of them are fly balls, the second-lowest rate of his career.  The only season in which he allowed a lower fly ball rate was in 2012 when he won the AL Cy Young award.  Price is giving up fewer fly balls this year, but of the fly balls he is allowing, they are going over the fence at the highest rate of his career.  Those that remember Price giving up a HR in 10 consecutive starts this year are nodding violently right now.  His HR/FB% will regress towards his career norm (9.4%) and this should be the main reason for a big second half.

BABIP

Price is also suffering from an unsustainable BABIP (batting average on balls in play).  His current mark of .321 is well above his career rate (.289) and even above his highest full-season rate (.306).  Once a ball is put into play it is out of the pitcher’s control what happens from there.  This is why defense and luck influence this stat more than skill.  And with that said, statistical outliers here tend to regress towards career norms.  Even though Price is allowing ground balls at a higher rate than the past two years, his 2016 GB% is still lower than his career average.  BABIP can be influenced by the number of ground balls a pitcher allows, but he’s not allowing vastly more than his career average.  His BABIP should have some positive regression in it, which is another predictor of improved second-half performance.

LOB%

Price’s Left-On-Base% (percentage of runners a pitcher strands over the course of a season) is currently 70.9%, which is also below his career rate (74.7%) and would be his second worst full-season rate (70.0%) if the season ended today.  Similar to HR/FB%, he is ranked 73rd out of 97 qualified starting pitchers.  The past two years he ranked 22nd.  A pitcher with a higher than average strikeout rate should be able to sustain a slightly higher than average LOB%, but it’s playing out the exact opposite way for Price.  This is partly due to his inflated BABIP and HR/FB%; as these statistics continue to regress towards his career norms, the LOB% will creep up to expected levels.


Much has been made of Price’s velocity being down this year compared to any point in his career.  At the start of the season, his velocity was over 2.0 MPH lower than his career average (94.1).  He has since closed this gap almost entirely.  Here is his average fastball velocity by month (with number of starts):

April: 92.0 (5)

May: 92.5 (6)

June: 92.9 (6)

July: 94.0 (2)

If this upward trend in velocity stabilizes somewhere at or above 93.5, then nearly all the performance metrics within his control — velocity, K%, BB%, xFIP and SIERA — will be at or near his career norms.

Let’s dive a little deeper into that early-season velocity issue.  Below are two charts.  The first shows combined performance of 2014 and 2015 for ERA-qualifying starters while the second chart is the same data for the 2016 season through the All-Star break.  The orange circle is David Price.  The red circle (if shown) represents Price’s career average.  The blue circles are a hand selected peer group of the top 10 pitchers in the game (Kershaw, Sale, Arrieta, Scherzer, Bumgarner, Greinke, Strasburg, Syndergaard, Salazar and Fernandez).  Remember those rankings where Price was right around the top 10 — these are the guys usually outperforming him.  The gray circles represent everyone else.  Note: For these first two charts the top-right quadrant is Good, and the bottom-left quadrant is Bad (unless you’re a knuckleballer).

2014-2015 K/9 vs FBv

View post on imgur.com


2016 K/9 vs FBv

View post on imgur.com

The first graph shows David Price clustered where you would expect him — right at the middle-to-bottom of his top-10 peer group, with a healthy average fastball velocity and K/9.  The second graph (2016) shows Price in a similar relationship to his peers, but with slightly lower velocity and a higher K/9.  Note the gap between the orange (Price’s 2016) and red (Price’s career average) dots depicting his improved strikeout numbers this year despite the slightly lower velocity.  This graph also shows what freaks Noah Syndergaard, Jose Fernandez and (to a lesser degree) Jered Weaver are.

The final two graphs show the relationship between ERA and xFIP where xFIP is the more predictive estimator of a pitcher’s skill.  The bottom-left quadrant is Good (think Kershaw) and the upper-right quadrant is Bad (think Buchholz).  Anyone in the upper-left quadrant (Price in 2016) is a candidate for positive regression.

2014-2015 ERA vs xFIP

View post on imgur.com


2016 ERA vs xFIP

View post on imgur.com

The first graph again shows Price in his usual place — at the tail end of the top 10.  In 2014 and 2015 combined he had a very similar ERA (2.88) and xFIP (2.98).  The second graph (2016) shows the disparity between his ERA (4.34) and xFIP (3.16).  Pitchers with this large of a gap between ERA and xFIP are great candidates for regression.  The important takeaway is that his xFIP, relative to his peers, has stayed in that top-10 range.  This supports the point that some bad luck is the main element depressing his ERA.

David Price can easily be the best pitcher in the American League over the next two and a half months.  He already owns the lowest xFIP in the AL at 3.16 — the next-closest is Corey Kluber, at 3.34.  The skills above show he can sustain the xFIP level, but with some change in luck and maintaining his improved velocity, he doesn’t need to “pitch better”; he just needs to keep pitching — and the results will follow.


Masahiro Tanaka and Homers and Strikeouts

The Yankees have been a beacon of mediocrity this year, currently sitting under .500 and in fourth place in the resurgent AL East. Pitching is often a soft spot for the Yankees, as Yankee Stadium routinely ranks in the top half of the league in terms of worst parks for pitchers, according to park factors on FanGraphs. The short porch in right field is especially troublesome for hurlers. For this reason, park factors on FanGraphs have listed Yankee Stadium (tied with others) as the easiest park for a lefty to hit a homer from 2013-2015. Thus, there are bound to be some interesting trends among their starters. One such starter is the always entertaining Masahiro Tanaka. Let’s explore!

Tanaka struggled mightily with the longball during his first two seasons with the Yankees, posting a 1.24 HR/9 ratio from 2014-2015, which would have been good (or bad) enough for the eighth-highest among starters, had he qualified. That includes a ridiculous 1.46 HR/9 from last year, which would have ranked sixth (a few spots behind teammate CC Sabathia, who ranked third with 1.51 HR/9). At the same time, that high HR/9 may have been because Tanaka was victimized by a 15.7% HR/FB ratio during those two seasons. Since Tanaka is a righty (opposing teams are more likely to play lefties against him) who pitches half of his games at Yankee Stadium (lefty heaven), his HR/FB ratio is bound to be high, but not that high. Thus, it’s understandable that his HR/FB ratio decreased to a more normal 9.5% this year. It will probably be higher than that in the future, but this is just the ebb and flow of things: sometimes stats are higher than they should be, and sometimes they are lower.

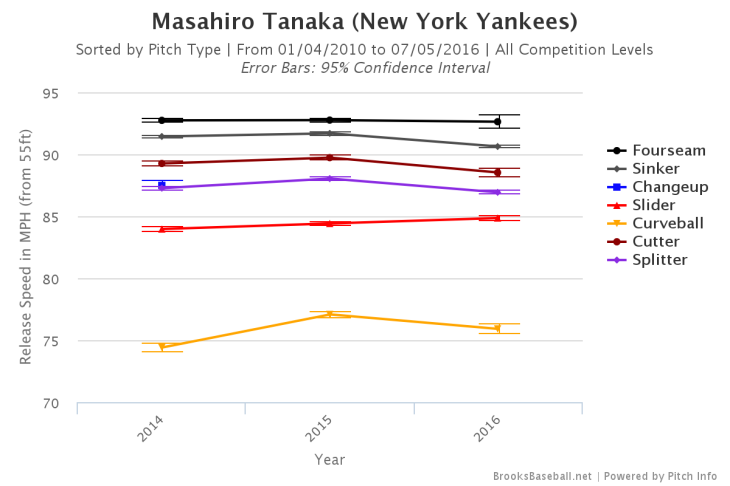
Tanaka actually allowed a palatable 0.99 HR/9 in his first season with the Yanks, despite a 14.0% HR/FB ratio. His groundball rate remained virtually the same from that first season to the second, but one thing that made his home-run total lower in his first season as opposed to the second (other than a slight uptick in HR/FB) was a 9.3 K/9. When you allow fewer balls in play, you will allow fewer homers. However, in Tanaka’s second season, that number sunk to 8.1 K/9, a substantial drop. It has dropped even further this season, considerably below league average now at 7.1 K/9. What has brought about this dip in Ks? Changes in velocity often coincide with changes in K-rate:

Year Fourseam Sinker Change Slider Curve Cutter Split
2014 92.74 91.44 87.49 83.97 74.41 89.26 87.27
2015 92.76 91.69 0.00 84.42 77.08 89.73 88.04
2016 92.63 90.63 0.00 84.86 75.91 88.53 86.93

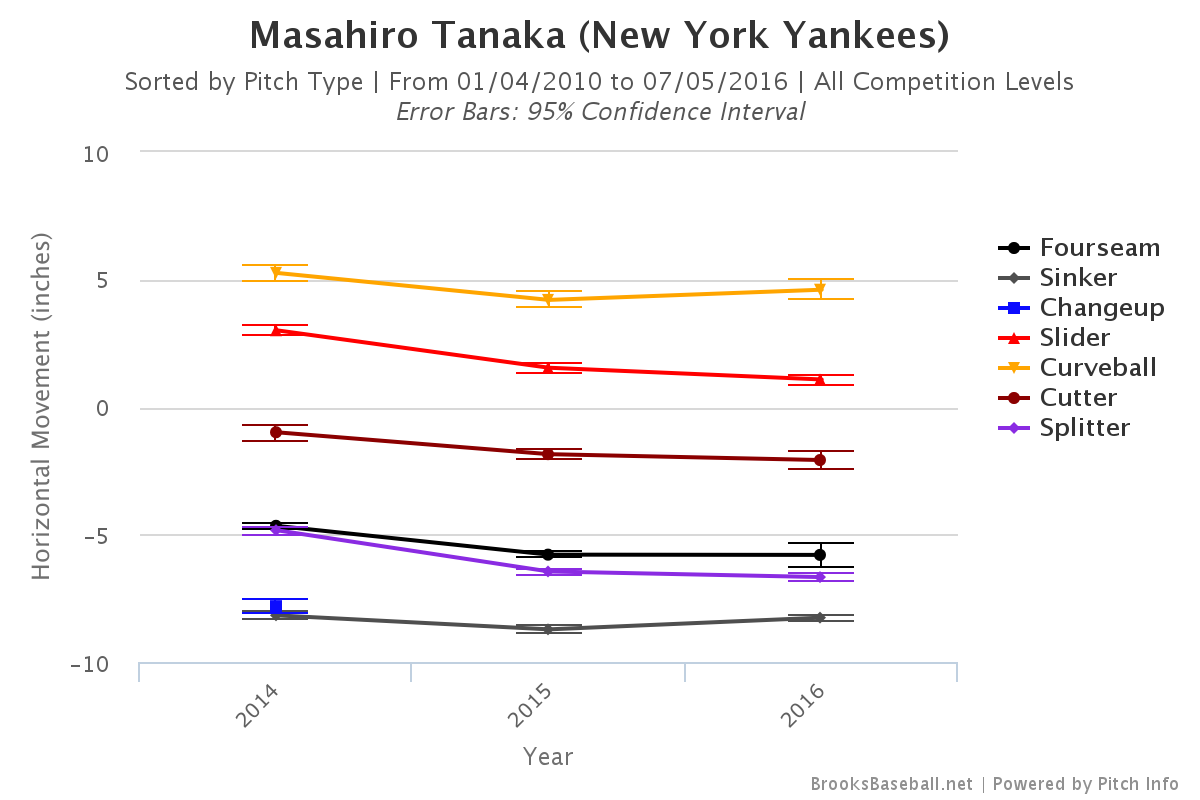
Interesting. His velocity has remained quite stable throughout his time with the Yankees (if you look year to year). Let’s look elsewhere. Another determining factor for K-rate is movement. Here is Tanaka’s horizontal movement over the years.

Brooksbaseball-Chart (2).png

Year Fourseam Sinker Change Slider Curve Cutter Split
2014 -4.66 -8.17 -7.81 3.01 5.26 -0.99 -4.83
2015 -5.79 -8.72 0.00 1.54 4.20 -1.85 -6.45
2016 -5.80 -8.26 0.00 1.08 4.60 -2.08 -6.67

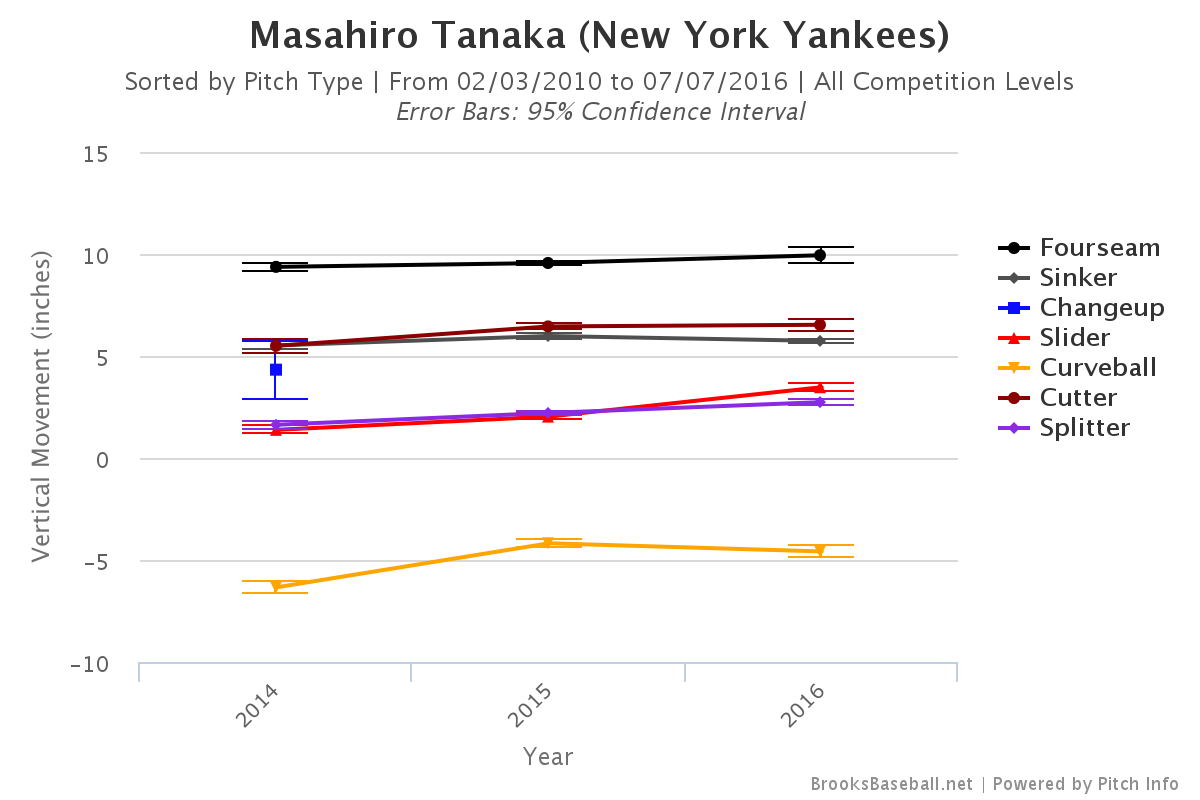
His slider, cutter, and curve have lost a bit of that typical movement away from righties, but at the same time, the four-seam and split have improved their arm-side run, inside to righties. The sinker has pretty much held steady. How about vertical movement?

Brooksbaseball-Chart (4).png

Year Fourseam Sinker Change Slider Curve Cutter Split
2014 9.37 5.52 4.33 1.38 -6.34 5.50 1.63
2015 9.56 5.98 0.00 2.03 -4.18 6.45 2.21
2016 9.94 5.74 0.00 3.47 -4.58 6.53 2.74

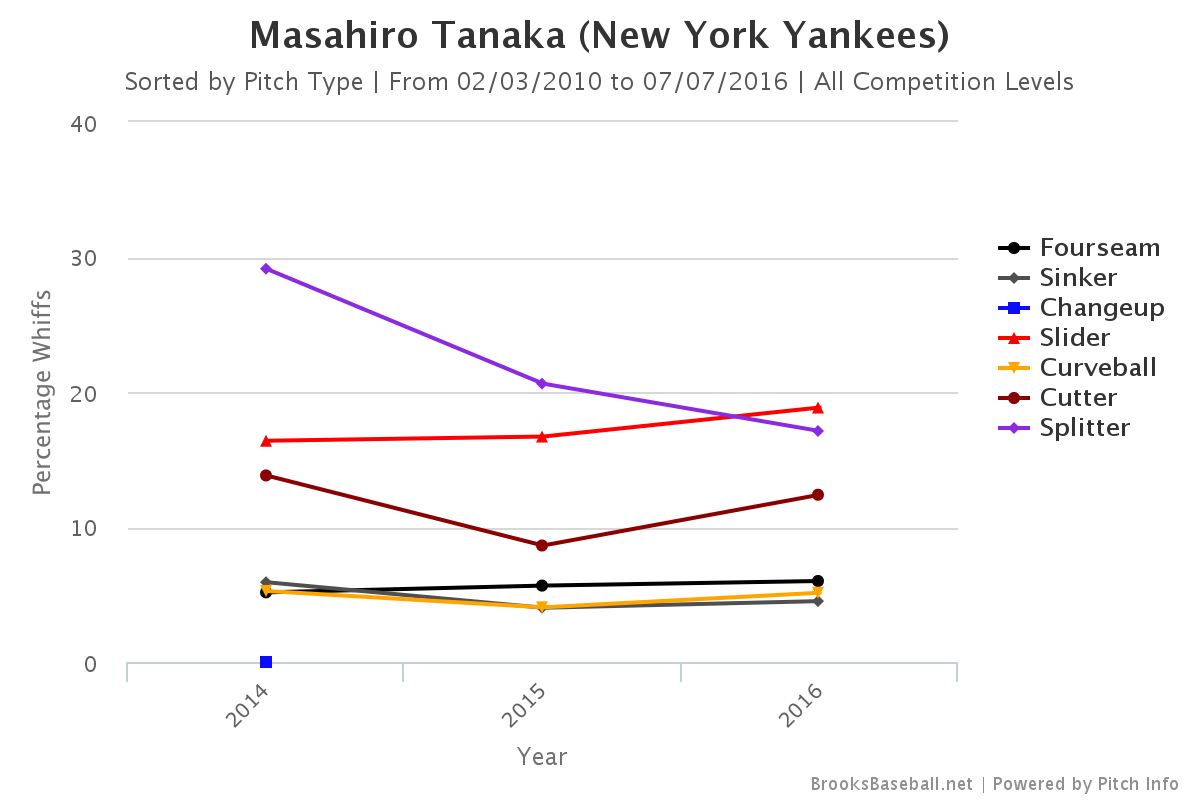
All of his pitches are dropping less/rising more, which is good for the four-seamer and cutter, but not so good for everything else. There are some good and some bad movement trends, but nothing that I would think would completely evaporate Tanaka’s strikeouts. There has to be something else. Has Tanaka’s whiff rate changed at all?

Brooksbaseball-Chart (6).png

Year Fourseam Sinker Change Slider Curve Cutter Split
2014 5.16 5.91 0.00 16.39 5.26 13.82 29.13
2015 5.66 4.02 0.00 16.70 4.05 8.63 20.62
2016 6.00 4.51 0.00 18.85 5.13 12.39 17.11

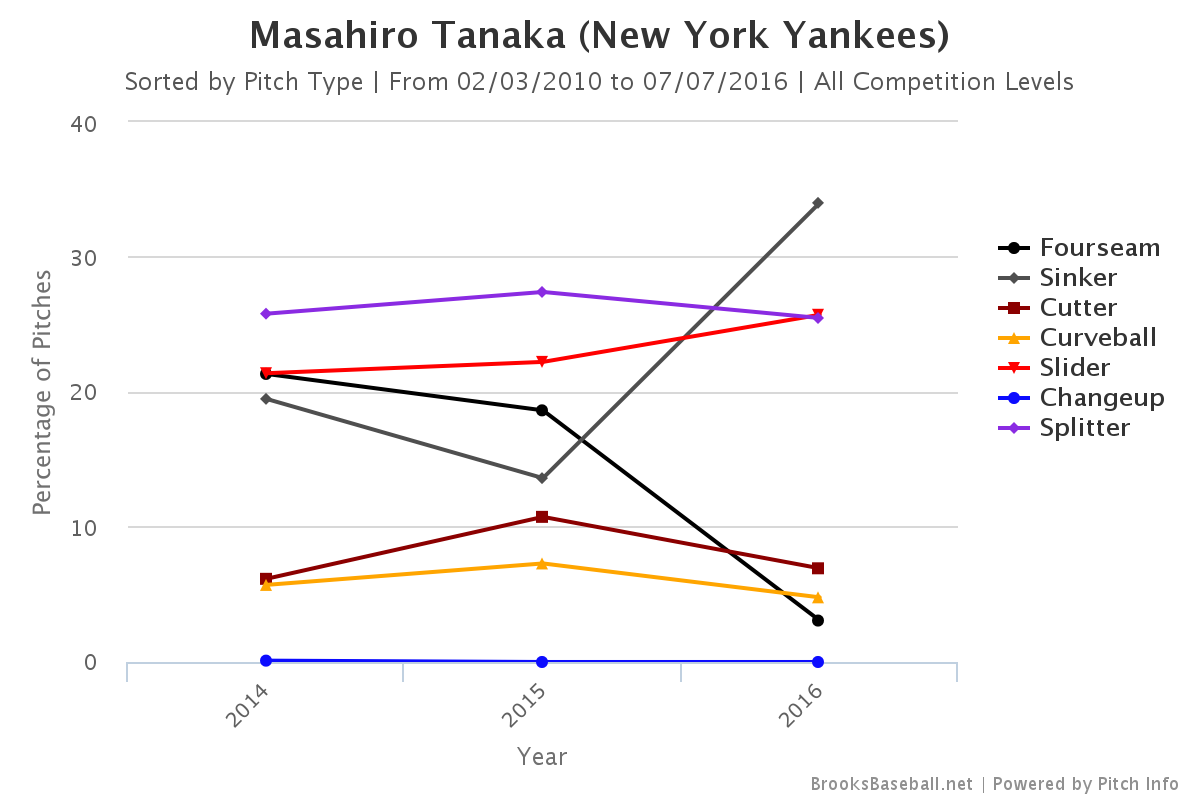
Indeed it has. The splitter has seen a sharp drop in swinging strike rate. Why is this happening? Did Tanaka change something? Let’s see if his pitch mix has any answers.

Brooksbaseball-Chart (5).png

Year Fourseam Sinker Cutter Curve Slider Change Split
2014 21.34 19.49 6.16 5.71 21.39 0.10 25.80
2015 18.64 13.62 10.75 7.30 22.23 0.00 27.41
2016 3.07 34.01 6.94 4.79 25.72 0.00 25.48

Woah! Tanaka has completely scrapped his four-seamer in favor of his sinker. Everything else has remained relatively stable. Here’s where we come full circle — back to the homers. I have a feeling that his reasoning for this change was that he wanted to improve his groundball rate in order to allow fewer home runs. Sure, the groundball rate has improved a little (up 3.4% in since last year), but this pitch swap seems to be the biggest reason I can think of for the sharp decrease in swinging-strike rate for Tanaka’s splitter. My theory is that his four-seamer, a relatively straight, hard pitch with a bit of rise, can help set up the splitter better than the sinker. The sinker and splitter are almost the same pitch; the split has a bit more drop, a bit more run, and is a bit slower. The velocity difference and movement difference between the splitter and four-seamer is much more drastic than those differences between the sinker and the split.

So, Tanaka seems to have traded some strikeouts for a few more groundballs/fewer homers. I’m not sure I like this change; his HR/FB rate was bound to normalize anyway. However, one thing I certainly like from Tanaka this year is that he has stayed off the DL. An asterisk has been over his name on draft day since the UCL injury a couple of summers ago. Despite staying off of the DL this year, people have been pointing to his better record on extra rest as a sign of fatigue. In 10 starts on extra rest this year, Tanaka has a 1.72 ERA, versus a 5.28 ERA in seven starts on regular rest. However, this has never been a noticeable split before this year, and it’s also worth noting that seven of those 10 starts have come away from Yankee Stadium, which I have deemed a bad park for Tanaka to pitch in.

Graphs and tables are from Brooks Baseball.


A One-Man Marte Partay Between the Bases

This article originally appeared on the Pirates blog Bucco’s Cove.

“Speed kills.” –Al Davis

Starling Marte is having a hell of a season stealing bases and this is one of the things that should have propelled him into the All Star Game without needing the stupid final vote. He is the top baserunner in the NL this year, he’s second in the league with 25 stolen bases, and he has a better percentage than the leader Jonathan Villar.

A recent game against the Cardinals gave a strong piece of evidence of Marte’s preternatural baserunning ability when he stole second base with Carlos Martinez pitching in the sixth inning:

The Pirates’ announcers commented on the fact that people very rarely steal off of Martinez. I went to look at the numbers: in 399 2/3 innings since entering MLB, Martinez has yielded only 10 stolen bases in 19 attempts. I think the 19 attempts is really indicative of his abilities to control the running game; people just don’t even try to run on Carlos Martinez. Martinez ranks 36th among all pitchers in SB/IP who have thrown at least 200 innings since 2013, which is decent. However, if we limit ourselves to looking at only righty starters over this time period (since it is much harder to steal against lefties and game circumstances are a bit different between starters and relievers), Martinez ranks 13th among pitchers with the same innings restrictions. (I’m not including tables for all of these stats, but if you want to see for yourself, mosey on over to the Baseball Reference Play Index, where all of this data comes from.)

Martinez has really shut down the running game since becoming a full-time starter in 2015, however. Over that time period, he ranks fourth among all pitchers (lefty, righty, starter, and reliever alike) having at least 250 innings in SB/IP, yielding only four SB in nine attempts over 282 innings.

Rank Player SB IP SB/IP
1 David Price 1 336.2 0.00297
2 Wade Miley 2 281 0.00712
3 Yordano Ventura 3 250.2 0.01199
4 Carlos Martinez 4 282 0.01418
5 Chris Tillman 4 279.1 0.01433
6 Wei-Yin Chen 5 290 0.01724
7 Danny Salazar 5 284 0.01761
8 Johnny Cueto 6 334.1 0.01796
9 Chris Sale 6 328.2 0.01828
10 R.A. Dickey 6 324 0.01852

(Note: If you bump this down to 150 innings to get more relievers on the list, Martinez is still in the top 10 for SB/IP.)

Of the four pitchers ahead of him in the table, two are lefties. (Sidebar: How the hell is R.A. Dickey on this list given the fact that he throws a knuckleball? It seems like it should be really easy to steal on him given that.) Martinez is similarly ranked (fifth) if you look at SB/Total Baserunners over the same period; in short, Martinez is really, really good at controlling the running game.

Furthermore, reigning eight-time Gold Glove winner Yadier Molina was behind the dish attempting to throw Marte out. Molina ranks first among all catchers since 2002 in his ability to control the running game by the defensive metric rSB. Obviously Martinez’s ability to prevent the stolen base is helped by having Molina behind the dish, but the combination of these two has been deadly over the past season and a half, making Marte’s accomplishment all the more impressive.

The Martinez/Molina duo (and Martinez in general) has only allowed one other stolen base this season so far. Who was it? None other than Bartolo Colon! Actually, I’m kidding, it was Starling Marte, which is almost as crazy! He has the only two stolen bases this season against a guy who only gave up two all of last season. These are also the only two attempts against Martinez all season. On May 6, after a bunch of false starts, pickoff moves, foul balls, and laughs between Molina and Marte, he finally got his stolen base:

The thing I find most entertaining is how loose everyone seems, goofing off and laughing about the play that just happened, which seems relatively rare in this day of boring interviews and generic soundbites. Molina had a good laugh about that one, but he was pretty upset about the more recent stolen base.

There’s nothing to be mad about, though; Martinez and Molina simply got burned by the best baserunner in the game right now.


Kris Bryant Continues to Hit

Ever since he was taken with the second pick in the 2013 draft, the spotlight has continually followed Kris Bryant. After mashing his way through the minors in less than two years, Bryant had a spectacular rookie season with a slash line of .275/.369/.488 with 26 homers and a 136 wRC+. Deservedly, he was rewarded with the NL Rookie of the Year award. Although he did strike out over 30 percent of the time, he showed great plate discipline along with immense power. His 6.5 WAR ranked 10th among major league hitters. However, this year he has taken his production a step further.

With his league-leading 25 home runs to go along with his slash line of .278/.370/.578, one major change sticks out. Although his average and on-base percentage remain around the same as his 2015 totals, his slugging percentage has taken a huge jump. Halfway through the season, he is one home run shy of last year’s total and around half of his hits have gone for extra bases (44 out of 87). He’s also cut down on his strikeouts while making even more hard contact than he did last year — shown by his 42% hard-hit rate which will allow him to continue to tap into his power.

One noticeable change sticks out in his batted-ball profile. Although his ground-ball, line-drive, and fly-ball rates remain relatively constant, Bryant has pulled the ball more in his second big-league season. This has caused more of his fly balls to leave the park. Taking a look at his 2016 home-run spray chart, you can see that all of his home runs have been pulled.

bryant-2016

Source: FanGraphs
Next take a look at his 2015 home-run spray chart.

bryant-2015

Source: FanGraphs
Most of his home runs have been in the same general area with the exception of a few opposite-field home runs to right. Since he has been pulling the ball with more authority in 2016, the balls that he pulls in this sweet spot to left will allow him to continue to leave the yard at a ridiculous rate. With his picturesque swing to go along with his strong hands and 6-foot-5, 230-pound frame, swings like this

Kris Bryant Homer

…will continue to be common for Cubs fans to see from Kris Bryant.

However, it would be foolish to simply call Bryant a home-run hitter when in fact what makes him so special is his all-around hitting ability to go with this insane power. He walks, hits the ball hard, and his only flaw is his propensity to strike out — and even that he has improved upon this year. A two-time All Star already with 4.3 WAR this season, he ranks fourth among major-league hitters and first among NL hitters in WAR while also possessing a 149 wRC+. At this point, if the NL MVP is going to go to a player not named Clayton Kershaw, Kris Bryant deserves to be the one holding up the trophy. But the trophy most important to him is the one won at the end of October. With the Cubs holding a comfortable lead atop the NL Central, Bryant looks destined to lead them on a deep playoff run with the hope of finally shattering their 108-year-old curse.


The Good and the Bad: David Price Isn’t Sinking

You know his story: David Price is a $217-million man with a 4.74 earned run average, and the people of Boston aren’t happy. It’s another Crawford-Sandoval-Ramirez waste of money. Things are headed downhill for the 31-year old veteran. Or are they?

First, the bad news: the 2016 version of David Price has been worse than the 2015 David Price, and way worse than the top-caliber pitcher Boston signed him to be. And the ERA shows it.

The suspect is pitch selection, and the culprit is a sinker that doesn’t sink. Price has a two-seam fastball that over his seven-year career he has thrown some 30% of the time. In his prime, it clocked in at 94-95 mph, but since then he’s dropped almost two mph.

Usually, that level of velocity leak wouldn’t be a big deal, because if there’s enough movement and deception, batters will be fooled either way. But Price’s sinker is different.

Brooks Baseball reports that “His sinker has well above-average velocity, but has little sinking action compared to a true sinker and results in more fly balls compared to other pitchers.” Uh-oh. “Little sinking action?” There needs to be at least some element of vertical movement for a sinker to be fully effective, or, in Price’s case, a little extra velocity. But now he has neither.

The results show it. Last month, he surrendered 10 home runs, more than the previous two months combined. Also in June: 31% of his pitches were sinkers, nearly 10% more than the month before. Coincidence? I think not. He’s also allowing a .241 Isolated Power on sinkers, only three points less than Mike Trout this season. And maybe the most convincing statistic: hitters are pulling the ball 10% more than they did last year, which means they are making more solid contact and not having to stay back on his fastball. Price’s pitches are slower, and it’s making a difference.

Why is he losing velocity? There’s two possibilities and they point in completely opposite directions. The first is age. Price is 31 and he’s nearing the point where most starting pitchers start to fall on the aging curve and eke velocity. If this is the case, it’s going to be a long seven years for the Red Sox. But there is another possibility. Price has played in Tampa Bay for most of his career, where the temperatures are never 40 degrees like Boston in April. It’s entirely possible that the cold ‘froze’ him up this spring and as the season continues, he’ll regain his speed. Most likely, it’s a combination of both. But either way, it’s never a good sign when pitchers slow down.

Price has always gotten away with leaving sinkers up in the zone because they showed 94-95 mph on the radar gun. But now hitters are seeing 92mph fastballs fly straight down the middle of the plate and stay there.  Why doesn’t he just put the ball on a tee? Nine out of 10 major-league hitters will knock that pitch into the stands every time. Just look at the stats: He’s surrendered just two fewer home runs than he did last season even though he’s pitched 112 fewer innings (2015: 17, 2016: 15), and he’s allowed an average of 1.25 home runs per nine innings, which is 32 percent worse than his career average (0.84). Sinkers are sending the man to his grave.

They’re also killing his ERA. 38% of his earned runs are from home runs, and if you set his home runs to eight instead of 17, his ERA would be 4.01 instead of 4.74, a 0.73 difference. (8 is the number he had allowed last year at this point in the season.) In fact, his strikeout and walk totals are even better than last season, but the home runs negate all of it.

But we can’t blame everything on the sinker, either. Price has definitely been unlucky this season. His home run to fly ball ratio is 15.5%, an unsustainable mark, his .323 BABIP .035 more than his career average, and his LOB% 10 percent less than the 2016 league average. These will balance out in time. But his sinker is the real problem.

The only way to truly limit home runs is to limit fly balls, and for Price, the only way to limit fly balls is to stop throwing sinkers that don’t sink. The solution is (1) throw harder, or (2) find another pitch to replace his sinker. Option one is still TBD. Option two could be filled with either a change or slider — two pitches that he has used to complement his fastball but never to the level that he uses his sinker. The outlook is grim either way.

Price is still a very experienced pitcher, and once his HR/FB, LOB%, and BABIP rates come down to earth, things will even out. But if he wants to be successful for the Red Sox for the entirety of his stay, there’s a longer-term issue at stake, and if his velocity continues to leak, I’m not sure what type of David Price we’ll be looking at a year from now.


Inverse Clayton Kershaw

Clayton Kershaw is great. Really really great. Maybe hurt — but definitely great. But I’m not interested in examining Clayton Kershaw; I’m interested in examining Inverse Clayton Kershaw. I want to find the pitchers that have been most unlike Kershaw during the last calendar year. Kershaw has been the best — I want to find the worst.

Clayton Kershaw vs. League Average – Past Calendar Year
ERA FIP xFIP K% BB% HR/9 SwStr%
Clayton Kershaw 1.50 1.56 2.08 33.8% 2.9% 0.36 16.1%
League Average 4.13  4.11 4.07 20.8% 8.5% 1.11 10.0%
Difference -2.63 -2.55 -1.99 13.0% -5.6% -0.75 6.1%
Inverse Kershaw 6.76 6.66 6.06 7.8% 14.1% 1.86 3.9%
Data pulled 6/29/16

So wow. Did I mention Kershaw is great? Anyway, time to find Inverse Kershaw. First, I want to point out that the players below are still incredible at baseball. They are some of the most elite in the world, way better than all of us. Caveat aside, I’ll now examine the pitchers over the past calendar year who are most unlike Kershaw in each of the stats above — i.e. if Kershaw’s ERA is 2.63 below league average, whose is 2.63 above league average. When in doubt, I’ll defer to the guy with the most IP. At the end, I will name the Inverse Kershaw!

ERA

So, whose ERA has been a whopping 2.63 runs above league average? Coming in with an ERA of 6.75 we have Carlos Contreras. Contreras pitched 18.2 innings within the last year for the Reds out of the bullpen. You probably expected some 2016 Reds relievers to qualify, but Contreras posted these numbers exclusively in 2015 and then did not make the 2016 Reds bullpen. Yikes.

FIP

Noe Ramirez has worked to a 6.65 FIP in 24 IP for the Red Sox over the last year. Prior to 2016, then lead prospect analyst Dan Farnsworth said of Ramirez, “his stuff likely isn’t good enough to be more than bullpen filler.” Maybe not even that good.

xFIP

Well I’ll be damned. With 18.2 IP with an xFIP of 6.05 out of the Reds bullpen we have…Carlos Contreras.

K%

With a K% of exactly 7.8%, we find the final 13 IP of Dodger right-hander Carlos Frias‘ 2015 season (he hasn’t pitched yet in 2016). As a Cistulli darling, I imagine this is just a speed bump in Frias’ journey to becoming a Cy Young winner.

BB%

In 39.2 IP, Elvis Araujo of the Phillies has walked 14.0% of batters faced. In related news, Araujo was optioned to Triple-A Lehigh Valley on June 26.

HR/9

Matching our criteria exactly with 1.86 HR/9 allowed in 67.2 IP is Toronto starter Drew Hutchison. This figure doesn’t factor in his excellent work in Triple-A (.77 HR/9 allowed), and according to the Toronto Sun, Hutchison figures to be called up soon. Hopefully he can get the gopheritis under control and contribute for the Jays down the stretch.

SwStr%

I made a judgement call here. The pitcher with the most IP within 0.2% of the required 3.9% SwStr% is Jon Moscot and his 4.1% SwStr%. Moscot has posted that rate across 21.1 IP in five starts for the…gulp…Reds this year. Poor Reds fans.

The Inverse Kershaw

It is all fine and good (bad) to post inverse Kershaw numbers in one category, but I wanted to know the single pitcher that was most unlike Clayton Kershaw. More accurately, I wanted to find the pitcher whose performance has been as far below average as Kershaw’s has been above average. To do this, I began with a sample of all pitchers appearing in MLB over the last calendar year. I then calculated the number of standard deviations each of their component statistics were from the Inverse Kershaw numbers in the table above. The pitcher with the lowest sum of standard deviations will be named the Inverse Kershaw. This is exactly the methodology used by Jeff Sullivan for his pitch comps.

And the winner (loser?) is….Matt Harrison, formerly of the Texas Rangers, currently of the Phillies Disabled List. You may remember Harrison as the salary dump portion of the Cole Hamels to the Rangers trade. You will hopefully now remember him as the past calendar year’s Inverse Kershaw. The final numbers are below.

Clayton Kershaw vs. Matt Harrison – Past Calendar Year
ERA FIP xFIP K% BB% HR/9 SwStr%
Clayton Kershaw 1.50 1.56 2.08 33.8% 2.9% 0.36 16.1%
League Average 4.13  4.11 4.07 20.8% 8.5% 1.11 10.0%
Inverse Kershaw 6.76 6.66 6.06 7.8% 14.1% 1.86 3.9%
Matt Harrison 6.75 6.07 5.66 7.3% 8.7% 1.69 3.3%
Data pulled 6/29/16

So there you have it, the pitcher coming closest to being as far below average as Clayton Kershaw has been above average over the last year is Matt Harrison — the Inverse Kershaw. Just for fun, here is the same table as above, subbing out the 2016 Reds Bullpen for Matt Harrison.

Clayton Kershaw vs. Matt Harrison – Past Calendar Year
ERA FIP xFIP K% BB% HR/9 SwStr%
Clayton Kershaw 1.50 1.56 2.08 33.8% 2.9% 0.36 16.1%
League Average 4.13  4.11 4.07 20.8% 8.5% 1.11 10.0%
Inverse Kershaw 6.76 6.66 6.06 7.8% 14.1% 1.86 3.9%
2016 Reds Bullpen 6.08 6.02 5.16 18.9% 11.9% 1.95 9.7%
Data pulled 6/29/16

Poor Reds fans.


Robbie Ray: Better, But Also Worse

Let me start off by pointing you to this excellent article recently penned by eyesguys1 in which he also analyzes 2016 Robbie Ray.  I write this now not to steal his thunder, but to report some pretty interesting Robbie Ray trends I’ve discovered (and because I was almost done with this when I saw his article).

Robbie Ray put together a pretty successful rookie campaign last year — he pitched 127.2 innings with a 3.52 ERA to go along with a 3.53 FIP and 2.1 WAR.  It’s not going to blow anyone away, especially considering last year’s rookie class, but it was a good season nonetheless.

He’s currently sporting a rough 4.69 ERA and 3.96 FIP, way up from last year’s totals.  He’s ramped up the velocity on all his pitches except the sinker, so you would think he’d be doing better than in 2015, or at least not a full run worse.

Robbie Ray Velocity Increase
2015 2016
Four-Seamer 94.22 94.78
Sinker 93.70 94.39
Changeup 84.87 87.42
Slider 83.37 85.87

Likewise, his K-BB% (one of the best in-season performance predictors) has gone up.  While he has walked 9% of batters he faces, his 25.6% strikeout rate is good for 17th among qualified pitchers.  What’s making the difference?  Home runs.

It’s fair to say he’s had a homer problem this season.  His HR/FB rate is a lofty 15.8%, up nine points from last season, and it’s worth noting that his xFIP has therefore improved.  His .358 BABIP appears to indicate that he’s been unlucky, but Andrew Perpetua’s xBABIP formula  says that his expected BABIP is still a bit high at .323.  What gives?

His platoon splits give us a clue, because they’re rather striking.  Left-handed hitters have a .282 wOBA against him, while right-handers are crushing him to the tune of a .365 wOBAA.  He had somewhat of a platoon split last year, but it wasn’t anything like this.  He’s actually gotten better against lefties by almost the same degree as he’s gotten worse against righties.  Why?

Against lefties, he’s been nothing short of dominant.  He’s throwing mostly the same mix of pitches against them as he did last year (mainly the four-seamer and slider, with some sinkers thrown in) yet his wOBAA is down to .282 from .309 in 2015.  His numbers versus lefties may be nothing more than randomness associated with small sample sizes since he has faced only 93 of them this season (but still only 141 last season).  It’s not beyond belief that a left-handed pitcher is doing well against left-handed hitters, especially when you consider his strikeout and walk numbers.  He has struck out 28% of the left-handed hitters he’s faced and walked just 5.4%, so his K-BB% is 22.6% (up from 17% last year).  Plus, his home-run problem isn’t so bad for left-handers as he sports a close to league average 11% HR/FB rate.  Since Ray hasn’t faced many southpaws this year, it’s harder to know what exactly he’s doing, if anything, to improve against them.  What jumps out the most is that he’s getting significantly more whiffs on the slider and sinker, so that could explain the increase in strikeouts, as could the uptick in velocity.  Regardless, K-BB% is one of the best in season predictors available, so he’ll likely continue doing well against lefties going forward, even if he isn’t dominant.

Right-handers are where he’s struggling.  Though his K-BB% against them hasn’t been bad at all (14.8%), he’s given up a rather high 16.4% HR/FB rate versus righties (likewise, his xFIP is a bit lower).  This represents a bit of a homer problem, especially considering he only had a 7.1% HR/FB RHH split last year.  He’s been tinkering with his pitch mix against opposite-handers, so perhaps there’s a clue there.  Take a look at his home-run rates for balls in the air (both fly balls and line drives) for his four main pitches (excluding the curve) both this season and last from Brooks Baseball:

Home Runs on Balls in the Air
Four-Seamer Sinker Changeup Slider
2015 3.03 3.57 0.00 12.50
2016 7.69 11.76 25.00 11.11

While he’s given up some home runs on the four-seamer, the main culprits are the sinker, slider, and changeup.  The most striking example is the changeup, which leaves the yard 20% (!) of the time when it’s hit in the air.  If you think about it, it makes sense that a changeup hit in the air might often leave the yard, but I couldn’t find many with a HR rate on it like to Ray’s.

Bluntly put, his changeup has been bad.  According to the pitch-type linear weight leaderboards, he’s had the league’s worst changeup by wCH at -7.3 and the fourth worst in wCH/C. (Something interesting: second-worst in wCH went to fellow D-Backs starter Patrick Corbin.)  He threw his changeup about 13% this April and increased that to 15% in May.  The results weren’t pretty; righties posted a .466 wOBAA in April and .330 wOBAA in May against his change.  For a pitch typically with reverse platoon splits this is not good, especially considering righties’ wOBAA (on a month-by-month basis) against it peaked at .312 last year.  He’s been locating it down and out of the zone, and that’s precisely where it’s gotten hit hard.  It’s been getting more whiffs and ground balls, but when it is hit in the air, it’s gotten blasted (like many of Ray’s pitches).

Thankfully, through his past four starts he’s ditched the change completely, instead leaning more heavily on the four-seamer and slider.  He did the same thing towards the end of last season, so maybe it’s gone for good this time.  He changed his change this year, but righties simply aren’t buying it.

But the changeup isn’t the only pitch he’s played with.  Last season saw a steady trend where Ray threw the four-seamer less and sinker more as the season went on.  That trend continued into early June of this season.  In fact, save one start against San Diego, he threw his sinker significantly more than his four-seamer against right-handers (he doesn’t throw it much to lefties) in four starts from mid-May to mid-June.  Before and after this period he threw primarily the four-seamer, so dividing up his season into three periods reveals some interesting trends.

Robbie Ray’s 2016 Sinker Against RHH
April 8-May 10 May 11-June 5 June 6-June 27
Four-Seamer % 45.31% 27.43% 54.64%
Sinker % 24.41% 40.90% 23.56%
BIP% (SNK) 14.88% 19.23% 20.41%
GB% (SNK) 36.84% 40.00% 45.00%
wOBAA (SNK) 0.486 0.401 0.447

He’s been getting progressively more ground balls as the season goes on, and more sinkers are being put into play.  Looking at his location, he spotted it further up and out of the zone away from right-handers.  In that first period, he gave up seven walks in 20 at-bats, while since then he’s given up just six walks in 59 at-bats, even though he’s been throwing it out of the zone more.  Right-handers are simply swinging at it more and putting it in play more and more often.  And despite throwing out of the zone more, he’s getting hurt in the zone more often.  Maybe the pitches he’s making in the zone are really hittable.  Maybe I’m grasping at straws and it’s all randomness.  wOBAA has been up and down (and is still really high), so it’s hard to tell if anything he’s doing is making a difference.  He is tinkering with the sinker and getting more ground balls, so it’s just a matter of limiting the damage on hits that aren’t ground balls.

Since he dialed back his sinker, he’s been relying more on his four-seamer.  This is promising because in terms of wOBAA it’s been his most effective pitch against right-handers next to the curveball (which I’ll get to soon).  He’s throwing his four-seamer the fastest he has in his career and it’s missing a lot more bats.  As long as he keeps it up, he will hopefully trend in the right direction.

But I’d be remiss if I didn’t mention Robbie’s most interesting pitch: his slider-thing.  Okay, it’s a slider, and it’s probably more conventional than I’ve convinced myself while writing this.  Take a look:

It has primarily 12-6 movement, and it’s only added more movement since last year:

Slider Movement
Horizontal Movement (in.) Vertical Movement (in.)
2015 1.42 1.71
2016 1.88 2.96

He mostly throws it to lefties, but he’s thrown it 12% of the time to right-handers, so it’s worth examining.  He’s also been throwing it more since he ditched the changeup.  Righties have a 0.312 wOBA against it, which isn’t spectacular, but it’s a modest improvement from the .352 mark last year.  But the most striking thing about his slider is that right-handers are hitting it on the ground 58% of the time!  That’s an 18-point improvement from 2015.

His uptick in grounders on the slider could be due to a number of things.  As I noted, he’s throwing it faster.  About 2 MPH faster, and it sits in the 85 MPH range on average.  He likes to spot it low and inside just off the corner of the zone to righties, and he seems to be hitting that location a bit better now.  But what jumps out most to me is that while he’s throwing it for strikes less, righties are swinging at it at the same rate, so it stands to reason that they’re making worse contact.  Most of the damage appears to come when it’s in the zone and up.  When they do hit it in the air (fly balls and line drives), they hit it out 11% of the time.  On average, he threw the slider more in June than in April or May and he’s getting fewer fly balls on it than he did in May, so it appears to be trending in the right direction.  And if you remember the chart above, he has lowered the HR/(FB+LD) rate since last season.  So if he can keep it down, the slider should be a very effective weapon against righties.

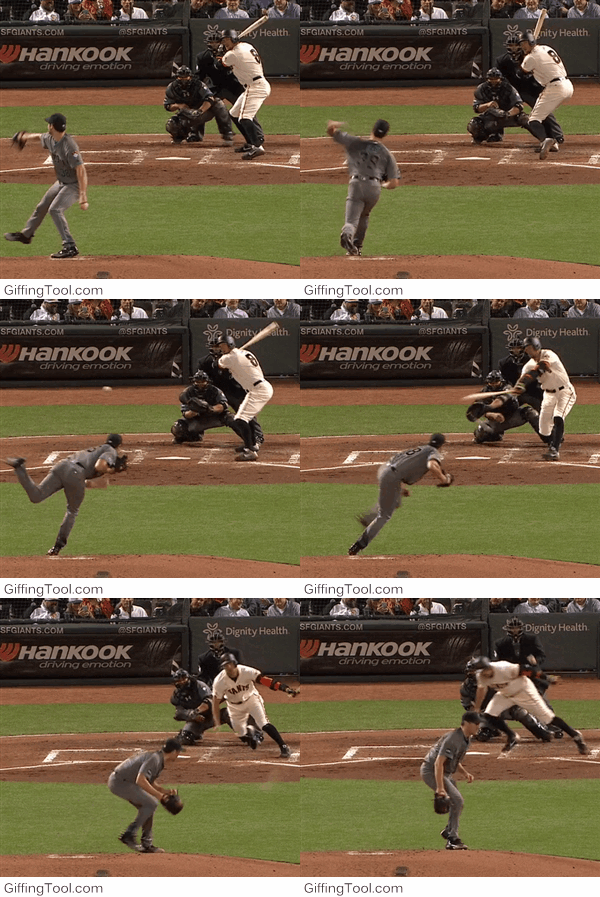
One last thing I’ve been avoiding: the curveball.  Brooks Baseball says he’s throwing one, while here at FanGraphs it’s lumped in with the slider.  It could be just a misclassified wonky slider.  He’s only thrown it 61 times this year, so it’s hard to know what to make of it, but see for yourself.  Here it is catching Hunter Pence looking:

Ray to Pence curveball

And here’s a slider for reference (on the very next pitch mind you):

Ray to Pence slider

The two have similar sliding action, it’s just that the top one looks more curve-y.  It’s a little hard to me to tell the difference by looking at them (though the movement profiles at Brooks are a little different).  It looks like he may have a higher release point on the second pitch, which would be consistent with a curve.  At Brooks his release point for the curveball is a little higher, albeit not by much.  It’s a trend worth keeping an eye on.

If he really has added a curveball to his repertoire for good, the results look promising.  So far, he’s gotten almost 50% whiffs per swing, a 58% ground ball rate, and hasn’t allowed a single right-hander to reach on it (and only one lefty).  That’s just 10 at-bats, but five of those resulted in strikeouts.  Again, it’s a small sample size, but if these results continue, he may have found his pitch to beat the platoon split.

Bottom line, Robbie Ray has been far worse against right-handed hitters this year because of his sinker and changeup.  He’s ditched his changeup, which is probably for the best.  His sinker has been a mixed bag, but he is getting more ground balls.  What’s more, he’s been throwing his four-seamer — his best pitch — a lot more often, and he’s been getting tons of ground balls.  If he sticks to the fastball and keeps the slider down, he shouldn’t get torched by righties like he has.  And he may even be developing an effective curveball to get them out.

Against lefties, it’s a little simpler.  He’s doing largely the same things, just missing more bats and striking out more guys.  It’s hard to say with such a small sample size, but it’s a reason for optimism.

In 2016, Robbie Ray has been better, but also worse.  However, recently he’s shown some good signs that could make him better, and also better.

Certain stats and tables courtesy of Brooks Baseball.  Gifs from Baseball Savant and Inside the ‘Zona.