Archive for Outside the Box

Lessons in Symbiosis: The Atlanta Braves and Waffle House

Remember lichens? Those organisms you learned about in biology that form as a partnership between fungi and algae in which both benefit? I would argue that a new such mutualistic symbiotic relationship has formed: the one between the Atlanta Braves and Waffle House. Long a revered Southern institution, Waffle House was installed at Turner Field last Friday (though it’s rumored after last week’s ankle injury that Tim Hudson prefers IHOP). Since then, the Braves have been on a tear, winning six straight, including a sweep of the (at the time) red-hot St. Louis Cardinals. Coincidence? I think not!  As always, let’s take a look at the numbers.

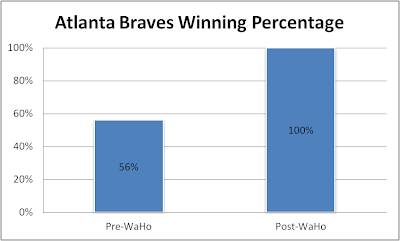
The following charts will be broken up into two distinct periods: the first 102 games (“pre-WaHo”) and the past six games (“post-WaHo”). We’ll start with the bottom line.

If the numbers are to be believed (and Numbers Never Lie, right ESPN?) then the Braves, a strong team already pre-Waho, are now unbeatable post-WaHo. It remains to be seen if this is merely a home game effect, however. It’s also possible that the Braves are playing similar baseball post-WaHo compared to pre-WaHo and are fortunately getting better results. To investigate, let’s dig deeper into the components that drive wins: run scoring and run prevention.

Clearly the Braves have played better baseball since Waffle House arrived at the Ted. Run scoring (RS/G) is up over two runs per game, while runs allowed (RA/G) are down over a run per game. Based on pythagorean expectation (read here), a team scoring and preventing runs at the rate the Braves have these past six games would be expected to go 144-18 over a full season. So extrapolating recent results to expectations of an undefeated rest-of-season might be a little extreme, but a 90% win rate seems entirely reasonable.
In general, someone with some background in statistics might warn against inferring causation from correlation, as well as reading into a six-game sample. That said, I believe the Braves/Waffle House relationship warrants an exception. It’s simple math, really. WaHo at Turner = happy, enthusiastic fans. In turn, enthusiastic fans lead to motivated players and motivated players drive on-field success. Now there’s just one question left to be asked: why didn’t Waffle House come sooner?
Ed. Note: This post was not sponsored by Waffle House. If anybody knows how to make that happen, please contact me. Thanks.

My Brewers Romance

Rock and Roll as a popular art medium is dead.
So too are the 2013 Milwaukee Brewers.
So it seemed apropos to commemorate the first half of the 2013 season with a hybrid revieweulogy of one of my favorite bands of all time that also died (well, broke up) this year, My Chemical Romance (who also just so happens to be almost obsessively focused on death and dying).
If you are one of the 21 billion people on the planet right now that listen to music, chances are it is about as far removed from the 90s as roller-blading and frosted tips. No, chances are, you are listening to either a. Hip-Hop/Rap (Rihanna, Kanye, 2Chainz) b. Indie-Electronica (MGMT, Gotye) c. Folk music (Anything featuring a Mandolin or Banjo, i.e. every song on alternative radio) or d. Top-40 Country (ironically enough, with the recent discovery of the overdrive effect by country artists, probably the closest thing to 90’s rock going right now).
Put it this way, if you’re a band that features heavy, down-tuned guitars and gravelly voices, you’re about as popular as a bowl of pudding at the annual jello convention.
And if you are a My Chemical Romance fan it is even worse. Of all the bands that I love, MCR is the one band that I can’t find anyone, anyone at all, to appreciate fully with me. And this is something that I really struggle to understand; mostly from the simple fact that they are just so damn good.
The hooks are insane, the guitar work is precise and ultra-creative, and the lyrics are almost always well-constructed and compelling. I am fascinated by the lack of interest in others when I bring up the band or try to get friends (I even target people who I know are huge David Bowie and Queen fans, of which MCR is heavily influenced and eerily similar in style) to listen. My two main theories involve the fact that a.) MCR just missed the 90’s and therefore there is a lack of nostalgic enjoyment from my demographic, and b.) that the band dressed as “vampire kids” in their formative years as a band (again a phase my demographic missed by a couple of years and never really understood).
Nevertheless, My Chemical Romance, along with Pop-Rock in general is dead and mostly forgotten. And that sucks.
Which brings us directly to the current incarnation of the Milwaukee Brewers.
And so in honor of the break up of My Chemical Romance and the early demise of the 2013 Milwaukee Brewers, I present to you the 10 most poignant My Chemical Romance lyrics that sum up the first half of the Milwaukee Brewers season…
1. “I’m not okay / I’m not okay / well I’m not okay / I’m not O-fucking-kay”
Let’s get the most obvious one out of the way first. The Brewers are most definitely not O-fucking-kay this year. At 38-56 they have the fourth worst record in all of baseball. Their minus-65 in run differential is 3rd worst in baseball and at 19.5 games out of first place; the season is all but lost even at the halfway point.
How did we get here?
Poor planning with the starting pitching staff for one. The decision to rely on smoke and mirrors guys from the second half of last year was a fatal flaw before the season even began. Without the late addition of  Kyle Lohse, we may have been in an even deeper hole at the All-Star break. Marco Estrada has flamed out due to injuries, Mark Rogers hasn’t even pitched an inning in the bigs, and the last news on Mike Fiers was that he had moved to Florida, grown out his beard and become friends with someone named, “Wilson.”
Injuries have also decimated the team, as reported by the Journal Sentinel this week, the meat of the Brewers lineup: Braun, Ramirez and Corey Hart combined for 98 home runs last year and have just 14 between the three of them at the break. Not a winning combination.
It’s probably time for the Crew to admit they are not okay and begin to take some action to rebuild/reboot for the future.
{As an aside, despite the fact that this is one of their most popular songs, it has always been my favorite. In life, as in baseball, we are conditioned from early childhood to always tell everyone that we are ok no matter what we are going through. When facing loss, pain, rejection, an abomination of a baseball season, we are always expected to “man up” and tell the world that we are fine. (I guarantee you that somewhere at this very moment Ron Roenicke is telling some reporter that the Brewers are going to be a-ok, even though they are obviously not). Athletes are taught to never show they are hurt and act “ok” even after suffering a brutal injury. Everyone is taught to go to work, hold your head up and smile the weekend after a breakup or a funeral. This song is innately therapeutic in its refutation of the “I’m not ok” moniker. Sometimes we are not ok and we just want to scream it at the world. MCR gave us an outlet for that. And that is pretty OK.}
2. “And the world is ugly / But you’re beautiful to me”
 
This line goes out to my favorite player, (as you already know) Carlos Gomez. In all of the ugliness surrounding the Brewers this season, Gomez has shone brighter than just about any star in the League. In fact at 5.7 Wins Above Replacement, he leads the entire National League in that category. His slash line of .295/.337/.533 and peripherals 14 homers, 21 steals, 51 runs, and 45 RBI don’t even come close the telling the whole story of the “Golden Retriever.”
He is one of, if not the best defensive center fielder in the game, robbing FOUR potential home runs this half year alone. Advanced metrics list his defense as saving 24 runs for the team above an average league center fielder. And even that doesn’t tell the whole story. Gomez continues to exude a charm and charisma that makes sports worth watching. He wears his love of the game on his sleeve and makes you hold your breath with every dive and every wholly unnecessary mega-rounding of first. But he makes the game of baseball that much more interesting. There are a litany of boring stars that “respect the game” like Ryan Braun (since 2010) and Albert Pujols. But there is only one Carlos Gomez and he is beautiful to me.
3. “Without, without a sound / And I wish you away / Without a sound / And I wish you away”
 
To Yuni B. After pushing Brewer fans to the brink of insanity in 2011 with his terrible defense and miniscule On Base Percentage, Yuni somehow wormed his way back into Milwaukee. Did he kidnap Doug Melvin’s granddaughter and hold her for ransom? Did he accidentally come as a part of the deal for Jean Segura last year? Did he just keep his jersey from 2011 and show up on the bench day after day until a confused and mildly apathetic Roenicke finally just subbed him in? Is he even getting paid? Or is he just a Yoshi-looking, Milton from Office Space, only he always keeps smiling that Lego-man smile so that you can never truly get mad at him?
Regardless, it’s time for Yuni B. to go before he up and burns the place down.
4. “You’ll never make me leave / I wear this on my sleeve / Give me a reason to believe”
 
Rickie Weeks – you gave us a reason to believe. After listening to countless hours of impatient/ignorant/jerk Brewer fans tearing Weeks down through his struggles and living through the subsequent and audaciously ludicrous Scooter Gennett call up, this is what I had to say at the beginning of June.
Since I wrote that piece, here is what Weeks has done over the last 28 games:
Average
OBP
OPS
Home Runs
RBI
Runs
.290
.389
.920
6
11
13
Seriously, find me another second baseman not named Dustin Pedroia that sports a .390 On Base Percentage. Then, grow up!
No matter how many Brewers fans inexplicably hate Weeks, I hope they will never make him leave. Sometimes we only learn to appreciate things after they are gone, and I hope it doesn’t have to come to that anytime soon. But what I do know is that you can line up all the Scooter Gennett’s in the world if you feel like it, but ‘Ol Richard Weeks sure ain’t leaving without a fight.
5. “Pull the plug. But I’d like to learn your name. And holding on, well I hope you do the same”
 
This lyric is for Logan Schafer; really the only intriguing position player from our pitiful Minor League system.  The Crew is truly now paying the bill for 2008 and 2011. Young players like Brett Lawrie, Alcides Escobar, Lorenzo Cain and Michael Brantley would hypothetically be starting for the Crew right now had it not been for the trades to acquire C.C. Sabathia, Zack Greinke, and Shawn Marcum for short periods of time. Now, these trades were worth it every day of the week and twice on Sunday, but they have left the Brewers farm system looking like the one run by Uncle Owen and Aunt Berue after the imperial garrison stopped by looking for a couple of droids.
Players like the aforementioned Gennett, Caleb Gindl, Khris (with an h) Davis, and Sean “Game of Thrones” Halton, provide not one iota of long-term excitement. It is truly and tragically a group of AAAA journeyman that will amount to little more than a late night pot of stale coffee in the Show.
However, Schafer has shown a bit of a spark in his time in the majors. After a pretty dismal start to the season, Schafer has really picked it up recently. His slash line in July is .306/.346/.571 with 2 Home Runs and 2 Steals. Combined with some decent defense, highlighted by a stellar diving catch against the Marlins, Schafer looks like he may have some staying power if the Brewers decide to trade Aoki. I for one hope he stays long enough so others can get to learn his name over time as well.
6. “To carry on / We’ll carry on / And though you’re dead and gone believe me / Your memory will carry on”
 
“I miss him.” I said to myself on Tuesday as I was watching the All-Star game. Of course I said “eehm” for him because I like to talk like a sportscaster, but nevertheless. I was talking to myself about Prince Fielder; as he belly-flopped into third base with a triple.
It’s been a year and a half now and I’m still not over it. Why the Brewers consistently say they can’t pony up the dough for a super-duper star yet incinerate the equivalent annual dollars on a sum of middle reliever’s and washed up veteran starters that provide replacement level service is completely baffling/frustrating. Having Prince in the middle of the lineup for 162 games a year changes the entire complexion of a team, not only for the production at the plate but the mere psychology of the fact that you are going to have the leader of your team on the field running out every ground ball for 162 games a year. Prince was my favorite player and I wish he was still here; but believe me his memory will carry on.
7. “Big Willie Style’s all in it / Gettin Jiggy Wit It”
 
Wait? This isn’t an MCR lyric? It’s from Will Smith’s 1998 hit aptly titled, Gettin Jiggy Wit It?
Ok fine. But I still want to use it for the suddenly ferocious “Big Wily Style” Peralta.
Over his last three starts, Peralta has been nothing short of dominant. Over his last 21 1/3 innings, Peralta has allowed only one earned run and struck out 19 batters. His string of good performances actually extends back over his last five starts suggesting there may be some lasting power to what he is doing. Although I have been skeptical of Big Wily Style most of the last two years, I am really starting to like what I see. At 24 years old, there is plenty of room for improvement and if he can keep his head on straight and avoid “right handed Manny Para syndrome” the sky’s the limit for this dude. Now if he can just learn the feet shuffle-shoulder shrug dance from the video, I’ll have no problem with a full Big Wily endorsement.
8. “Do you remember that day when we met / you told me this gets harder / well it did”
 
-To George H.W. Roenicke.
Scene from the Brewers locker room last week:
 
Reporter: So Ron, after being handed the keys to the corvette in 2011, would you say life has gotten a bit harder recently?
G.H.W Roenicke: Well now, Tom, hold your horses. Now, I got a plan, see. A three point plan where we’re gonna get Brauny and Gomey and Aoki-y. We’re gonna gather are re-sources and stomp that Sa-da..er…those Cardinals right out.
Reporter 2: But you’re really piling up the losses Ron. Do you think you have a chance?
Roenicke: Hehehe. Well, it’s been tough…its’ been tough! But how many losses we’ve got? 58? 58. It’s scary…it’s scary.
Reporter 1: Ron, would you say that you are ready to throw in the towel for the year even though it is still only the halfway point?
Roenicke: Not gonna do it.
(Editor’s note – If you understood why this section is funny…bless your soul. If not, better not to try…just move on).
9.  “I’ve really been on a bender and it shows.”
 
Who else can this one go to, but Yovani Gallardo.
Rumors have swirled for a while now that Yo is a big proponent of Milwaukee’s local watering holes and that appeared to substantiate this spring when he was busted for drunk driving in Wauwatosa. Now nobody really knows if his Midwest-Amanda Bynes impersonation has anything to do with his awful performance this year except him, but one has to wonder.
Either way, Gallardo has pretty much disappointed me for the last time. After his brilliant performance against the Diamondbacks in the NLDS in 2011, I was certain that he was going to light the world on fire in 2012, even going so far as to lay a $50 futures bet down with my friend Weasel on Gallardo winning the Cy Young that year. Of course that never happened. Yovani did what he always does: threw a ton of pitches, struck out a ton of guys, walked a ton of guys and exited games far too early, far too often.
We always hoped that Yo would turn into the Verlander’s and Halladay’s of the league – with an ERA in the high two’s and a WHIP in the low ones. But he never evolved past the high three’s in ERA and high ones in WHIP. It might finally be time to face reality and realize that Yovani will never be the pitcher we hoped he would be.  If we can get a Tyler Skaggs or a Martin Perez for him, we should get it done ASAP perhaps even before old Yo can finish his next shot of Cuervo.
10. “Synthetic animals like me never have a home” 

It will be interesting to see where Brewers fans land on Ryan Braun when all of the smoke clears with the Biogenesis investigation. My friend Greg already refers to Braun as the “cheating loser.” Others I know continue to insist in his defense. And yet others are apathetic to the whole PED situation in general.  I suppose I continue to fall under the third category. I really just don’t care. If he gets caught, he deserves to be punished. If he doesn’t, then good for him; he worked the system. I just want to watch baseball and enjoy my leisure time. Generally, my leisure time is more improved when the teams I like are winning. And Braun helps the team I like win. So would I rather have him around than not have him around even if he turns out to be a “cheating loser”?

Yes.

11. “Hello Angel, tell me where are you / Tell me where we go from here”
 
So, where do we go from here?
It is fairly obvious that the Brewers are left with only two options going forward and to be totally honest, I would be fine with either one.
1. Trade every movable piece you have for prospects and build around Braun, Lucroy, Segura, Gomez and the influx of new prospects. This means you trade Ramirez, Weeks, K-rod, Axford, Gallardo, Lohse, Aoki, Gonzalez, Henderson. Basically hit the reset button and gather as many unknown resources as you possibly can, then spend the next two to three years throwing them against the wall until you get a few to stick. The core-four (TM New York Yankees) will keep the attendance going and hopefully morph into a quality team in three years. I could be easily talked into this option.
2.  Do absolutely nothing and chalk this year up to bad luck. If the Brewers do nothing except re-sign Corey Hart in the offseason ,next year’s lineup would look like this:
Aoki – RF
Segura –SS
Braun –LF
Ramirez – 3B
Hart – 1B
Gomez –CF
Lucroy – C
Weeks -2B
Pitcher
And the staff:
Gallardo
Lohse
Peralta
Estrada
Gorzelanny
On paper, that is a pretty good team. Assuming Big Wil continues his upward trend, Gallardo gets his head out of his ass, and maybe you make one move for a free-agent pitcher, it could be a REALLY good team.  So, I could also very easily be talked into this option. Hmmm.
So where do we go from here? I guess I really don’t know. I suppose I’ll leave that one up to the pros (you know, seeing as my opinion doesn’t really matter in the slightest anyway).
The only thing that I really know is this: Go out and buy some My Chemical Romance records; because unlike your favorite team’s sports seasons, good music never, ever dies. And if you hold on to hope for anything long enough…well, in the words of MCR:
“If you stay I will either wait all night / Or until my heart explodes / How long? / ‘Til we find our way in the dark and out of harm”
 
It gets better Brewer fans. It has to.

Rebuilding on a Crash Diet: The Brewers and a Calamitous May

To describe May, 2013 as an awful month for the Milwaukee Brewers would not do it justice.

In fact, the Brewers were downright putrid, winning only six games the entire month.  Their record in May was so bad (6-22) that it tied the worst month in franchise history: the August turned out by the 1969 Seattle Pilots, who ended the following season in bankruptcy, followed by a permanent road trip to become the Milwaukee Brewers.

The Brewers ended the month of April only a half game out of first place.  The Brewers ended the month of May 15 games behind the St. Louis Cardinals, managing the impressive feat of losing 14.5 games in the standings in one month.  Now that is a tailspin.

CoolStandings.Com currently gives the Brewers a 1 in 250 chance of making even the wild-card play-in game.  GM Doug Melvin admitted there is no chance the Brewers will be buyers this year at the trade deadline.  Rather, they will either be in a sell mode, seeking high-ceiling prospects a few years away, or keeping the assets they have, presumably only if they cannot get anything in return.  In short, the Brewers are suddenly rebuilding, and are focusing on  stocking up their farm system and developing controllable rotation talent.

But, rebuilding is a complicated topic in small markets like Milwaukee.  As Wendy Thurm has noted, the Brewers, with their limited geographic reach, have one of the smallest television contracts in the league.  Thus, the Brewers rely upon strong attendance to deliver profits for Mark Attanasio and his ownership group.  In recent years, the Brewers’ attendance fortunately has been some of the most impressive in baseball, particularly in comparison to the size of the Milwaukee metropolitan area.  Over the last five years, the Brewers have consistently approached or exceeded three million fans, despite challenging economic times.  So, one thing the Brewers cannot afford is a collapse akin to the mere 1.7 million fans they drew in 2003 during a terrible season — not if they want to make the investments in future talent required to make the franchise a perennial contender.

So, the Brewers face an obvious challenge: the team needs to lose enough games to obtain a prime draft position, and thereby maximize its chances to draft a top-ceiling player with minimum bust potential.  At the same time, the Brewers need to avoid losing in any drawn-out fashion, because a corresponding and sustained decline in attendance could hemorrhage desperately-needed cash from their balance sheet.  As Ryan Topp and others have argued, this need to maintain attendance in the short term seems to be one reason why the Brewers have systematically traded away what previously was an excellent farm system, with the apparent goal of maintaining the aura of a competitive team.

How does one navigate this problem?  Well, the best solution could be to experience a May like the Brewers just suffered.  Doing so addresses two problems: (1) it abruptly puts the team on course to get a top 5 draft pick, and (2) it achieves this result so abruptly, and in this case so early in the season, that the fan base can still — at least in theory —enjoy much-improved baseball for the remainder of the season without jeopardizing that draft slot.  In short, when you can take your medicine over the course of one month, instead of over an entire season, you really ought to do it.

As to the draft:

Thanks to May, the Brewers currently have the fifth-worst record in baseball at 23–37.  As of the morning of June 8, 2013, FanGraphs predicted that the Brewers will end the season tied for baseball’s fourth-worst record with the New York Mets at 73–89.  Provided that 2013’s top five draft picks all reach agreement with their teams, the Brewers are on pace for a top-5 draft slot in 2014.

The Brewers have not had a top-5 pick in the Rule 4 draft since 2005, when they picked some guy named Ryan Braun.  Before 2013, the top five slots in the draft provided, among others, Buster Posey (#5, 2008), Stephen Strasburg (#1, 2009), Manny Machado (#3, 2010), Dylan Bundy (#4, 2011), and Byron Buxton (#2, 2012) — the types of superstar prospects the Brewers have been denied for years, and which they need to anchor their next generation of players.  At the end of April, and before May occurred, the Brewers were on track for yet another mid-round pick slot.

As to the rest of the season:

It is unlikely that the Brewers will continue to suffer the combination of injuries and dreadful rotation pitching that helped ruin their May.  FanGraphs seems to agree, predicting that the current Brewers roster (or something like it) will essentially play .500 baseball for the rest of the season, even while maintaining one of the five worst records in the game.

Average baseball is not contending baseball, but average baseball at least would offer Brewers fans — already pleased with Miller Park’s immunity from rain delays — a reasonable likelihood of seeing a win on any given day.  In 2009, the Brewers were able to bring in over three million fans, despite finishing under .500 overall.  In 2010, the Brewers ended up eight games under .500, but still brought in 2.7 million fans.  It remains to be seen whether playing .500 baseball for the rest of the 2013 season would be sufficient to keep fans coming through the Miller Park turnstiles, but if so, the increasing remoteness of May could be a significant factor, particularly if the team can convince fans that “one bad month” does not represent the current Miller Park experience or true caliber of the team.

Of course, it is also possible that the Brewers will be able to trade significant assets at the deadline in exchange for the prospects Doug Melvin wants.  If so, their projected record could, and probably would decline.  (This is necessarily not a bad thing, given that 68.5 wins is the average cut-off to secure a top 5 draft spot from 2003 through 2012).  If that happens, the Brewers will have a further challenge on their hands in trying to provide even average baseball for their fans, and maintain the attendance they need.

That said, the Brewers’ remarkable close to 2012 — an incredible .610 winning percentage from August through October — was accomplished after trading away Zack Greinke and calling up minor league talent to plug gaps in the rotation left by Greinke’s trade and Shaun Marcum’s injuries.  If the Brewers are once again able to make advantageous trades at the deadline, and also able to play even .500 ball for the rest of the year, they are still in a position to do so without hurting their chances to get the impact player they need in the 2014 Rule 4 draft.

If they can pull both of these things off, much of the thanks should be given to the horrible month of May.


Chris Davis’s Oddly Historic Season So Far

A lot of ink (and pixels) have been spilled about Chris Davis’ great season.  It’s hard to overstate just how great a .337/.432/.721 start through roughly one-third of the season is, especially in this renewed era of depressed offense.  MLB’s .722 OPS this year so far ranks it as Baseball’s second-lowest since 1992’s .700.  (2011 = .720)  Quite straight, Davis is having the best offensive season in the American League of any player whose first name is not some variation of “Michael”.

Here’s yet another data point for you to chew on: Chris Davis is on track to have one of the highest extra-base hit (XBH) to plate appearance (PA) ratios in history.

As of the morning of Memorial Day 2013, Davis has hit an XBH in 16.5% of his PAs.  In conversational terms, he hits an XBH about every six times he steps to the plate.

If Davis were to end the season with this ratio and qualify for a batting championship, it would rank second in history behind this other guy’s pretty good season.

In fact, only nine qualified players in modern history have ever had an XBH-PA ratio of greater than 15% over the course of an entire season.  Here is the list, with Davis’s 2013 added for context:

Rk Player Year XBH PA XBH %
1 Babe Ruth 1921 119 693 17.2%
2 Chris Davis 2013 34 206 16.5%
3 Albert Belle 1995 103 631 16.3%
4 Lou Gehrig 1927 117 717 16.3%
5 Barry Bonds 2001 107 664 16.1%
6 Babe Ruth 1920 99 616 16.1%
7 Jeff Bagwell 1994 73 479 15.2%
8 Al Simmons 1930 93 611 15.2%
9 Albert Belle 1994 73 480 15.2%
10 Todd Helton 2001 105 697 15.1%

You may have noticed that 30% of the players on this list are named either Al or Albert, but none of them are named Pujols.  None of them are named Miguel, either.  In fact, the closest the reigning American League Triple Crown winner has come to cracking this list was in 2010 with a 13.0% XBH-PA ratio, and as of this morning he sits well out of range in 2013 at 12.5%, despite his own empirically otherworldly start.

This is, without a doubt, a most exclusive list of a most consistently slugging nature.  It’s enough to send pitchers into grand mal seizures at the very contemplation of this.  Or perhaps more exactly, it might if they were even aware of it.  This data point has probably not yet been illuminated in quite this way—this here article is the closest I myself have found so far, and Davis is not even the star of the piece.  But that does not mitigate the impressiveness of this feat of his so far.

This is not to say that Chris Davis is a better hitter than Miguel Cabrera, or Albert Pujols or Joey Votto or even Shin Soo Choo, for that matter.  But even if this does turn out to be a world class-level fluke season for him, Davis has a chance to crack an elite list inhabited only by the greatest of the great, even if he never knows it.


Does it matter which side of the pitching rubber a pitcher starts from throwing a sinker?

As we start a new baseball season, I start a new season of my own. This is my first – of many I hope – analysis and write-up on baseball that I am submitting. I am an avid fan, a numbers geek, an aspiring writer and lastly a bored software engineer. I am also very fortunate. I have a close connection with a former major league player and the ability to leverage his vast experience and knowledge of the game. Hopefully, I can parlay the knowledge I have learned from many years of observation along with the knowledge I have gleaned from my connection to realize my goal as a contributor to the sabermetric community and to the enjoyment of baseball fans everywhere. Here we go!

Question

Is the effectiveness of a sinker dependent on from which side of the rubber the pitcher throws?

I was in Florida in mid March for spring training, talking with a minor league coach when he mentioned that he and a former all star pitcher were in a disagreement about how to throw a sinker. Their debate centers on where a pitcher should stand on the rubber to throw a sinker most effectively. We all understand that a pitcher should not move all over the rubber to become more effective on a single pitch. This would obviously tip off the hitters as to what type of pitch might be coming. But for argument’s sake, a team might have some newly transformed position players learning to throw different pitches. Wouldn’t a team want to know if, for some pitches, it was more beneficial to stand on one side of the rubber than another?

I consider myself a pretty observant guy, but I will have to admit that I never really paid much attention to where a pitcher stood on the rubber. To me the juicy part is watching the ball just after it is released. The dance, dip, duck and dive a pitcher is able to command of the ball is where the action is as far as I am concerned. So watching what a pitcher does before he even starts his motion was asking a little much. Nonetheless, I was certain that with so many pitchers in the majors, that a breakdown of data would show that there was not a singular starting point on the rubber. Every pitcher is different, right?

Setup

I started my analysis by downloading the last 4 years (2009-2012) of PitchFx data. Most of us know this already but by using PitchFx data there are some limitations to analysis. Unlike Trackman, PitchFx initially records each pitch at 50’ from home plate, not the actual release point of the pitch. For PitchFx this data point is called “x0”, and for all intents and purposes this is pretty good data, as for most pitchers their strides are approximately 5 to 6’ from the rubber, and with arms length added in we are talking about a difference of a couple of percentage points from being the same as the release point metric from Trackman. But full disclosure, it is not exactly the release point. Another factor that I didn’t measure is a pitcher’s motion to the plate. Some pitchers throw “across” their bodies and not down a straight line, and even fewer open up their body to the batter (stepping to stride leg’s baseline). Also, there is probably a bit to glean from going between the stretch and wind-up, but again without doing a very in-depth study I assume no factor in the analysis. Lastly, arm length is an unmeasured factor. For example, I didn’t check to see if there were any right-handed pitchers with extra long arms standing on the first-base side of the rubber distorting the data.

I started by combining the PitchFx Sinker (SI) and Two-seam fastball (FT) data into a single database. The reason to combine the data is due to the fact that the grips for each pitch are the same, combine this with a two-seam fastball can and a sinker break the same way (down and in to a RH batter from a RH pitcher), and lastly they are also somewhat synonymous in major league vernacular. Maybe somewhere along the line the pitch was invented twice (north or south), the name given is based on region like when asking for a Coke… it’s a “soda”, a “pop”, or a “tonic” depending on where you are in the states. Maybe in the South it was labeled a sinker and the North it was taught as a “two-seamer”? Either way it’s the same pitch as far as I am concerned, and the etymology of pitch naming is a different topic for a different time.

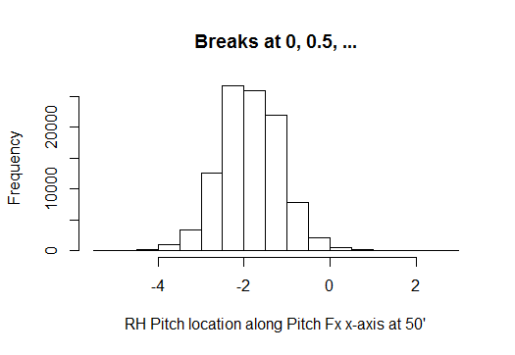
Back to the question above about every pitcher being different, I was wrong. Using the 2012 data I created a frequency distribution for right-handed pitchers (figure 1), and as you can see there is definite focal area at around -2’ point from the centerline of the pitching rubber (and home plate).

Image

Figure 1 – Right-handed pitchers in 2012

This shows that most pitchers start from about the same side; which I determined to be the right side of the rubber (3rd base side). I determined this by adding 9” to one-half the length of the pitching rubber (24”) which comes to 21” (9”+12”). Add in arm length and you can see that using an x0 that is less than or equal to 2’ (remember we are using negatives here) should prove that the pitcher is throwing from the right side.  I would like to add that the 9” used above is based on the shoulder width of an average man, which is around 18”. This metric is based on studies on the “biacromial diameter” of male shoulders in 1970 (pg. 28 Vital and Health Statistics – Data from the National Health Survey). I think we can all agree that the 18” is probably conservative by today’s growth standards. I mentioned in the limitations of the analysis written above, I don’t account for arm length or pitcher motion. Therefore I needed to make sure that there are right-handed pitchers who are throwing from the left hand side of the rubber; just not a bunch of super long-armed, cross bodied throwers.  With the data in hand I was able to identify which pitchers had thrown the ball closer to centerline of the rubber and therefore would be good candidates for standing on the left side of the rubber. The first pitcher who had a higher (>-2) x0 value was Yovani Gallardo of the Milwaukee Brewers. Without knowing Gallardo’s motion I needed to go to the video. From the video, you can clearly see that Gallardo starts on the left side of the rubber and throws fairly conventionally, straight down the line to the batter.

I wanted to keep this as simple as possible, breaking up the pitchers in two categories – Left side or Right side. Without looking at video for each pitcher I had to come up with a tipping point for classifying the side based on the x0 data I had available. If we simply take what we determined above and correlate it to the left hand side we will come up with 1 (starting on left side of rubber) and an x0 of 0. But it isn’t quite that simple. The frequency chart shows that there are less than 1000 balls thrown in 2012 with an x0 greater than or equal to 0. Gallardo threw 504 pitches himself in 2012. So we have to increase the scope a bit. By arranging the x0 data into quartiles we see that upper or lower quartile – depending on handedness – is around -1 or 1 (remember we are using negatives) so for a right handed pitcher the x0 splits are:

Min

25%

Med

Avg

75%

Max

-5.264

-2.315

-1.868

-1.849

-1.372

2.747


For left handers:

Min

25%

Med

Avg

75%

Max

-3.787

1.455

1.953

1.924

2.401

5.378


As I am trying to stay conservative, and the fact that these are not release point numbers I use 1 and -1 as the cut off for classification based on the handedness of the pitcher. Using these numbers provided a pretty clean break in the distributions (90-10%).

Findings

So who was right, the all star pitcher or the minor league pitching coach? Is there an advantage depending on where the pitcher stands on the rubber? Neither – both of them. It’s a tie.

What can I say; my initial analysis is a bit anticlimactic, but not because of lack of effort.  To denote the labels below:

  • LH or RH (Handedness)
  • RR or LR (Right or Left Rubber)
  • B – Balls
  • K – Strikes
  • P – In play (No Outs)
  • O – In play (Outs)
  • BackK – Called Strikes
  • FT – Two seam fastballs
  • SI – Sinkers
  • Efficiency – O/(P+O)
  • XSide – Cross Side (i.e. RH-LR or LH-RR)
  • Same side – LH-LR or RH-RR


LHData

194487

pitches
LH_LR

173145

89.03%

LH_RR

21342

10.97%

LH_LR_B

62957

36.36%

LH_RR_B

7932

37.17%

LH_LR_K

75241

43.46%

LH_RR_K

9067

42.48%

LH_LR_O

22610

13.06%

LH_RR_O

2843

13.32%

LH_LR_P

12335

7.12%

LH_RR_P

1500

7.03%

LH_LR_FT

108600

62.72%

LH_RR_FT

15846

74.25%

LH_LR_SI

64545

37.28%

LH_RR_SI

5496

25.75%

LH_LR_BackK

34932

46.43%

LH_RR_BackK

4406

48.59%

RHData

473032

pitches
RH_LR

48791

10.31%

RH_RR

424241

89.69%

RH_LR_B

18266

37.44%

RH_RR_B

153014

36.07%

RH_LR_K

20486

41.99%

RH_RR_K

180611

42.57%

RH_LR_O

6453

13.23%

RH_RR_O

58895

13.88%

RH_LR_P

3583

7.34%

RH_RR_P

32459

7.65%

RH_LR_FT

21781

44.64%

RH_RR_FT

194582

45.87%

RH_LR_SI

27010

55.36%

RH_RR_SI

229659

54.13%

RH_LR_BackK

10520

51.35%

RH_RR_BackK

82482

45.67%

Xside  667519

pitches

Same Side
LH_RR&RH_LR

70133

10.51%

LH_LR&RH_RR

597386

89.49%

LH_RR&RH_LR_B

26198

37.35%

LH_LR&RH_RR_B

215971

36.15%

LH_RR&RH_LR_K

29553

42.14%

LH_LR&RH_RR_K

255852

42.83%

LH_RR&RH_LR_O

9296

13.25%

LH_LR&RH_RR_O

81505

13.64%

LH_RR&RH_LR_P

5083

7.25%

LH_LR&RH_RR_P

44794

7.50%

LH_RR&RH_LR_FT

37627

53.65%

LH_LR&RH_RR_FT

303182

50.75%

LH_RR&RH_LR_SI

32506

46.35%

LH_LR&RH_RR_SI

294204

49.25%

BackK

14926

50.51%

BackK

117414

45.89%

Efficiency

64.65%

Efficiency

64.53%


The efficiency is so very close. Twelve-hundredths (.12) of a percent is not a lot – 169 outs out of 140678 – but give any Chicago Cub fan five of those outs in 2003 and Mr. Bartman would be an afterthought. Which, I am sure is the way he and all Cub fans around the world would like it. The efficiency is the same, no other way to put it which is the beauty of statistics and sabermetrics. Numbers can say so much, even when they are the equal.

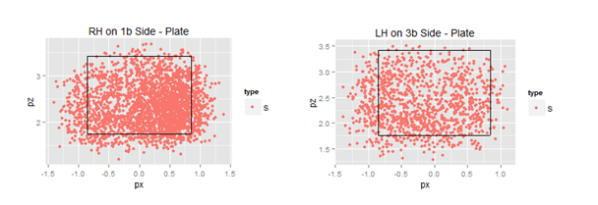
But the analysis wasn’t all for naught, there are some nuggets to glean from the numbers above. As a segue, I am currently watching Derek Lowe of the Texas Rangers pitch on opening night and from the left side of the rubber he throws a sinker and it dips back over the rear part of the plate for a called strike. With all of the similarities within my analysis the most striking observation is the difference in called strikes depending on the side of the rubber. If a pitcher, coach or manager could get a strike or a strike out without the fear of having a batter get a hit or moving a runner forward they would do it every time. With a five percent difference in getting a strike and not having the worry of the ball being put into play would be an interesting thing to know in some tight situations with runners on base. My thought on the difference revolves around the back door being open a little wider when it comes to getting called strikes. With a pitcher throwing X-side you can definitely see a pattern of called strikes on the same side of the plate from which the pitcher throws from. Positive numbers in figures below indicate right side of plate (1st base side)

Image

With today’s specialization where pitchers are matched up to batters based on handedness, the ability for a pitcher to throw a strike as it tails back over the plate or close to the plate (or maybe not even close for some of the pitches above ) is essential. It appears that umpires are a little more flexible with their perception of the strike zone for these pitchers as well.

Closing

I didn’t get the results that I anticipated when I started this analysis, and that is great! As a society we are determined to have a winner! Just as there is “no crying in baseball”, there are no ties in baseball. Even when there is a tie; like on a close play at first – it proverbially goes to the runner. We can’t settle for a tie…. hockey reduced ties by adding a shootout after overtime.  College football removed the tie by introducing sudden death (hopefully the bowl playoff with help eliminate the subjective BCS tie). With no clear cut advantage (read – TIE) identified in my analysis means that a more in depth analysis could/should be performed to validate. Maybe expanding the percentage of X-side pitchers to 15-20, or identifying when pitchers are throwing from the stretch and removing those instances would alter the results and provide a much needed winner? If after all analytical statistical avenues have been exhausted there’s still not a proven advantage, we can always resort to having the coach and player settle it with a coin flip?


Bill “Moneyball” Veeck

I was sitting on a park bench reading Veeck as in Wreck, the memoir of legendary ballclub owner Bill Veeck, when I came across this passage:

Ken Keltner, our third baseman and one-time power hitter, had a miserable season in 1946. There seemed little doubt that he was on the downgrade. Still, when I signed him for the next year, I gave him the same amount of money and told him that if he had what I considered a good year I’d give him a bonus of $5,000.

The next year, Kenny hit the ball better than anybody on our club, with less luck than anybody in the league. If you walked into the park late and saw somebody making a sensational leaping, diving backhanded catch, you could bet that Keltner had hit the ball.

On the last day of the season, he was hitting under .260 and had driven in around 75 runs. I called down to the locker room, got him on the phone, and said, “Hey, where have you been? Weren’t you supposed to come up and see me at the end of the season?”

“I didn’t win anything,” he said. “I’m having a lousy season.”

I suggested that he wander up anyway. As he came through the door I said, “I’ve got $5,000 for you.”

And he said, “I didn’t earn it, Bill.” And he started to weep.

“You hit the ball better than anybody else on this club,” I told him. “It wasn’t your fault they kept catching it.”

As a loyal FanGraphs reader, I immediately thought: BABIP! For those who need a quick reminder, batting average on balls in play (BABIP) measures just that: batting average on balls hit somewhere the defense can get to them. It’s expected that BABIP will generally hover around .300, modified by such factors as the enemy defense (this averages out over a season), whether the balls you hit go over outfield fences, and, most of all, luck.

Now, Veeck’s comment that Keltner “hit the ball better than anybody else” was probably a kindness rather than a hypothesis. But his observation that “they kept catching it” checks out. I looked at the leaderboard for the BABIPs of every qualifying hitter in 1947. Sure enough, Ken Keltner’s down near the bottom, ranking 68th of 86 with a BABIP of .264. The median that year was almost thirty points higher: .292.

Ken Keltner had lousy luck, but was still an average hitter (102 wRC+). And the next year was the best of his career (7.9 WAR), so it looks like Bill Veeck saw the Keltner case exactly right. Only there’s a twist. One of Veeck’s 1947 Indians had it even worse. Down there at 74th is the .256 BABIP of Joe Gordon. Joe Gordon slugged 27 doubles, 6 triples, and 29 home runs, so things turned out well for him, but if Veeck’s latecomer had bet that “a sensational leaping, diving backhanded catch” was on a ball hit by Ken Keltner, you’d want to bet against him. Joe Gordon’s luck was worse; he compensated by putting more balls in the outfield bleachers.

There’s weirder to come. Dead last, 86th of 86, is Roy Cullenbine, Tigers first baseman, who paired a grotesque .206 BABIP and .224 average (83rd of 86) with the second-highest walk rate in baseball. His 22.6% walk rate was topped only by Triple Crown winner Ted Williams. (By the way, in the previous year, Williams had been introduced to the defensive shift, as pioneered by, yes, Bill Veeck’s Indians.)

No player in 2012 came close to matching Cullenbine’s bizarre season. The lowest BABIP of any qualifying hitter in 2012 was .242 (Justin Smoak); of all hitters with BABIPs below .256 (fifty points higher than Roy Cullenbine’s), none came within fifty points of Cullenbine’s .401 OBP. The best analogy is this: Cullenbine hit for average like Dan Uggla, had Justin Smoak’s luck, and still drew walks at the rate of Barry Bonds.

Roy Cullenbine was only 33 in 1947, and in past years his offensive numbers were impressive. Had he been on Bill Veeck’s Indians instead of playing for the Tigers, his unlucky 1947 might have ended as Ken Keltner’s did,with a $5,000 bonus. The Tigers, not valuing Cullenbine’s patience, released him, and he never played a major-league game again.

There’s another interesting name among the ten unluckiest batters of 1947. Coming in at sixth-worst, with a BABIP of .247, is a patient slugger who got on base even more than Cullenbine did, with four more walks than he had hits. He too retired after the season. His name was Hank Greenberg, and that winter he accepted a job in a major-league front office, where he was groomed to be the team’s next general manager. The team was the Cleveland Indians. His new boss was Bill Veeck.


The True Dickey Effect

Most people that try to analyze this Dickey effect tend to group all the pitchers that follow in to one grouping with one ERA and compare to the total ERA of the bullpen or rotation. This is a simplistic and non-descriptive way of analyzing the effect and does not look at the how often the pitchers are pitching not after Dickey.

I decided to determine if there truly is an effect on pitchers’ statistics (ERA, WHIP, K%, BB%) who follow Dickey in relief and the starters of the next game against the same team. I went through every game that Dickey has pitched and recorded the stats (IP, TBF, H, ER, BB, K) of each reliever individually and the stats of the next starting pitcher if the next game was against the same team. I did this for each season. I then took the pitchers’ stats for the whole year and subtracted their stats from their following Dickey stats to have their stats when they did not follow Dickey. I summed the stats for following Dickey and weighted each pitcher based on the batters he faced over the total batters faced after Dickey. I then calculated the rate stats from the total. This weight was then applied to the not after Dickey stats. So for example if Francisco faced 19.11% of batters after Dickey, it was adjusted so that he also faced 19.11% of the batters not after Dickey. This gives an effective way of comparing the statistics and an accurate relationship can be determined. The not after Dickey stats were then summed and the rate stats were calculated as well. The two rate stats after Dickey and not after Dickey were compared using this formula (afterDickeySTAT-notafterDickeySTAT)/notafterDickeySTAT. This tells me how much better or worse relievers or starters did when following Dickey in the form of a percentage.

I then added the stats after Dickey for starters and relievers from all three years and the stats not after Dickey and I applied the same technique of weighting the sample so that if Niese’12 faced 10.9% of all starter batters faced following a Dickey start against the same team, it was adjusted so that he faced 10.9% of the batters faced by starters not after Dickey (only the starters that pitched after Dickey that season). The same technique was used from the year to year technique and a total % for each stat was calculated.

Here is the weighted year by year breakdown of the starters’ statistics following Dickey and a total (- indicates a decrease which is desired for all stats except K%):

2012:
ERA: -46.94%  with 5/5 starters seeing a decrease
WHIP: -16.16% with 4/5 seeing a decrease
K%: 47.04% with 4/5 seeing an increase
BB%: 6.50% with 3/5 seeing a decrease
HR%: -50.53% with 5/5 seeing a decrease
BABIP: -14.08% with 4/5 seeing a decrease
FIP: -25.17% with 5/5 seeing a decrease

2011:
ERA: 17.92%  with 0/3 seeing a decrease
WHIP: -9.63% with 2/3 seeing a decrease
K%: -2.64% with 2/3 seeing an increase
BB%: -15.94% with 2/3 seeing a decrease
HR%: -9.21% with 2/3 seeing a decrease
BABIP: -15.14% with 2/3 seeing a decrease
FIP: -5.58% with 2/3 seeing a decrease

2010:
ERA: -23.82%  with 5/7 seeing a decrease
WHIP: 1.68% with 5/7 seeing a decrease
K%: -22.91% with 1/7 seeing an increase
BB%: -2.34% with 5/7 seeing a decrease
HR%: -43.61% with 5/7 seeing a decrease
BABIP: -3.61% with 4/7 seeing a decrease
FIP: -10.61% with 5/7 seeing a decrease

Total:
ERA: -17.21%  with 10/15 seeing a decrease
WHIP: -8.10% with 11/15 seeing a decrease
K%: -3.38% with 7/15 seeing an increase
BB%: -5.17% with 10/15 seeing a decrease
HR%: -32.96% with 12/15 seeing a decrease
BABIP: -11.04% with 10/15 seeing a decrease
FIP: -13.34% with 12/15 seeing a decrease

So for starters that pitch in games following Dickey against the same team, it can be concluded that there is an effect on ERA, WHIP, BABIP, and FIP and a slight effect on BB% and on K%. There is also a large effect on HR rates which we can attribute the ERA effect to. This also tells us that batters are making worse contact the day after Dickey.

So a starter (like Morrow) who follows Dickey against the same team can expect to see around a 17.2% reduction in his ERA that game compared to if he was not following Dickey against the same opponent. For example if Morrow had a 3.00 ERA in games not after Dickey he can expect a 2.48 ERA in games after Dickey.

So if in a full season where Morrow follows Dickey against the same team 66% of the time (games 2 and 3 of a series) in which he normally would have a 3.00 ERA without Dickey ahead of him, he could expect a 2.66 ERA for the season. This seams to be a significant improvement and would equate to a 7.6 run difference (or 0.8 WAR) over 200 innings.

Here is a year by year breakdown of relievers after Dickey (these are smaller sample sizes so I will not include how many relievers saw an increase or decrease):

2012:
ERA: -25.51%
WHIP: -1.57%
K%: 27.04%
BB%: -49.25%
HR%: -34.66%
BABIP: 30.23%
FIP: -38.34%

2011:
ERA: -17.43%
WHIP: 8.45%
K%: 6.74%
BB%: -5.14%
HR%: 7.34%
BABIP: 9.75%
FIP: -2.05%

2010:
ERA: -2.55%
WHIP: 7.69%
K%: -9.28%
BB%: 10.84%
HR%: 2.11%
BABIP: 4.23%
FIP: 9.43%

Total:
ERA: -16.61%
WHIP: 5.38%
K%: 7.50%
BB%: -12.65%
HR%: -8.53%
BABIP: 13.38%
FIP: -10.40%

As expected there was a good effect on the relievers’ ERA, FIP, K%, and BB%, but the WHIP and BABIP were affected negatively. This tells me that the batters were more free swinging after just seeing Dickey (more hits, less walks, more strikeouts).

So in a season where there are 55 IP after Dickey in games (like in 2012) there would be a 16.6% reduction in runs given up in those 55 innings. If the bullpen’s ERA is 4.20 without Dickey it can be expected to be 3.50 after Dickey. Over 55 IP this difference would save 4.3 runs (or 0.4 WAR).

Combine this with the saved starter runs and you get 11.9 runs saved or (1.2 WAR). This is Dickey’s underlying value with the team that he creates by baffling hitters. This 1.2 WAR is if Morrow has a 3.00 ERA normally and the bullpen has a 4.00 ERA. If Morrow normally had a 4.00 ERA than his ERA would reduce to 3.54 over the season with 10.2 runs saved for 200 innings (1.0 WAR) and if the bullpen has a 4.00 ERA normally as well, 4.1 runs would be saved there, equating to 14.3 runs saved or a 1.4 WAR over a season.


Introducing BERA: Another ERA Estimator to Confuse You All

Coming up with BERA… like its [almost] namesake might say, it was 90% mental, and the other half was physical.  OK, maybe he’d say something more along the lines of “what the hell is this…” but that’s beside the point.    By BERA, I mean BABIP-estimating ERA (or something like that… maybe one of you can come up with something fancier).  It’s an ERA estimator that’s along the lines of SIERA, only it’s simpler, and—dare I say—better.

You know, I started out not knowing where I was going, so I was worried I might not get there.  As you may recall, I’ve been pondering pitcher BABIPs for a little while here (see article 1 and article 2), and whereas my focus thus far had been on explaining big-picture, long-term BABIP stuff in terms of batted ball data, one question that remained was how well this info could be used to predict future BABIPs.  After monkeying around with answering that question, though, I saw that SIERA’s BABIP component could be improved upon, so I set to work in coming up with BERA.  In doing so, I definitely piggybacked off of FIP and a little of what SIERA had already done.  You can observe a lot just by watching, you know.   I’m also a believer in “less is more” (except for when it comes to the size of my articles, obviously), so I tried to go for the best compromise of simplicity and accuracy that I could.

Read the rest of this entry »


BABIP and Innings Pitched (Plus, Explaining Popups)

In my last post on explaining pitchers’ BABIPs by way of their batted ball rates, I was very careful to say that it was applicable in the long run, as it’s hard to be accurate over a short number of innings pitched, due to all the “noise” in BABIP (Batting Average on Balls In Play).  I only used pitchers with a qualifying number of innings pitched (IP) in the calculations, for that reason.  After writing the post, I did some messing around with the data, to find out just how much of an effect IP had on the predictability of BABIP.

Hold on to your propeller beanies, fellow stat geeks: the correlation between xBABIP and BABIP went from 0.805 when the minimum IP was set to 1500, to 0.632 at a 200 IP minimum, down to 0.518 at 50 IP.  OK, maybe it’s not that surprising.  Still, I thought I’d better show you how confident you can be in my xBABIP formula’s accuracy when you take the pitcher’s innings pitched into account.

The formula, again: xBABIP = 0.4*LD% – 0.6*FB%*IFFB% + 0.235

And remember, that formula is primarily meant to be a backwards-looking estimator of “true,” defense-neutral BABIP.  My next article will (probably) discuss another formula I’ve come up with that’s more forward-looking.

Read the rest of this entry »


Projecting BABIP Using Batted Ball Data

Hi everybody, this is my first post here. Today, I’ll be sharing some of my BABIP research with you. There will probably be several more in the near future.

Now, I don’t know about you, but Voros McCracken’s famous thesis stating that pitchers have practically no control over their batting average on balls in play (BABIP) always seemed counterintuitive to me, ever since I heard it about 10 years ago. Basically, my thought this whole time was that if an Average Joe were pitching to an MLB lineup, the hitters would rarely be fooled by the pitches, and would be crushing most of them, making it very tough on the fielders. Think Home Run Derby (only with a lot more walks). Now, the worst MLB pitcher is a lot closer in ability to the best pitcher than he is to an Average Joe, but there still must be a spectrum amongst MLB pitchers relating to their BABIP, I figured. After crunching some numbers, I have to say that intuition hasn’t completely failed me.

This is going to be a long article, so if you want the main point right here, right now, it’s this: in the long run, about 40% or more of the difference in pitchers’ BABIPs can be explained by two factors that are independent of their team’s defense: how often batters hit infield fly balls and line drives off of them. It is more difficult to predict on a yearly basis, where I can only say that those factors can predict over 22% of the difference. Line drive rates are fairly inconsistent, but pop fly rates are among the more predictable pitching stats (about as much as K/BB). I’ll explain the formula at the very end of the article.

Read the rest of this entry »