Archive for Outside the Box

Inverse Clayton Kershaw

Clayton Kershaw is great. Really really great. Maybe hurt — but definitely great. But I’m not interested in examining Clayton Kershaw; I’m interested in examining Inverse Clayton Kershaw. I want to find the pitchers that have been most unlike Kershaw during the last calendar year. Kershaw has been the best — I want to find the worst.

Clayton Kershaw vs. League Average – Past Calendar Year
ERA FIP xFIP K% BB% HR/9 SwStr%
Clayton Kershaw 1.50 1.56 2.08 33.8% 2.9% 0.36 16.1%
League Average 4.13  4.11 4.07 20.8% 8.5% 1.11 10.0%
Difference -2.63 -2.55 -1.99 13.0% -5.6% -0.75 6.1%
Inverse Kershaw 6.76 6.66 6.06 7.8% 14.1% 1.86 3.9%
Data pulled 6/29/16

So wow. Did I mention Kershaw is great? Anyway, time to find Inverse Kershaw. First, I want to point out that the players below are still incredible at baseball. They are some of the most elite in the world, way better than all of us. Caveat aside, I’ll now examine the pitchers over the past calendar year who are most unlike Kershaw in each of the stats above — i.e. if Kershaw’s ERA is 2.63 below league average, whose is 2.63 above league average. When in doubt, I’ll defer to the guy with the most IP. At the end, I will name the Inverse Kershaw!

ERA

So, whose ERA has been a whopping 2.63 runs above league average? Coming in with an ERA of 6.75 we have Carlos Contreras. Contreras pitched 18.2 innings within the last year for the Reds out of the bullpen. You probably expected some 2016 Reds relievers to qualify, but Contreras posted these numbers exclusively in 2015 and then did not make the 2016 Reds bullpen. Yikes.

FIP

Noe Ramirez has worked to a 6.65 FIP in 24 IP for the Red Sox over the last year. Prior to 2016, then lead prospect analyst Dan Farnsworth said of Ramirez, “his stuff likely isn’t good enough to be more than bullpen filler.” Maybe not even that good.

xFIP

Well I’ll be damned. With 18.2 IP with an xFIP of 6.05 out of the Reds bullpen we have…Carlos Contreras.

K%

With a K% of exactly 7.8%, we find the final 13 IP of Dodger right-hander Carlos Frias‘ 2015 season (he hasn’t pitched yet in 2016). As a Cistulli darling, I imagine this is just a speed bump in Frias’ journey to becoming a Cy Young winner.

BB%

In 39.2 IP, Elvis Araujo of the Phillies has walked 14.0% of batters faced. In related news, Araujo was optioned to Triple-A Lehigh Valley on June 26.

HR/9

Matching our criteria exactly with 1.86 HR/9 allowed in 67.2 IP is Toronto starter Drew Hutchison. This figure doesn’t factor in his excellent work in Triple-A (.77 HR/9 allowed), and according to the Toronto Sun, Hutchison figures to be called up soon. Hopefully he can get the gopheritis under control and contribute for the Jays down the stretch.

SwStr%

I made a judgement call here. The pitcher with the most IP within 0.2% of the required 3.9% SwStr% is Jon Moscot and his 4.1% SwStr%. Moscot has posted that rate across 21.1 IP in five starts for the…gulp…Reds this year. Poor Reds fans.

The Inverse Kershaw

It is all fine and good (bad) to post inverse Kershaw numbers in one category, but I wanted to know the single pitcher that was most unlike Clayton Kershaw. More accurately, I wanted to find the pitcher whose performance has been as far below average as Kershaw’s has been above average. To do this, I began with a sample of all pitchers appearing in MLB over the last calendar year. I then calculated the number of standard deviations each of their component statistics were from the Inverse Kershaw numbers in the table above. The pitcher with the lowest sum of standard deviations will be named the Inverse Kershaw. This is exactly the methodology used by Jeff Sullivan for his pitch comps.

And the winner (loser?) is….Matt Harrison, formerly of the Texas Rangers, currently of the Phillies Disabled List. You may remember Harrison as the salary dump portion of the Cole Hamels to the Rangers trade. You will hopefully now remember him as the past calendar year’s Inverse Kershaw. The final numbers are below.

Clayton Kershaw vs. Matt Harrison – Past Calendar Year
ERA FIP xFIP K% BB% HR/9 SwStr%
Clayton Kershaw 1.50 1.56 2.08 33.8% 2.9% 0.36 16.1%
League Average 4.13  4.11 4.07 20.8% 8.5% 1.11 10.0%
Inverse Kershaw 6.76 6.66 6.06 7.8% 14.1% 1.86 3.9%
Matt Harrison 6.75 6.07 5.66 7.3% 8.7% 1.69 3.3%
Data pulled 6/29/16

So there you have it, the pitcher coming closest to being as far below average as Clayton Kershaw has been above average over the last year is Matt Harrison — the Inverse Kershaw. Just for fun, here is the same table as above, subbing out the 2016 Reds Bullpen for Matt Harrison.

Clayton Kershaw vs. Matt Harrison – Past Calendar Year
ERA FIP xFIP K% BB% HR/9 SwStr%
Clayton Kershaw 1.50 1.56 2.08 33.8% 2.9% 0.36 16.1%
League Average 4.13  4.11 4.07 20.8% 8.5% 1.11 10.0%
Inverse Kershaw 6.76 6.66 6.06 7.8% 14.1% 1.86 3.9%
2016 Reds Bullpen 6.08 6.02 5.16 18.9% 11.9% 1.95 9.7%
Data pulled 6/29/16

Poor Reds fans.


Identifying HR/FB Surgers Using Statcast

It seems that 2016 will be the year that Statcast begins to permeate Fantasy Baseball analysis. Recently there has been a wealth of articles exploring the possibilities of using these kinds of data. These pieces have provided relevant insights on how to improve our understanding of well-hit balls and launch angles. Also, they’ve facilitated access to information on exit velocity leaders and surgers, as well as provided thoughtful analyses to the possible workings behind some early-season breakouts.

However, there is still a lot we don’t know about Statcast data. For instance, we are uncertain of how consistent these skills are over time, both across seasons or within seasons. Also we don’t know what constitutes a relevant sample size or when rates are likely to stabilize. All in all, this makes using 2016 Statcast data to predict rest of season performance a potentially brash and faulty proposition. Having said that, we can’t help but to try; so here’s our attempt at using early-season 2016 Statcast data to partially predict future performance.

One of the early gospels of Statcast data analysis posits that the “sweet spot” for hitting homers comes from a combination of a launch angle in the range of 25 – 30 degrees and a 95+ MPH exit velocity. If this is indeed the ideal combination for hitting home runs, one could argue that players that have a higher share of fly balls that meet these criteria should perform better in other more traditional metrics such as HR/FB%.

Following this line of thought we dug up all the batted balls under the “sweet spot” criteria, and divided them by all balls hit at a launch angle of 25 degrees or higher (which MLB determines as fly balls) to come up with a Sweet Spot%. In an attempt to identify potential HR/FB% surgers, we compare Sweet Spot% and HR/FB% z-scores (to normalize each rate) for all qualified hitters with at least 25 fly balls and highlight the biggest gaps.  Here are the Top five gaps considering the games up to May 28th:

Name Team HR/FB  % HR/FB  %         Z-Score Sweet Spot % Sweet Spot % Z-Score Z-Score Diff
Kole Calhoun Angels 6% -1.15 26% 2.24 3.39
Stephen Piscotty Cardinals 11% -0.35 26% 2.33 2.68
Matt Carpenter Cardinals 16% 0.44 29% 2.73 2.29
Denard Span Giants 3% -1.66 15% 0.52 2.18
Yonder Alonso Athletics 3% -1.69 15% 0.43 2.12

Calhoun seems like a good candidate for a power uptick. He has the third-highest Sweet Spot% of 2016, and he has sustained similar Hard% and FB% to the previous two seasons. Yet somehow he has managed to cut his HR/FB% to less than half of what he put together in either 2014 or 2015.  More so, he has had some bad luck with balls hit in the “sweet spot”; his batting average in these kinds of balls is .500, whereas the league average is around .680. He is not killing fly balls in general, with an average exit velocity of 84.6 MPH, but if he keeps consistently hitting balls in the “sweet spot” range he should improve in the power department. Look out for a potential turnaround in the coming weeks and a return to 2015 HR/FB% levels.

Piscotty holds second place in the Sweet Spot% rankings. However, his FB% is very similar to what he did in 2015 whilst his Hard% is down from 38.5% to 32.5%. Lastly, he plays half of his games in Busch Stadium, which has a history of suppressing home runs. I would be cautious of expecting a major home-run surge, but in any case Piscotty is likely to at least sustain his performance in the power department, which would be welcome news to owners that got him at bargain prices.

Carpenter is another dweller of Busch Stadium, however his outlook might be a bit different. He is the absolute leader in Sweet Spot%. He is posting the highest Hard% and FB% marks of his career. Carpenter is also crushing his fly balls in general, with an average Exit Velocity of 93.7 MPH. Just as a point of reference Miguel Cabrera, Josh Donaldson and Giancarlo Stanton fail to reach an average of 93 MPH on their own fly balls. Lastly, he has had some tough luck with balls hit in the “sweet spot”, posting a batting average of just .420. Carpenter is already putting up the highest HR/FB% of his career, and he is a 30-year-old veteran of slap-hitting fame, but the power looks legit and perhaps there is more to come.

Denard Span and Yonder Alonso show up in this list not because of their Sweet Spot% prowess but rather due to their putrid HR/FB%. They barely crack the Top 50 in Sweet Spot%. They play half their games in two of the bottom three parks for HR Park Factor. Span is putting up his lowest FB% and Hard% rates since 2013, when he ended up with a HR/FB% of 3.4%. Meanwhile, Yonder’s rates most closely resemble those of 2012, when he had a HR/FB of 6.2%. Whilst their batting average of “sweet spot” batted balls is just .500, there is nothing to look here. In any case, their power situation looks to improve from bad to mediocre.

If you are interested in the perusing the Top 50 gaps between HR/FB% and Sweet Spot%, please find them below:

Name Team HR/FB  % HR/FB  %          Z-Score Sweet Spot % Sweet Spot % Z-Score Z-Score Diff
Kole Calhoun Angels 6% -1.15 26% 2.24 3.39
Stephen Piscotty Cardinals 11% -0.35 26% 2.33 2.68
Matt Carpenter Cardinals 16% 0.44 29% 2.73 2.29
Denard Span Giants 3% -1.66 15% 0.52 2.18
Yonder Alonso Athletics 3% -1.69 15% 0.43 2.12
Kendrys Morales Royals 10% -0.61 21% 1.38 1.99
Addison Russell Cubs 12% -0.27 22% 1.67 1.94
Yadier Molina Cardinals 2% -1.72 13% 0.11 1.83
Adam Jones Orioles 11% -0.46 20% 1.29 1.75
Alcides Escobar Royals 0% -2.10 10% -0.44 1.66
Jose Abreu White Sox 11% -0.35 19% 1.11 1.46
Joe Mauer Twins 17% 0.56 24% 1.96 1.40
Chris Owings Diamondbacks 3% -1.59 11% -0.26 1.32
Jacoby Ellsbury Yankees 5% -1.28 12% -0.09 1.19
Justin Turner Dodgers 6% -1.20 12% -0.01 1.19
Victor Martinez Tigers 12% -0.19 18% 0.95 1.14
Daniel Murphy Nationals 10% -0.60 16% 0.54 1.14
Justin Upton Tigers 4% -1.43 11% -0.29 1.14
Josh Harrison Pirates 5% -1.37 11% -0.25 1.12
Anthony Rendon Nationals 6% -1.23 12% -0.11 1.12
Corey Dickerson Rays 16% 0.42 21% 1.50 1.07
Brandon Crawford Giants 11% -0.41 16% 0.66 1.07
Ian Desmond Rangers 16% 0.35 21% 1.41 1.06
Derek Norris Padres 12% -0.30 17% 0.74 1.04
Ryan Zimmerman Nationals 19% 0.78 23% 1.81 1.03
Gregory Polanco Pirates 14% 0.11 19% 1.11 1.00
Austin Jackson White Sox 0% -2.10 6% -1.13 0.97
Nick Markakis Braves 2% -1.79 7% -0.86 0.93
Corey Seager Dodgers 18% 0.66 22% 1.56 0.91
Michael Saunders Blue Jays 20% 1.00 24% 1.88 0.89
Mike Napoli Indians 23% 1.38 26% 2.27 0.88
Brandon Belt Giants 7% -0.97 11% -0.15 0.81
Matt Kemp Padres 17% 0.59 20% 1.36 0.77
Nick Ahmed Diamondbacks 8% -0.81 12% -0.05 0.77
Matt Duffy Giants 4% -1.45 8% -0.73 0.71
David Ortiz Red Sox 19% 0.90 21% 1.53 0.63
Joe Panik Giants 9% -0.69 12% -0.06 0.63
Elvis Andrus Rangers 2% -1.72 6% -1.10 0.63
Brandon Phillips Reds 11% -0.41 14% 0.21 0.62
Adam Eaton White Sox 8% -0.81 11% -0.20 0.62
Gerardo Parra Rockies 8% -0.87 11% -0.26 0.61
C.J. Cron Angels 6% -1.18 9% -0.58 0.61
Dexter Fowler Cubs 13% -0.04 16% 0.56 0.60
Jose Altuve Astros 17% 0.53 19% 1.11 0.58
Prince Fielder Rangers 4% -1.42 7% -0.90 0.51
Jose Ramirez Indians 7% -1.09 9% -0.58 0.51
Joey Rickard Orioles 8% -0.91 10% -0.42 0.48
Asdrubal Cabrera Mets 7% -1.00 9% -0.53 0.46
Mark Teixeira Yankees 10% -0.50 12% -0.05 0.46
Ben Zobrist Cubs 13% -0.12 14% 0.34 0.45

Note: This analysis is also featured in our emerging blog www.theimperfectgame.com


Will the Real Tyler Goeddel Please Stand Up?

Similarly to a large portion of the FanGraphs community, I am a Philadelphia Phillies fan.  I was born in South Jersey just 20 minutes away from the stadium and grew up watching every game.  I was there for the tough times in the late 90’s / early 2000’s, and I was there for the glory days of 2007-2011.  After an abysmal last few seasons of baseball in Philadelphia, we have finally seen some promise this season leading us to believe that better days are coming soon.  One of the bright spots on the team so far this year has been Rule 5 pick, Tyler Goeddel.

After being selected in the first round of the 2011 MLB Rookie Draft, Tyler Goeddel began his professional career with the Tampa Bay Rays.  Goeddel was drafted out of high school as a third baseman and for the first three years of his minor league career that would be the only position he played.  In 2015, however, the Rays decided to move Goeddel to the outfield.  His athleticism allows him to play all three outfield positions and that type of versatility is very sought after by big league clubs.  While defense was never his problem, Goeddel’s bat didn’t develop as quickly as the Rays had hoped.  He was a career .262 hitter with 31 home runs across four full seasons in the minor leagues.  Ultimately the Rays made a tough decision and left him off their 40-man roster, knowing there was a great chance another team would select him in the Rule 5 Draft.  Shortly after, the Phillies did just that and selected Goeddel with the first overall pick of the 2015 Rule 5 Draft.

The Philadelphia Phillies have historically been excellent in finding talent in the Rule 5 Draft.  (2004 – Shane Victorino, 2012 – Ender Inciarte, 2014 – Odubel Herrera).  In the early going, I (like most Phillies fans) was very skeptical as to whether or not Goeddel could follow in the footsteps of players like Shane Victorino and Odubel Herrera and become a valuable contributor to our big league team.  Goeddel had a mediocre spring training but with no other serious competition in the corner outfield spots, there was no harm in keeping him around for a rebuilding year and seeing what the kid could do.

The beginning of Tyler Goeddel’s major league career could not have gone much worse.  Take a look below at his stats through his first nine games:

4:6 - 4:19 Stats

In only 16 at-bats, Goeddel recorded only one hit (a single), and struck out a whopping eight times!  Now obviously this is a VERY small sample size, and we should expect some struggles while adjusting to big league pitching.  Up until this point, Goeddel has never seen pitching above the Double-A level.  Now let’s take a look at his plate discipline stats over the same time frame:

4/6 - 4/19 Plate DisciplineO-Swing % – Percentage of time a batter swings on pitches outside the strike zone
Z-Swing % – Percentage of time a batter swings on pitches inside the strike zone
Swing % – Percentage of time a batter swings at a pitch, regardless of location
O-Contact % – Percentage of times a batter makes contact with a ball when swinging outside of the strike zone
Z-Contact % – Percentage of times a batter makes contact with a ball when swinging inside of the strike zone
Contact % – Percentage of times a batter makes contact with the ball when swinging
Zone % – Percentage of overall pitches thrown to batter that were in the strike zone

There is nothing noteworthy about his swing percentages as they are all just about equal to the league averages, but the contact percentages are quite alarming.  Through his first nine games, Goeddel only made contact 53% of the time he swung his bat.  Rather than just writing this off as a rookie being over-matched by big league pitching, I decided to dig deeper into these stats and figure out exactly where Goeddel was struggling.  Check out the video below that I put together which basically sums up the beginning of Goeddel’s career in 30 seconds:

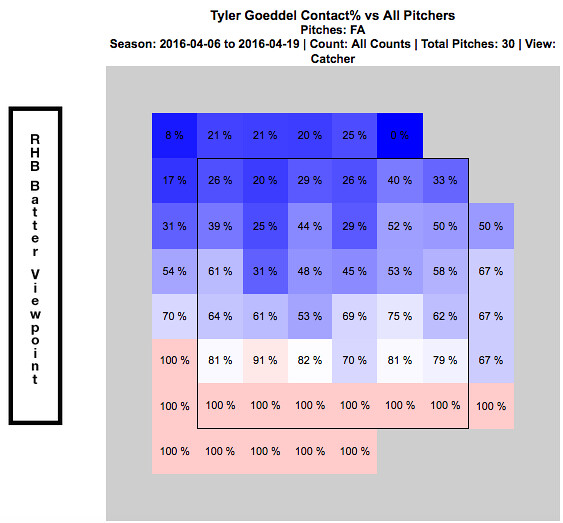
Whether or not you realized from watching the above video, every one of these swing and misses came on a fastball.  They all also came in the upper portion of the strike zone.  Just by watching Goeddel’s at-bats through this point of the season, it was clear as day to see opposing pitchers were attacking Goeddel with fastballs up in the zone.  The chart below shows every fastball that was thrown to Goeddel over his first nine games.  It is broken up by hot and cold zones and shows his contact percentage versus the fastball at every portion of the strike zone:

4:6 - 4:19 Contact % vs Fastball

This chart verifies for us what we saw in the video…Goeddel really struggled to hit fastballs up in the zone to begin the season.  At this point, everyone was frustrated.  Tyler Goeddel was frustrated because he knew he was much more talented than his results thus far have showed.  The Phillies organization was frustrated because they had such high hopes for Goeddel entering the season.  And most importantly, the Phillies fans were frustrated and began questioning what the Phillies could possibly see in this guy.  (Search for Tyler Goeddel’s name on Twitter and read old tweets from this time period if you don’t believe me!!)

An important thing to remember while looking at these stats, is that up until this point of his career Goeddel has been an every-day player.  Not only is he adjusting to big league pitching, but he is also trying to adjust to not having consistent at-bats.  Since the Phillies unexpectedly got off to such a hot start, an important decision needed to be made.  On one hand, they have this young promising player who will need consistent at bats in order to show his true potential.  But on the other hand, this team is surprisingly in the hunt in the NL East and may not want to allow Goeddel to go through his growing pains while they are competing for the division title.  Eventually, a decision was made and manager Pete Mackanin started to put Goeddel in the every-day lineup. Below are some quotes from Goeddel at this time speaking of the decision:

“Getting regular playing time and the confidence [from that] is huge, but I try to get started a little earlier on my swing so I can be on time with the fastball. You need to hit the fastball if you want to play up here, obviously. I feel like I’ve made that adjustment and it’s been a huge help.” – Tyler Goeddel

“I didn’t play how I wanted to play in April.  And I’m glad he’s (Pete Mackanin) giving me a chance, because I really didn’t play my way into a chance; he just gave it to me. So I’m trying to make the most of it.” – Tyler Goeddel

The video below (from 4/23/16) summarizes Goeddel’s early season struggles and the decision to give him more playing time:

The Phillies coaching staff deserves a lot of credit.  They recognized early on that Goeddel was struggling with fastballs up in the zone and prior to this game really worked with him in that area and promised him more playing time moving forward.  Here is a video of his next at bat in the game, where the pitcher tries once again to attack Goeddel with some high heat:

Goeddel responds with another base hit and his first RBI of the season.  Take a look below at how his stats over his next seven games compare to his stats from his first nine games.

4:23 - 5:6 Stats

4:23 - 5:6 Contact %

You can very easily see that Goeddel drastically improved his contact percentage over this time frame, which resulted in a huge drop in his strikeout rate.  The video below is from 5/8/16, right after the stretch of stats we just evaluated.  Goeddel had a big hit late to tie the game for the Phillies and later came in to score the winning run.

As you could see, the hit came on a high fastball.  A few weeks ago, Goeddel could not touch this pitch…but all of a sudden he is beginning to prove that he can.  The next video is from after that game.  Tyler discusses the adjustments he has made and also how playing every day has contributed to his recent success:

This hit was the start of a new Tyler Goeddel.  Pitchers continued to attack him with fastballs up in the zone and Goeddel really started to make them pay.  This is what he did to a Brandon Finnegan fastball just a few days later:

Ever since that hit on May 8th against the Marlins, Goeddel has been the player the Phillies could have only hoped he one day would become.  He has flashed signs of brilliance in just about every game since that have Phillies fans drooling over what the future outfield could look like.  Even though he has made adjustments and is seemingly now catching up to big league fastballs, opposing pitchers continue to test him.  Check out the video below that I put together showing what Goeddel has done to fastballs in the upper portion of the strike zone over the last few weeks.

As you can clearly see, this is a different player than we saw early on in the season.  Take a look at how his recent stats compare to those early on:

5:6-5:20 Stats

5:6-5:20 Contact %

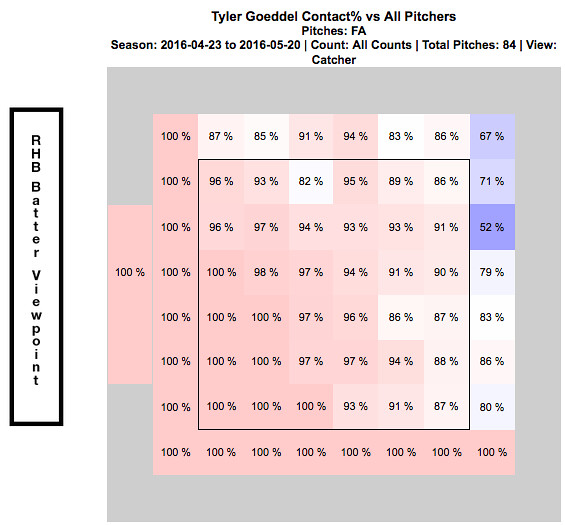
Goeddel’s contact percentage over his first nine games was only 53%.  Over his last 10 games, it is 91%.  That is an incredible difference and clearly his adjustments are paying off.  In turn, his improved contact has led to a strikeout percentage of only 5.4% over his last 10 games.  The chart below shows how Goeddel has fared against the fastball since he noted his adjustments on April 23, 2016.

4:23 - 5:20 Contact % vs Fastball

Now go back up to the top of the article and compare this chart to what it looked like at the beginning of the season.  More consistent at bats have clearly translated into him catching up to the fastball and the results thus far have been phenomenal.  I have to admit that I was a doubter early on, but I am now completely on board the Tyler Goeddel bandwagon.  This kid is only 23 years old and the fact that he was able to so quickly make an adjustment like this and immediately see results is remarkable.  Now that he is having some success, opposing pitchers will start to change their game-plan against him.  While the pace he is on now may not be sustainable over the course of a full season, I am confident that Goeddel will continue to make the necessary adjustments and help this Phillies team continue to find ways to win ball games.  Although the video below doesn’t exactly relate to his success at the plate, I had to throw this in here and it is a must watch if you have not seen it already:

The last video I will show features Goeddel’s post game interview after this throw:

Recent Quotes:

“It’s exciting.  Coming to the field everyday I’m expecting to see myself in the lineup. That’s a feeling I didn’t have last month. It’s a lot more relaxing, less stressful.” – Tyler Goeddel

“It was definitely a big adjustment, going from playing everyday my whole career to having a specific role, and then not performing well in my role, it was a little tough.  But, you know, they’re giving me an opportunity now and I feel like I’m playing better, which is nice. I’m happy for myself. I always knew I could play up here, but I needed some results to prove it to myself. I’m glad, finally, there are some results to show.” – Tyler Goeddel

I love how confident Goeddel is when he speaks of his game and I am so glad the numbers back him up.  I continue to be blown away watching him play every day, especially due to the fact that he has only been playing the outfield for one year.

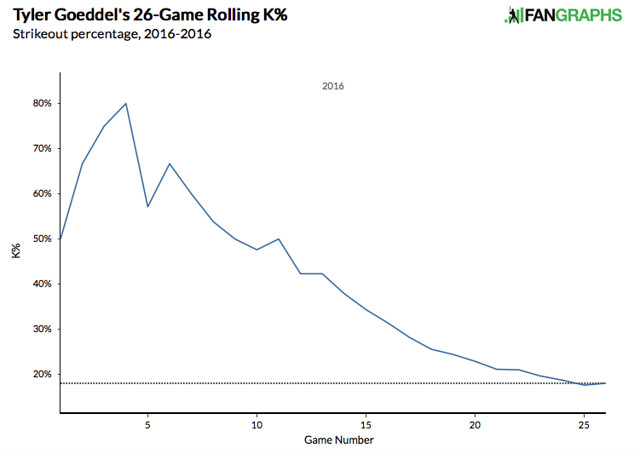
Lastly, I want to show a few graphs.  The first one shows a rolling total of Goeddel’s strike out percentage so far this season.  The statistics earlier show you that it has decreased, but this graph makes it much easier to see his progression:

Rolling K%

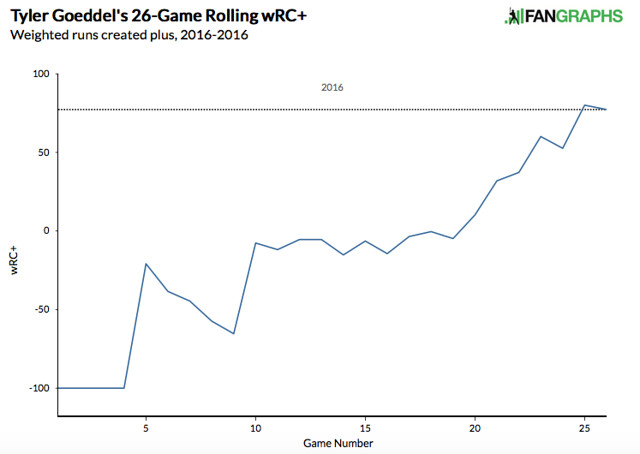
The next graph is another rolling total showing how Goeddel’s wRC+ has progressed throughout the season.  For those of you who are unfamiliar with the stat, wRC+ stands for weighted runs created plus.  It attempts to quantify a player’s offensive value in terms of runs.  An average wRC+ is 100.  Check out how Goeddel’s wRC+ has improved throughout the season:

Rolling WRC+

What do you think, Phillies fans?  Can Tyler Goeddel keep this up?  Is the Tyler Goeddel that we have seen over the last few weeks the real Tyler Goeddel?  Are you ready to hop on the bandwagon yet or do you need to see more from him to believe?  Only time will tell, but I’m buying into the hype and am excited to see what the future holds for this promising young player.

Twitter – @mtamburri922


The Future of Analytics In Baseball: How Will Small-Market Teams Fare?

This post originally appeared on the Pittsburgh Pirates blog Bucco’s Cove.

A recent episode of the Baseball Prospectus podcast Effectively Wild (and if you don’t listen to it, this is one of the best baseball podcasts out there) had two analysts from the LA Dodgers’ front office as guests. During the episode, one of them said, “Even though we have grown substantially in the last year…” and went on to talk about the size of their analytics department and how they work together. This is a scary prospect for small-market teams like the Pirates; embracing analytics before such things were en vogue allowed teams like the Moneyball A’s, the Royals, the Pirates, and many others to gain a competitive advantage over their comparatively retrograde competition still throwing money at their problems every offseason.

The window of opportunity for small-market teams to use advanced analytics to their advantage may be closing faster than we think. Most (and possibly all, I don’t have access to every team’s front office payroll) teams have some sort of analytics department (or “Baseball Operations Department,” as they’re often dubbed). According to this ESPN article from about 14 months ago, only two woeful teams are listed as “nonbelievers,” the Marlins and the Phillies, and the Phillies have since seen some significant shuffling in their front offices. Larger teams are beginning to emulate their smaller counterparts to varying extents, with results that will bear fruit over the coming seasons. As a fan of a small-market team, this is concerning; the limited dividends paid from the analytics advantage may mean a return to the old power structure in baseball in which larger-market teams with more money have the ability to acquire players at will. The difference, however, will be that stats will have informed the signings, so if two teams are targeting the same player for “sabermetric reasons,” the team with more money will obviously still have the upper hand.

Scarier still for fans of small-market teams is that the greater financial capital available to geographically-favored franchises is that these financial resources can not only be employed to sign the best players, but also the most talented analysts and more of them. The premise that teams all have access to effectively the same data and analysis is rendered moot if larger franchises can secure a stronger analytics department, both in terms of the number of analysts and the talent of the analysts (money could even be used to lure talented analysts to the richer franchises in the same way that players are). For example, the Cubs thus far this season seem to be a perfect confluence of young talent, effective free-agent signings based on a strong analytics department, and a hell of a lot of money, which is exactly where you want to be if you’re trying to create a dynasty and win multiple Commissioner’s Trophies.

Parity in the league is still greater than that of the NFL, but we could be witnessing the last generation of such parity. How is such a situation solved? The one obvious choice is a salary cap; the player’s association would be loath to support such an idea, although it’s perhaps beginning to be in their interest. As the league’s revenue increases, players haven’t been getting the same share of that revenue, according to Nathaniel Grow on FanGraphs. A quote from that article:

“The biggest difference between the NBA and MLB, then, isn’t the fact that the former has a salary cap while the latter does not. Instead, the primary difference between the two leagues’ economic models is that by agreeing to a “salary cap,” NBA players in turn receive a guaranteed percentage of the league’s revenues, while MLB players do not.”

According to the same article, the players’ share of revenue has fallen about 13% to 16% since 2002 or 2003. While this argument is unlikely to induce the MLBPA to support a salary cap, a downturn in league parity could force their hand at some point in the future. This would be a long-term effect, however; many years of a “lack of parity,” coupled with a downturn in the popularity of the sport as a whole, would be required to even have the MLBPA thinking about acquiescing to a salary cap.

Coming back to the proliferation of analytics departments among MLB teams and their effect on important advantages held by those willing to embrace statistics: I don’t know what’s going to happen. There are many facets to analytics, more than just comparing players based on the BABIP or K% or arm slot or determining what players to acquire and how much they’re worth. For example, one of the Effectively Wild guests from the episode I cited earlier was a biomedical engineering major during her undergraduate studies, implying that the front office is becoming interested in the medical side of analytics: preventing injuries, improving player health, and looking at the biomechanical aspect of baseball, which takes a significant toll on players’ bodies. This is not too dissimilar from what the Pirates have done in recent years and is just one of the many components to assembling and maintaining a competitive squad.

This line of thinking admittedly removes the human component from the equation, which is still incredibly important to this entire process. There will always be GMs who are more willing to try new strategies to win and those who are unwilling to change (*cough* Ruben Amaro, Jr.). Coaching and player development, especially in the minor leagues, will continue to be extremely important for MLB franchises and is largely outside the purview of the type of statistical analysis that is widely considered in evaluating players. Rather, this part of baseball can be thought of, to a certain extent, as producing the statistics that analysts ultimately study. As a result, there will always be opportunities for smaller-market teams to hire talented personnel, including trainers, coaches, scouts, and other employees outside the scope of the Major League analytics departments that will influence franchises’ success and failure.

However, analytics at the MLB level may start to be influenced by money. Ultimately, stories like the Pirates’ repeated acquisitions of undervalued Yankee catchers who are stellar pitch framers, the Royals’ World Series win relying on great defense and a crazy strong bullpen, and the general parity of the league beyond the traditionally great franchises may be fewer and further between. Those franchises with more money may regain the competitive advantage that the sabermetric revolution has wrested away from them for the past decade, and smaller-market teams will have to find yet another way to adapt to the ever-changing baseball landscape.


Tyler Wilson and His Five Plus Pitches

Let me preface this article by saying that I watch A LOT of baseball.  I also have an extensive analytical background and am always analyzing baseball stats looking for value in players.  Last week, I was watching an Orioles game and the starting pitcher was a player I have never heard of.  His name is Tyler Wilson.  While watching the game, I was very impressed with his overall make-up and the confidence he displayed in each one of his pitches.  Many times what separates a pitcher from being able to start at the big-league level versus being destined for the bullpen is the ability to throw multiple pitches.  The ability to throw each of those pitches effectively, however, can be what separates a good starting pitcher from a great starting pitcher.  The more I watched of Wilson, the more intrigued I became about his future outlook, and the more motivated I became to write this article.  (I went back and watched all of Wilson’s starts this year before writing this article.)

To give you a little background, Tyler Wilson has never been an elite prospect.  He attended college at the University of Virginia, where he was overlooked by fellow staff-mate, and future 1st round pick, Danny Hultzen.  Wilson was drafted by the Orioles in the 10th round of the 2011 MLB Draft.  Ever since being drafted, he has quietly excelled at every level.  He doesn’t have the dominant strikeout numbers that you look for in pitching prospects, which is a big reason he has gone overlooked for much of his career.

After climbing his way through the organizational ladder, Wilson made his major league debut with the Orioles last year and eventually made the team this year out of spring training.  Although he made the team in a bullpen role, early season injuries to the Orioles pitching staff opened up an opportunity and Wilson has really taken advantage of it.  Enough of the background though.  Let’s move on to what I saw while actually watching him pitch.

Tyler Wilson features a cutter and a two-seam fastball.  Each of these pitches sit in the 89-91 mph range and both show a great amount of movement.  The cutter is most effective against right-handed batters when thrown on the outside portion of the plate.  Check out the video below to watch him fool Kansas City Royals outfielder Lorenzo Cain with three straight cutters:

He essentially gave Cain, a very good hitter, three of the exact same pitches in a row…and Cain couldn’t touch them.  In every start this year, Wilson has pounded the outside corner with this cutter and has had fantastic results.  Don’t think by any means though that he is a one trick pony.  As soon as you start to expect that cutter on the outside corner, Wilson will come right back in on you with a two-seam fastball:

Look at the horizontal movement on that pitch!  Absolutely filthy!  Wilson has showed a ton of confidence in both of those pitches so far this season as he uses them to pound both sides of the strike zone and his command of them has been exceptional.  He is not afraid to throw them in any count and they are equally effective vs both left-handed and right-handed batters.

While his fastballs both seemed to be plus pitches upon first glance, I started to have thoughts that this guy might be for real as soon as he started throwing his curveball.  Wilson’s breaking ball sits in the 77-79 mph range.  I was astonished by how well he was able to locate his curve and the amount of movement on each and every one he threw.  Watch him send White Sox slugger Jose Abreu down swinging in the video below:

Abreu had no chance.  In his most recent start against the Twins, Wilson’s curve looked even better.  Check out the one he threw to Byung-Ho Park:

Both of those pitches came in a 2-2 count.  Many pitchers are scared to throw a breaking ball in a 2-2 count, especially to players with plus power such as Abreu and Park.  If you miss your target, two things can happen.  One — you leave the ball up in the zone and it gets hit out of the stadium.  Two — you throw it in the dirt; the hitter lays off; and now you have to pitch to this slugger with a full count.  Wilson isn’t scared to throw his curveball in any count and that is what makes him so dangerous.  You never know when to expect it, but at the same time you have to expect that he can throw it at any moment.

The last pitch in Wilson’s arsenal is his changeup.  This pitch has a ton of downward movement and produces a lot of groundballs.  While there were many better examples that I could have shown you of his change-up in action, I wanted to show one of his bad ones.  Even when he missed his target, the batter was still fooled by the amount of movement on this pitch.  Check out the following pitch to Royals SS Alcides Escobar:

The catcher set up down in the zone and Wilson clearly misses his target.  Luckily it didn’t seem to matter as the pitch had an insane amount of horizontal movement, running in on Escobar and jamming him.

Take a look at the chart below, showing the vertical and horizontal movement on each of Wilson’s pitches:

Tyler Wilson Movement

The middle portion of this chart is empty.  All five of his pitches have a tremendous amount of movement, and none of them move in the same direction.  The fact that he is able to command each of these pitches so well and keep hitters guessing with which one will come next is the reason why he has had so much success.  A big reason why hitters are having trouble guessing his pitches is because of how well Wilson is able to repeat his delivery.  The chart below shows Wilson’s release point for each type of pitch:

Tyler Wilson Release Point
As you can see, his release point is almost identical with all five of his pitches.  At this point, I have watched all of his starts from this season and was very impressed.   I then decided to do some research and was immediately impressed with stats such as his career BB rate and low WHIP, but wanted to dig further.  I began to look through the PITCHf/x data because I was curious to see how effective each of his pitches actually were.  Based on the PITCHf/x value metric, all of his pitches so far this year have graded as above average.  If you are not familiar with the PITCHf/x value scale, someone who has a fastball ranking of zero means that he possesses an average fastball.  Any value above zero means that pitch is above average.  Obviously the higher the number, the better the pitch.  The same goes for negative numbers and pitches being below average.  See the table below for the breakdown of Wilson’s arsenal:

Screen Shot 2016-05-15 at 1.19.17 AM

Based on the above values, the change-up has been Wilson’s most valuable pitch this season with his curveball close behind.  Obviously it is very early in the season and we are working with a small sample size…but that doesn’t mean we can’t have fun!  While doing this research, I set out the goal to find every starting pitcher who throws five or more above-average pitches.  Below is the list of players who fit that description:

Screen Shot 2016-05-15 at 1.41.09 AM
IP = Innings Pitched
FA = Fastball
FT = Two-Seam Fastball
FC = Cut Fastball
SI = Sinker
SL = Slider
CU = Curveball
CH = Change-up
KC = Knuckle Curveball
EP = Eephus

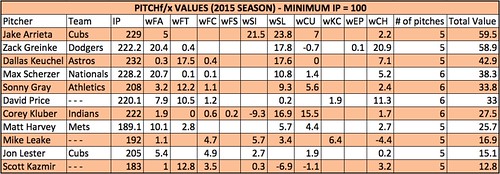
There are only five pitchers who have thrown five or more pitches above average so far this season!  Wilson is in great company, as the other four pitchers are all All-Star-caliber players and borderline household names.  Being that this is such a small sample size, I decided to look back at last year’s stats to see how many players fit this description over a full season.  Using the same parameters and setting the minimum IP to 100, the following table was produced:

Screen Shot 2016-05-15 at 2.05.17 AM

Once again, the names on this list are some of the top pitchers in baseball.  A few of these pitchers have a pitch that graded out as below average, but since they had five or more different pitches all individually grade as above average, they made the final cut.

As you can see, it is very rare to have a pitcher who has five legitimate plus pitches.  I am very interested to see if Tyler Wilson can maintain these results over the course of a full season, and I really hope he is given the opportunity to do so.  If he continues to pitch the way he has been, the Orioles will have no choice but to leave him in the rotation.  Although he has had limited success, Wilson has struggled in each of his starts when facing the lineup the third time around.  This could be due to the fact that he is still in the process of being stretched out from his bullpen role.  When in the bullpen, you don’t have to prepare to face the same hitter three times.  I am hopeful that once he is fully stretched out and back into his starter mentality, he will be able to make the necessary adjustments and continue to throw all of his pitches with confidence.  If he can continue to make quality pitches as he faces the lineup for a third time, I believe Tyler Wilson has the chance to become a very special pitcher.

Memorable quotes I heard during the TV broadcasts:

“Everyone thinks that I pitch with a chip on my shoulder but I really don’t.  I just go out and compete.  I don’t think of it that way.” – Tyler Wilson

“I think he understands himself.  He can maintain his game-plan throughout the game.  He’s going to keep us in the game and give us a chance to win.  What more can you ask for?” – Pitching Coach Dave Wallace

“I love that he can make the ball run in and then cut away.  He pitches to both sides of the plate.  Not a lot of young pitchers can do that.” – Manager Buck Showalter

…no Buck, not a lot of young pitchers can do that.

Twitter – @mtamburri922


xHR%: Questing for a Formula (Part 5)

This is the long-delayed fifth part in the xHR series. If you really want to read the first four parts, they can be located here, here, here, and here.

More than a month late, the highly anticipated follow-up to the first iteration of xHR has arrived. Once more, that increasingly trivial metric will grace the page of FanGraphs, wallowing in the mostly prestigious Community Research section (on the other hand, this section is most definitely the best section on the World Wide Web for experimental metrics and amateur analyses).

Unless the reader has an impeccable memory for breezily scanned, frivolous articles, he or she likely needs a reminder as to what xHR% is and aims to be. xHR% is a metric that describes at what rate a player should have hit runs over a given season. From this, expected home runs, a more understandable counting statistic, can be found by multiplying plate appearances by xHR%. It cannot be emphasized enough that the metric is not predictive; it only aims to describe. Without further ado, the formula is here:

I know that’s a lot to look at, and it isn’t exactly self-evident what all of the variables mean. As such, an explication of each part is necessary and provided below. (For logical rather than chronological purposes, the Kn variable will be analyzed last.)

AeHRD – One of the biggest differences between this formula and the last one is that this one does not use home run distance. This iteration uses expected distance, rendering it a combination of simple math, sabermetric theory, and physics. As such, expected home run distance strips out one of the biggest factors in luck — the weather.

Expected home run distance is found by utilizing a method taken from Newtonian Mechanics to calculate how far objects go. By using ESPN’s HitTracker website, I was able to obtain launch angles and velocities for nearly every home run hit in 2015. From this, I was able to resolve velocity into its respective parts, velocity in the x-direction (Vx) and velocity in the y-direction (Vy). After that, I calculated the amount of time the ball would be in the air with the formula vf=vi+gt, where vf is final velocity (0 m/s), vi is initial velocity (Vy), and g is simply the gravitational acceleration constant. Finally, I multiplied Vx by time in order to get the total expected distance.

I repeated that process for every home run hit by a given player in order to find his average expected home run distance. By doing this, I was able to strip out all weather-related components.

AeHRDH – Utilizing the same process as above, I found the average expected home run distance for every stadium. This is the player’s home stadium’s average home run distance, regardless of team.

AeHRDL – The same as above, but done for every home run hit in the majors last season.

When put together in the numerator and the denominator, the above variables serve as a “distance constant” of sorts that will at most adjust the resulting expected home runs by plus or minus two. Occasionally, the impact is negligible because the average expected distance is very close to that of the player’s home stadium and the league. Averaging the mean expected home run distance of the league and of the home stadium allows the metric to paint a more accurate picture of where the player hit his home runs and whether or not they should have left the park. Nevertheless, it’s important to note that this formula still fails to account for fly balls that fell just short of the wall due to the wind and other factors, meaning that there are still expected home runs unaccounted for.

FB% – If you remember correctly, or took the time to briefly review the previous posts, then you will recall that in the prior iteration of the formula there was a section very similar to this one. The only differences are that the weights on each year of data have changed (those are still somewhat arbitrary, however, but I am working on getting them to more precisely reflect holdover talent from past years) and the primary statistic used.

Previously, HR/PA was used, but it had to be abandoned because the results were too closely correlated with reality. This time, I looked at how similarly descriptive formulas were quantified. Oftentimes, those metrics did not use the target expected metric in their formulas. Rather, they utilized other metrics that correlated moderately well or strongly with their expected metric. In this case, I decided to use FB% because it’s a relatively stable metric (especially in comparison with HR/FB), and it has a strong correlation with HR% (about .6).

As a clarification, the subscript Y3, Y2, and Y1 indicate the years away from the season being examined, where Y1 is really Y0 because it’s zero years away. So just to be clear, Y1 is the in-season data from the year being examined. In the data to be examined, for example, Y1 is 2015, Y2 is 2014, and Y3 is 2013.

Kn – As you can well imagine, FB% numbers are always far greater than HR% numbers*, resulting in some truly ridiculous results if a constant isn’t applied that relates HR% to FB%. For instance, without a constant to modify the results, Jose Bautista would have been expected to hit 304 home runs last season. That’s a lot of home runs. Just two and a half seasons of playing at that level and he’d have the home run record in the bag. Luckily, I’m not stupid enough to think that that’s actually possible, and so I initially related FB% and xHR% with a constant, called KCon.

Unfortunately, KCon didn’t work as well as I’d hoped because it skewed expected home run results way up for terrible home run hitters and way down for the best home run hitters. By skewed, I mean bad by more than six home runs. And so I, in my infinite (and infantile) amateur mathematical wisdom, made it into a seven part piecewise** function. By this, I mean that there’s a different constant for each piece of the formula, defined by HR% at somewhat arbitrary, though round points. For clarity, here they are:

K1 = HR%<1

K2 = 1≤HR%<2

K3 = 2≤HR%<3

K4 = 3≤HR%<4

K5 = 4≤HR%<5

K6 = 5≤HR%<6

K7 = 6<HR%

It works quite well. I am very excited about the current iteration of xHR%, its implications, and all it has to offer. Of course, it is not finished, but I think I’m getting closer. Please comment if you have any questions, an error to point out, or anything of that nature. There will be a results piece published soon on the 2015 season, so keep an eye out.

*It wouldn’t be surprising if Ben Revere became the first player to have a HR% equal to FB% (both at 0%, naturally).

**It is neither continuous nor differentiable.


Simulating the WARriors

116.

116 is the Major League Baseball record for most wins in a single season, achieved by the 1906 Chicago Cubs and the 2001 Seattle Mariners.

For 95 years the record was unbreakable. Fifteen years after that, it remains unmatched.

Major-league players are assigned a value called Wins Above Replacement (WAR), a statistic that displays the number of wins a player added to the team above what a replacement player would have added. In recent years, a WAR value of 8 or higher would be associated with an MVP-quality season, a value of 5 for an All-Star, 2 for the average starter, 0-2 for a bench player, and less than 0 for a replacement player.

With my curiosity looming, I decided to do a little research and came up with a list of the highest single-season WAR values for every position throughout history. But I decided to take it a step further. I wanted to create the greatest WAR-based roster of all time, a 25-man winning powerhouse that would be called, fittingly, the WARriors. I found the highest single-season WAR for each of the starting eight non-pitcher positions, followed by the highest single-season WAR for a five-man starting rotation, and then decided to add three infielders, three outfielders, a catcher, four relief pitchers, and a closer, all with the highest single-season WAR in their respective position (for the bench hitters, I chose the players with the NEXT-highest WAR at their position, behind the starting eight).

Here’s what I came up with:

WARriors Roster

C- Mike Piazza 1997 – 8.7 WAR
1B- Lou Gehrig – 1927 – 11.8 WAR
2B- Rogers Hornsby 1924 – 12.1 WAR
3B- Mike Schmidt 1974 – 9.7 WAR
SS- Cal Ripken Jr. 1991 – 11.5 WAR
LF- Carl Yastrzemski 1967 – 12.4 WAR
CF- Barry Bonds 2001 – 11.8 WAR
RF- Babe Ruth 1923 – 14.1 WAR

Total: 92.1 WAR

UT- Honus Wagner 1908 – 11.5 WAR
OF- Ty Cobb 1917 – 11.3 WAR
OF- Mickey Mantle 1957 – 11.3 WAR
OF- Willie Mays 1965 – 11.2 WAR
UT- Joe Morgan 1975 – 11.0 WAR
UT- Jimmie Foxx 1932 – 10.5 WAR
C- Johnny Bench 1972 – 8.6 WAR

Total: 75.4 WAR

SP- Tim Keefe 1883 – 20 WAR
SP- Old Hoss Radbourn 1884 – 19.3 WAR
SP- Jim Devlin 1876 – 18.6 WAR
SP- Pud Galvin 1884 – 18.4 WAR
SP- Guy Hecker 1884 – 17.8 WAR

Total: 94.1 WAR

RP- Jim Kern – 1979 – 6.2 WAR
RP- Mark Eichhorn – 1986 – 7.4 WAR
RP- John Hiller – 1973 – 8.1 WAR
RP- Bruce Sutter – 1977 – 6.5 WAR
CL- Goose Gossage 1975 – 8.2 WAR

Total: 36.4 WAR

Added together, the total team WAR for the WARriors is a ridiculous 298. That’s almost two full seasons of wins. To put it in perspective, the 2001 Mariners had a total team WAR of 67.7, and the 1906 Cubs’ total was 56. This is expected, however, and is a near impossible task to analyze efficiently because of the lack of pre-1900 data, and the mix of players from almost every decade. But it’s still fun to look at, so let’s run with it.

Now, the question on the table is this: Would this team win more than 116 games? I’d put money on it. But an even bolder question, would this team go 162-0? Again, we have to understand what we’re dealing with. The skill level of a ballplayer in 2016 is entirely different than an 1800s hurler pitching 500-600 innings per year. Luckily, we have the technology.

First, we need a starting lineup. As the self-proclaimed WARriors manager, here’s the Opening Day nine that I would play (each player listed had the highest single season WAR value for their position):

Hornsby 2B – .424/507/.696

Bonds CF – .323/.515/.863

Ruth RF – .393/.545/.764

Gehrig 1B – .373/.474/.765

Yastrzemski LF – .326/.418/.622

Schmidt 3B – .282/.395/.546

Piazza C – .362/.431/.638

Ripken SS – .323/.374/.566

Keefe SP – 41-27/2.41/359 K’s

But to go 162-0, we need to play 162 games, and who would those games be against? My idea was to simulate a 162-game season by playing 54 three-game series against the last 54 World Series champions (54 times 3 = 162). That should make it interesting, right? So for example, the WARriors would begin with three games against the 2015 Royals, followed by three against the 2014 Giants, then three versus the 2013 Red Sox, and so on, dating back to 1961. To be fair, every other series would be on the road, and the pitcher’s spot will bat. To support my love of the Reds, I decided to use the 2003 Great American Ball Park as the WARriors’ home stadium.

I used the whatifsports.com Dream Team simulator to assemble the WARriors roster. Because the data on their website only goes back to 1885, I will need to eliminate the years of my entire starting rotation from the original roster. However, I am replacing that data with each pitchers’ next-best year post-1885, or finding the next-best-WAR starting pitcher if one of the originals did not play beyond 1885, or if that next-best had a better WAR. Whatifsports manually subs position players as needed, and I manually rotated the starting pitchers every game, also switching the WARriors to the road team every other series.

Without further ado, here are the results of the simulated games:

2015 Royals @ WARriors

Game 1: WARriors 18 Royals 0

Game 2: WARriors 19 Royals 3

Game 3: WARriors 17 Royals 10

WARriors @ 2014 San Francisco Giants

Game 1: WARriors 11 Giants 0

Game 2: WARriors 2 Giants 1

Game 3: WARriors 11 Giants 8

2013 Red Sox @ WARriors

Game 1: WARriors 5 Red Sox 4

Game 2: WARriors 23 Red Sox 4

Game 3: WARriors 11 Red Sox 7

WARriors @ 2012 Giants

Game 1: WARiors 4 Giants 2

Game 2: WARriors 18 Giants 4

Game 3: WARiors 21 Giants 3

2011 Cardinals @ WARriors

Game 1: WARriors 21 Cardinals 2

Game 2: WARriors 27 Cardinals 0

Game 3: WARriors 23 Cardinals 2

WARriors @ 2010 Giants

Game 1: WARriors 18 Giants 8

Game 2: WARriors 6 Giants 1

Game 3: WARriors 13 Giants 10

2009 Yankees @ WARriors

Game 1: WARriors 7 Yankees 2

Game 2: WARriors 15 Yankees 3

Game 3: WARriors 10 Yankees 6

WARriors @ 2008 Phillies

Game 1: WARriors 5 Phillies 4

Game 2: WARriors 13 Phillies 1

Game 3: WARriors 9 Phillies 5

2007 Red Sox @ WARriors

Game 1: WARriors 8 Red Sox 3

Game 2: WARriors 16 Red Sox 8

Game 3: WARriors 12 Red Sox 5

WARriors @ 2006 Cardinals

Game 1: WARriors 21 Cardinals 7

Game 2: WARriors 18 Cardinals 4

Game 3: WARriors 17 Cardinals 11

2005 White Sox @ WARriors

Game 1: WARriors 8 White Sox 2

Game 2: WARriors 14 White Sox 0

Game 3: WARriors 12 White Sox 4

WARriors @ 2004 Red Sox

Game 1: WARriors 5 Red Sox 3

Game 2: WARriors 7 Red Sox 1

Game 3: WARriors 3 Red Sox 1

2003 Marlins @ WARriors

Game 1: WARriors 15 Marlins 0

Game 2: WARriors 23 Marlins 6

Game 3: WARriors 21 Marlins 5

WARriors @ 2002 Angels

Game 1: WARriors 9 Angels 7

Game 2: WARriors 7 Angels 0

Game 3: WARriors 16 Angels 5

2001 Diamondbacks @ WARriors

Game 1: WARriors 2 Diamondbacks 0

Game 2: WARriors 5 Diamondbacks 1

Game 3: WARriors 5 Diamondbacks 4

WARriors @ 2000 Yankees

Game 1: WARriors 13 Yankees 10

Game 2: WARriors 13 Yankees 12

Game 3: WARriors 19 Yankees 3

1999 Yankees @ WARriors

Game 1: WARriors 19 Yankees 13

Game 2: WARriors 16 Yankees 12

Game 3: WARriors 19 Yankees 9

WARriors @ 1998 Yankees

Game 1: WARriors 11 Yankees 5

Game 2: WARriors 8 Yankees 4

Game 3: WARriors 16 Yankees 1

1997 Marlins @ WARriors

Game 1: WARriors 27 Marlins 0

Game 2: WARriors 24 Marlins 2

Game 3: WARriors 15 Marlins 0

WARriors @ 1996 Yankees

Game 1: WARriors 13 Yankees 3

Game 2: WARriors 16 Yankees 0

Game 3: WARriors 25 Yankees 10

1995 Braves @ WARriors

Game 1: WARriors 9 Braves 5

Game 2: WARriors 10 Braves 2

Game 3: WARriors 6 Braves 4

WARriors @ 1993 Blue Jays

Game 1: WARriors 12 Blue Jays 6

Game 2: WARriors 13 Blue Jays 2

Game 3: WARriors 7 Blue Jays 1

1992 Blue Jays @ WARriors

Game 1: WARriors 10 Blue Jays 4

Game 2: WARriors 17 Blue Jays 13

Game 3: WARriors 15 Blue Jays 10

WARriors @ 1991 Twins

Game 1: WARriors 12 Twins 0

Game 2: WARriors 19 Twins 8

Game 3: WARriors 6 Twins 4

1990 Reds @ WARriors

Game 1: WARriors 10 Reds 9

Game 2: WARriors 5 Reds 1

Game 3: WARriors 12 Reds 2

WARriors @ 1989 A’s

Game 1: WARriors 16 A’s 12

Game 2: WARriors 11 A’s 7

Game 3: WARriors 21 A’s 6

1988 Dodgers @ WARriors

Game 1: WARriors 8 Dodgers 3

Game 2: WARriors 14 Dodgers 11

Game 3: WARriors 9 Dodgers 3

WARriors @ 1987 Twins

Game 1: WARriors 20 Twins 6

Game 2: WARriors 22 Twins 1

Game 3: WARriors 15 Twins 9

1986 Mets @ WARriors

Game 1: WARriors 12 Mets 2

Game 2: WARriors 15 Mets 5

Game 3: WARriors 9 Mets 5

WARriors @ 1985 Royals

Game 1: WARriors 9 Royals 5

Game 2: WARriors 4 Royals 3

Game 3: WARriors 17 Royals 5

1984 Tigers @ WARriors

Game 1: WARriors 8 Tigers 3

Game 2: WARriors 4 Tigers 1

Game 3: WARriors 14 Tigers 0

WARriors @ 1983 Orioles

Game 1: WARriors 19 Orioles 3

Game 2: WARriors 23 Orioles 4

Game 3: WARriors 14 Orioles 2

1982 Cardinals @ WARriors

Game 1: WARriors 21 Cardinals 0

Game 2: WARriors 18 Cardinals 1

Game 3: WARriors 7 Cardinals 5

WARriors @ 1981 Dodgers

Game 1: WARriors 6 Dodgers 0

Game 2: WARriors 16 Dodgers 0

Game 3: WARriors 10 Dodgers 6

1980 Phillies @ WARriors

Game 1: WARriors 9 Phillies 6

Game 2: WARriors 12 Phillies 0

Game 3: WARriors 15 Phillies 12

WARriors @ 1979 Pirates

Game 1: WARriors 8 Pirates 4

Game 2: WARriors 10 Pirates 9

Game 3: WARriors 15 Pirates 5

1978 Yankees @ WARriors

Game 1: WARriors 3 Yankees 0

Game 2: WARriors 6 Yankees 1

Game 3: WARriors 14 Yankees 1

WARriors @ 1977 Yankees

Game 1: WARriors 17 Yankees 14

Game 2: WARriors 11 Yankees 7

Game 3: WARriors 14 Yankees 9

1976 Reds @ WARriors

Game 1: WARriors 18 Reds 5

Game 2: WARriors 2 Reds 0

Game 3: WARriors 5 Reds 3

WARriors @ 1975 Reds

Game 1: WARriors 9 Reds 0

Game 2: WARriors 4 Reds 6

Game 3: WARriors 8 Reds 4

1974 A’s @ WARriors

Game 1: WARriors 16 A’s 13

Game 2: WARriors 10 A’s 2

Game 3: WARriors 9 A’s 7

WARriors @ 1973 A’s

Game 1: WARriors 1 A’s 0

Game 2: WARriors 12 A’s 4

Game 3: WARriors 4 A’s 0

1972 A’s @ WARriors

Game 1: WARriors 8 A’s 5

Game 2: WARriors 5 A’s 3

Game 3: WARriors 9 A’s 5

WARriors @ 1971 Pirates

Game 1: WARriors 16 Pirates 3

Game 2: WARriors 5 Pirates 1

Game 3: WARriors 11 Pirates 9

1970 Orioles @ WARriors

Game 1: WARriors 14 Orioles 12

Game 2: WARriors 9 Orioles 8

Game 3: WARriors 12 Orioles 2

WARriors @ 1969 Mets

Game 1: WARriors 22 Mets 0

Game 2: WARriors 17 Mets 0

Game 3: WARriors 15 Mets 1

1968 Tigers @ WARriors

Game 1: WARriors 12 Tigers 6

Game 2: WARriors 10 Tigers 4

Game 3: WARriors 18 Tigers 16

WARriors @ 1967 Cardinals

Game 1: WARriors 16 Cardinals 5

Game 2: WARriors 13 Cardinals 7

Game 3: WARriors 24 Cardinals 14

1966 Orioles @ WARriors

Game 1: WARriors 15 Orioles 2

Game 2: WARriors 20 Orioles 8

Game 3: WARriors 9 Orioles 3

WARriors @ 1965 Dodgers

Game 1: WARriors 5 Dodgers 3

Game 2: WARriors 6 Dodgers 3

Game 3: WARriors 5 Dodgers 0

1964 Cardinals @ WARriors

Game 1: WARriors 12 Cardinals 1

Game 2: WARriors 19 Cardinals 7

Game 3: WARriors 12 Cardinals 8

WARriors @ 1963 Dodgers

Game 1: WARriors 8 Dodgers 0

Game 2: WARriors 8 Dodgers 1

Game 3: WARriors 6 Dodgers 4

1962 Yankees @ WARriors

Game 1: WARriors 10 Yankees 9

Game 2: WARriors 3 Yankees 1

Game 3: WARriors 5 Yankees 2

WARriors @ 1961 Yankees

Game 1: WARriors 17 Yankees 11

Game 2: WARriors 11 Yankees 0

Game 3: WARriors 13 Yankees 2


WARriors Final Season Record: 161-1


Unbelievable. Well folks, there it is. If you actually sifted through all those results, you would see that the one, tiny blemish on an otherwise perfect season was game two against the notorious 1975 Big Red Machine. According to the simulation, George Foster went 1-4 in the game with a two-run shot, and Pete Rose added an RBI single and a stolen base. Ironically, my Reds were the one to end the streak.

In short, a 25-man roster of the best single-season WAR values in the history of baseball went 161-1 against the last 54 World Series Champions, playing each champ in a three-game series and alternating between road and home venues. The WARriors scored an outrageous 2,002 runs in 154 games during this simulation, equal to 13 runs per game. Their opponents scored 708 runs in 154 games, equal to about 4.5 runs per game. That’s a run differential of 1,294.

I am both astounded that I had the patience to run all of those games, and also that not one other team was able to sneak by this loaded roster.

This makes for a very interesting case, and leads to further questions and different match-ups that would be extremely fun to see. Different ballparks, more accurate values assigned, different lineups, etc. would obviously reveal a separate outcome, but these simulations revealed that winning isn’t everything.

Okay, maybe 161 times out of 162 it is.


The Case For Jake Arrieta as the Most Dominant Pitcher of All Time

C.R.A.P.  It’s a fairly modern affliction that affects a great deal of people like you and me — and by ‘you and me’ I mean internet users.  It’s clear that the internet, like all of mankind’s greatest achievements, is not without drawbacks.  Never before have we been so connected, and never before have we heard the terms: Athazagoraphobia (Fear of missing out), ‘Paradox of Choice’, and ‘Intellectual Technologies’ (just Google it — because I can’t remember what it means).  The level of connectedness is so intense that on a day-to-day basis, I feel like I meet people whose personalities are plagiarized patchworks of charismatic, yet ill-informed internet voices (myself included).  And then, of course, there’s C.R.A.P., which stands for Combative Responses to Antipodal Posts.  An amusing component of C.R.A.P. is the ferocity with which contrary opinions are met with online; I have experienced 30 years of life and not once have I heard strangers communicate with each other in the manner that they do in the comments section of baseball blog posts on the internet.

To be clear, I’m not completely condemning the common vernacular found in said comments sections, because debate and conversation simply happen differently when we’re responding to a pun that’s a screen name rather than a face with eyes.  On Thursday, the 21st of April, Jeff Sullivan wrote a piece titled, The Case for Noah Syndergaard as Baseball’s Best Pitcher, and the comments section is littered with people who suffer from C.R.A.P.  In my opinion, if you actually read the article, you’d be able to tell that Jeff isn’t declaring Syndergaard the best pitcher, but based on his stuff and recent results, there’s definitely a case for it, hence the title.  Essentially, I think Jeff is saying that it’s possible Syndergaard is taking that step, and he’s open to the idea.  Jeff did a great job (as always, thank you, Jeff) as evidenced by reactions to the article.  He got us thinking and he got us discussing — some of us liked what Jeff had to say and some of us clearly weren’t receptive to the idea.  At all.  To his credit, Jeff did exactly what he’s supposed to do.

Now before we nosedive into the reasoning behind the outlandish title of this article, I want to get a few things out of the way: First and foremost, I’m sorry for throwing gasoline on an already raging fire.  Second, I think Clayton Kershaw is the best pitcher in baseball because of his sustained dominance (1.98 ERA over his last 1066.1 IP).  Certainly that doesn’t mean that pitchers can’t be better than Kershaw for a period of time, however, it’s just that while others rise and fall to his level, Kershaw remains.  And finally, I think Pedro Martinez is the best pitcher of all time.  That’s partly because I was born in 1985, and partly because I read it on the internet.  Mentioning Pedro is a good time to tie back into Jeff’s article.  To quote:

…Right now, in 2016, Syndergaard has a 23 ERA- and a 22 FIP-, through three starts…

Believe it or not, Kershaw has 37 three-start stretches with an ERA- no higher than 23. He has just seven three-start stretches with an FIP- no higher than 22. What Syndergaard is doing, Kershaw has done several times. But it’s not like this is Kershaw’s resting level. And Syndergaard is just as much about the scouting as he is about the stats.

That 23 ERA- just happens to be the number I was looking for.  During his peak (97 – 03), Pedro was preposterously good, posting a K-BB% of 26.1%, a 47 ERA-, and a 52 FIP-.  The acme of his peak came in a 22-game stretch spanning the 1999-2000 seasons when he posted an ERA- of 23 and an FIP- of 33.  His K-BB% was an unruly 34%, and he allowed just 95 hits in 168.1 IP.  Marvel at the overall line: 

August 3, 1999 – June 14, 2000

GS IP TBF H R ER HR BB K ERA WHIP FIP GSv2 K-BB% ERA- FIP-
22 168.1 635 95 25 21 7 31 247 1.12 0.75 1.51 84 34.0% 23 33

Again, that 23 ERA- is what I’m focusing on because it’s the number we saw in Mr. Sullivan’s article.  I could not find a better or equal stretch of dominance, based on ERA-, over 22 games, than Pedro’s going back to 1969…until Jake Arrieta.  Looking at only regular-season games, dating back to July 2nd of 2015, Arrieta has produced that magic 23 ERA- number we’re looking for:

July 2, 2015 – April 21, 2016

GS IP TBF H R ER HR BB K ERA WHIP FIP GSv2 K-BB% ERA- FIP-
22 162 590 84 19 16 4 31 159 0.89 0.71 2.12 75 21.7% 23 55

For those of you who prefer FIP I say leave your C.R.A.P. in the comments section, because as we gain more data, we learn that pitchers have some modicum of control over the quality of contact they allow, and at this point it’s probably safe to say that Jake Arrieta is a proven FIP-beater, even if he’s earned this title in less time than it takes others.  But Arrieta’s streak is now actually at 24 starts in the regular season, and two of those have been no-hitters.  His line:

June 21, 2015 – April 21, 2016

GS IP TBF H R ER HR BB K ERA WHIP FIP GSv2 K-BB% ERA- FIP-
24 178 647 91 20 17 4 33 173 0.86 0.70 2.09 76 21.6% 22 54

Pop the confetti!  Blow your vuvuzelas! Or Tweet!  That 22 ERA- is something we’ve never seen over such a large quantity of starts (at least going back to 1969 — and at least with my hack-job research)!

What this means in the scope of baseball’s long history isn’t nothing.  It’s a marvelous line.  Of course, it is just one number I’m looking at, and ERA-, like the internet, is not without flaws.  It’s arguable and perhaps even likely that Pedro’s line, with that 34.0% K-BB%, is more impressive (that mark was 293% better than league average — lolz).  But Arrieta has two no-hitters.  However, if we look at quality of opponents, well, Pedro’s line becomes more impressive because the teams he squared off against combined for an average wRC+ of 102, whereas Arrieta’s opponents averaged 94 wRC+.

Dave Cameron wrote an article about Arrieta’s ability to control the quality of contact he allows, and as we learn more about this skill, perhaps we’ll revere it a little more — never as much as strikeouts, but definitely more than we do now.  One of Jeff’s points about Syndergaard is that he undoubtedly has the arsenal and command to become the game’s top arm.  Arrieta has legit weaponry as well, but I don’t think anything we’ve ever seen from a starter matches what Syndergaard is throwing.  We know Arrieta’s story up to this point, which makes his sudden-ish ascent to a level where he can put a streak together like the one he’s on more interesting, if not more impressive.  What he does from now until the end of his career will go a long way in determining the weight this current streak holds.  If he flames out, or loses his ability to induce weak contact, it will be seen as a lucky blip; but if he rallies off another few years of 5 – 8 WARs and 50 ERA-es, then we’ll feel better about objectively putting his streak into an historical perspective.  As of right now, even despite his current run, I’m nowhere near putting Arrieta’s name in with the all-time greats (yes, the title was click-bait, spare me the C.R.A.P.), but, like Jeff in regards to how he feels about Syndergaard, but to a lesser extent, I’m open to it.  And that’s about as far as it goes for me — but I’m so contented to sit here and watch the debate unfold, violently, online.


The Gritty Details

“Grit” in baseball has long been a gag for the saber crowd. Fire Joe Morgan was basically one long joke about how gritty David Eckstein was. And there’s good reason to distrust “grit.” Grit, hustle, guts — they’re unquantifiable (sabermetrician attempts to the contrary), often racially coded, and poorly defined skills. (Grit does predict great legal representation, though!)

Yet “grit” has evolved into a buzzword and teachable skill — one that social scientists suggest correlates with success in school, work, and life. Grit is defined by Prof. Angela Duckworth, who pioneered the field of “grit” research, as follows:

We define grit as perseverance and passion for long-term goals. Grit entails working strenuously toward challenges, maintaining effort and interest over years despite failure, adversity, and plateaus in progress. The gritty individual approaches achievement as a marathon; his or her advantage is stamina. Whereas disappointment or boredom signals to others that it is time to change trajectory and cut losses, the gritty individual stays the course.

Duckworth’s research suggests that grittiness corresponds with success in everything from spelling bees to West Point.

So why not in baseball? In a sport where we are constantly prophesizing how players develop, isn’t the predictive power of “grit” something we should be looking at? And can “grit” help us ID players who are more than meets the eye? Read the rest of this entry »


Psychological Safety and the Adam LaRoche Saga

It was supposed to be the new cast of characters that stirred the pot on the south side. Who would have guessed that the preseason drama would emanate from an old war horse? The 36-year-old Adam LaRoche walked away from $13 million after White Sox management asked LaRoche to “dial it back a bit” and stop bringing his son Drake to the ballpark. Apparently, Drake had spent 120 games with the White Sox in 2015, and had already been a mainstay at the spring training facility in 2016.

Many of the White Sox players, including stars like Chris Sale and Adam Eaton, have publicly displayed their discontent with White Sox management, siding with both Adam and Drake LaRoche. Eaton was adamant enough to say that the White Sox “lost a leader” in Drake LaRoche [1] – a comment that he directed at team president, Kenny Williams. With so many players openly expressing their opposition to the removal of Drake LaRoche, it’s interesting to note that the issue arose from a small group of anonymous White Sox players who privately reported their distaste of Drake’s omnipresence.

Adam LaRoche was clear with his teammates – if there was ever an issue about his son Drake’s presence in the clubhouse, let him know about it:

Though I clearly indicated to both teams the importance of having my son with me, I also made clear that if there was ever a moment when a teammate, coach or manager was made to feel uncomfortable, then I would immediately address it. I realize that this is their office and their career, and it would not be fair to the team if anybody in the clubhouse was unhappy with the situation. Fortunately, that problem never developed [2].”

Unfortunately, things didn’t exactly play out that way, as no one brought it up to LaRoche personally:

Apparently, no one ever told LaRoche. These players and staff members didn’t feel comfortable even sharing it with their own teammates, with several White Sox players saying they never heard a complaint. But they did express their views to management [3].”

It’s not that LaRoche was an outcast. From the reaction of many of the players, it seems like primary players on the White Sox (if not large swaths of the team) were cool with Drake hanging around as much as he did. So, if a few people had a problem, why didn’t they speak up to LaRoche? Conversely, why couldn’t LaRoche sense that Drake was weirding some of his teammates out?

Let’s talk about feelings

 Average sensitivity is the ability of members within a team to sense how other team members are feeling by observing their facial expressions, body language, and other behavioral cues. Average sensitivity is an aspect of a broader construct called psychological safety, which helps to explain how and why team members speak up, exchange information, and their general willingness to be open with other teammates (Edmonson & Lei, 2014). There has been extensive research on the relationship between psychological safety and performance (Baer & Frese, 2003; Edmondson & Lei, 2014; Collins & Smith, 2006; Schaubroeck et al., 2011); broadly, this research indicates that open communication between team members is related to team performance.

How important is psychological safety in terms of group performance, you ask? Google’s Project Aristotle explored the characteristics that make the perfect team. After four years, hundreds of experimental teams, thousands of people, and 50 years’ worth of academic literature, the critical variable in predicting a successful team was…psychological safety [4].

Now, we haven’t measured the White Sox’ sensitivity or psychological safety directly, so the suggestion that these things played a role in the LaRoche situation is more of an educated guess than an empirical observation. Also, much of the research on the influence of psychological safety has been done in organizations, as opposed to sports teams. But it isn’t difficult to imagine that if there was a greater emphasis on psychological safety, a situation like this might not have arisen. It’s not too far of a jump to say that higher-performing teams should:

  • Place a premium on speaking up with ideas, without fear of punishment or ridicule. Don’t stifle effective collaboration regardless of the topic.
  • Promotion of safety is key – the research has shown that it does not arise naturally, but should be discussed and fostered.

Imagine if LaRoche’s teammates might have felt comfortable going directly to him instead of circumventing him. Would the White Sox still be in their current state of disarray? It could be less about this particular incident, and possibly more indicative of a greater, team-wide issue of communication.

Sooner or later, a situation similar to the Drake and Adam LaRoche situation is going to happen again. There’s also plenty of other team level constructs to explore, such as team chemistry. The broader point, though, is that these scenarios are likely somewhat avoidable: Teams can work to increase sensitivity and psychological safety. It won’t be easy, but research suggests that things like players-only meetings to air out grievances, establish lines of communication, and solidify roles might be a place to start. For the White Sox, it’s a rough way to begin the season, but fortunately these issues are fixable – and it’s certainly a helluva lot better to address these issues now rather than at the All-Star break.


[1] http://heavy.com/news/2016/03/adam-laroche-son-drake-retire-ken-williams-comments-family-wife-jenn-daughter-montana/

[2] http://thebiglead.com/2016/03/21/adam-laroche-son-anonymous-white-sox-teammates-complained/

[3] http://www.foxsports.com/mlb/story/adam-laroche-chicago-white-sox-ken-williams-retire-drake-laroche-son-chris-sale-teammates-031916

[4] http://www.nytimes.com/2016/02/28/magazine/what-google-learned-from-its-quest-to-build-the-perfect-team.html?_r=3