Don’t Worry About Brett Cecil (Too Much)
My friend posted something interesting on Facebook. It said:
“Dear Jays bandwagoners, stop booing Brett Cecil. Form is temporary, class is permanent.
2014 April: 5.14 ERA, May-Sept: 2.09 ERA
2015 April: 5.23 ERA, May-Oct: 2.09 ERA
2016 April: 5.79 ERA”
Maybe he is a slow starter and he should be able to go back to his second-half form as the season goes on. What I am slightly concerned about is that his April 2016 season ERA is worse than Aprils from the two previous seasons.
Let’s examine his pitches. He struggled big time in June 2015 when he posted an abysmal 9.00 ERA, but he did not allow a single run after June 30th that season. He has a 5.59 ERA as of May 11th. I went to brooksbaseball.net and researched his four-seam fastball, curve, and sinker between these three periods.
- Four-seamer
Usage: 31%(June 2015) -> 21%(After June 30th of 2015 season) -> 13% (This season, as of May 4th)
Velocity: 93.9 mph -> 93.0 mph -> 92.8 mph
Horizontal movement: 3.6 inches -> 4.4 inches -> 5.1 inches
Whiff/Swing rate: 8% whiff/swing -> 17% whiff/swing -> 8% whiff/swing
GB/BIP: 13% -> 39% -> 11%
LD/BIP: 38% -> 30% -> 33%
FB/BIP: 38% -> 26% -> 56%
Horizontal release point: 0.83ft (June 2015) -> 0.89 (July 2015) -> 0.55 (August 2015) -> 0.61 (Sep 2015) -> 0.64 (This season)
Vertical release point: 6.57ft (June 2015) -> 6.49ft (July 2015) -> 6.58ft (August 2015) -> 6.51ft (Sep 2015) -> 6.54ft (This season)
Brett is relying less on his four-seam fastball as time goes. He is trying to adapt to the ‘sinker-ball’ trend. While his four-seamers have some movement, he may have felt the need to opt for a new pitch with more movement. His fastball velocity is in the low 90s and he can reach for 94 on occasion. That’s not ideal for a relief pitcher. His four-seamer is gaining more horizontal movement as time goes. He, in this season, has 1.5 more inches of horizontal movement than last season. He had big success with his four-seamer after June 2015 — it induced a 17% whiff rate, which is 9% higher than June 2015.
He also recorded a 39% GB/BIP using his four-seamer in his last three months of 2015 season, which is 27% higher than June 2015 (39% GB/BIP means that he induced 39 ground balls in every 100 balls in play off his four-seam fastball). His LD/BIP and FB/BIP also had substantial decreases in the last three months of the 2015 season, which helped him record a 0.00 ERA in that span. One of my theories of his successful 2015 season is that he changed his horizontal release point throughout the 2015 season. You can see the changes above. You can also observe the changes in the graph that I created using R:
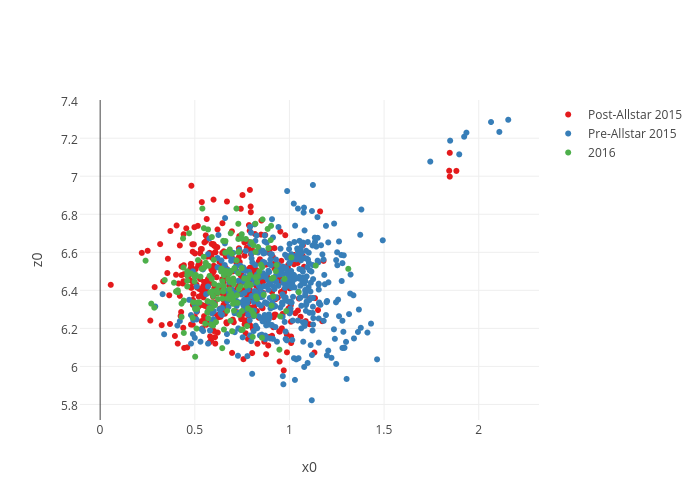 Blue plots indicate his release points from April to June 2015 when he struggled to get batters out. Red plots indicate his release points from July to October 2015. You can definitely see that red plots clustered away from the blue plots. He made this adjustment and his command significantly improved, as well as other metrics.
April-June 2015: 25IP 11BB 5.40 ERA
July-Oct 2015: 29.1IP 2BB 0.00 ERA
Batters have adapted to him this season. His release points of this season are consistent with his 2015 second half, but he is struggling this season. His four-seam fastball is being hit hard again this season. His whiff/swing rate in the second half of 2015 was 17% and his 2016 season whiff/swing rate is 8%. If you refer to the ball-in-play stats above, his 2016 season ground ball/BIP, line drive/BIP, and fly ball/BIP rates are also worse than in the second half last season. But I don’t see velocity drop and change in release points for his four-seamer. Movement of his four-seamer is actually better. I can’t seem to diagnose what is wrong with his four-seam fastball this year and it leads to me to assume that his lackluster breaking balls are hindering the effects of his fastball as well. Now I am going to continue on researching with his other pitches and examine some specific situations.
Cecil is throwing significantly less four-seam fastballs for the first pitch of at-bats. He seems to be afraid of throwing it for the first pitch. Maybe he thinks that batters are waiting for it. Or maybe he wants to try to induce groundballs more and decided to throw a sinker more. You can see that he throws more sinkers for a first pitch instead of four-seamers.


His sinkerball approach for the first pitch seems to be a good one because most of the sinkers he throws for the first pitch are strikes. Last year, he threw 64% of his first-pitch sinkers for a strike. 19% of sinkers he’s thrown this year in his first pitch have been balls. Refer to pitch outcomes below:


However, he should avoid throwing a curveball for the first pitch, if he doesn’t want to get behind. Out of 12 curveballs that he’s thrown for the first pitch this year, nine of them were called a ball. If you look at the tables above, he did much better last year with his curveball for the first pitch.
He should not throw a curveball if he wants to get further ahead either. Look at the table below for pitch outcomes in 0-1 counts. You will notice that batters are not chasing it, and they don’t whiff on it when they swing after it. Although Cecil’s 2016 season 0-1 curveball sample is limited with only nine, you can see the pattern. 12% more balls taken by batters against Cecil in 0-1 counts this year compared to the second half of 2015. 36% less swings have been taken this year against Cecil’s curve. No batters have whiffed against Cecil’s 0-1 curveball this year. His 0-1 curveball in the second half of 2015 served him so well, inducing whiffs in 26% of occasions. Now that he can’t do that, he is failing to get ahead 0-2 as often as last year, which gives him more trouble getting outs.


And when he does get to an 0-2 count somehow, he is struggling to get guys out with curveball. You can see here:


Half the curveballs he’s thrown in 2016 in 0-2 counts were called a ball. Worse rate than last year. Batters swung at it 61% of time in the second half last season, while they now swing at it only 39% of the time. Batters are also making more contact with 0-2 curveballs this year than last year. It’s the same story when considering when he is ahead. (In other words, all counts when he is ahead)
His refined curveball in the second half of the 2015 season was the reason why he was doing so well. According to FanGraphs, his wCu/C in the 2014 and 2015 seasons were 2.5 and 2.8, respectively. This year, it is an awful -5.2. His curveball must be refined because batters figured it out.
Let’s figure out what could be wrong with his curveball then.
His curveball’s horizontal movement deviates from last year’s second half. His curveball was great in the first half of last season as well. Last season, the horizontal movement of the curveball ranged between 0 to 1 inch. This means that his curveball’s horizontal last year moved 0 to 1 inch away from the catcher’s glove side. This season, it is moving toward the glove side of the catcher. I don’t know whether that has a negative impact. It’s inconclusive.


Brett’s horizontal release points of 2016 curveballs are up to par with the second half of 2015. So I don’t think horizontal release point has had any impact on his curveball this year.

He has more vertical depth on his curveball this season than the last. More vertical depth on his curve is a good thing. But I don’t think improving vertical depth will fix anything, given that his curveball got its job done last year with less vertical depth.

Vertical release point of his curveball this season is within the range of second half of 2015. I don’t think vertical release point of his curveball is a problem either.

His curveball velocity is down this year. This is likely the biggest problem with Cecil. This implies that batters have some more fractions of a second to judge whether the curveball is a ball or strike. This gives batters some more time to decide whether to swing or not. I am convinced that a velocity increase will help him. Fortunately, he experienced a velocity increase throughout each of his last four seasons (2012 to 2015), as you can see in this graph:

It does seem to explain his improved ERA throughout each of the last two seasons. We should monitor his velocity this May to see if there is any sign of velocity improvement. In the meantime, it’d be best to let him pitch in low-to-medium leverage situations until he is warmed up for home stretch. He looks to me like he will be okay. He is only 29 this year and I don’t think we need to worry that his velocity drop is a permanent thing yet. Message to Brett: “Just relax and stop thinking about your disappointing start to this season. It’s likely nothing and time will only solve it. Congratulations on the birth of your daughter.”


