A More Appropriate Measure of Late-Inning Relievers
The issue that plagues the valuation of late-inning relievers is the generalized treatment of runs.
WAR is the most accepted player evaluation metric and wins are determined by run value. Run value is determined in a generalized sense; it’s too perilous and unwieldy to predict, or evaluate performance, based upon the sequencing of events.
However, late-inning relievers do not pitch in a general situation. Unlike many other players we know when they will perform. They are unique; they pitch in particular situations: the late innings of a baseball game.
They are not vulnerable to give up a home run in a large range of innings like a starting pitcher. They are vulnerable to giving up runs in the innings their role demands them to appear in; most notably the 7th, 8th, and 9th innings.
Therefore, reliever value should be measured by a more specific run value. This run value, and ultimately win value, cannot be measured in a general sense. Their valuation must account for the specific times they appear in a game.
I set out to do this with those principles in mind.
First, I used Baseball Reference’s Play Index to determine the amount of runs scored in between the 7th and 9th innings of all games in 2015. There were 13,448 7th, 8th, and 9th innings played last year. That is the equivalent of 1,494 full 9 inning baseball games. In sum, 5,968 runs were scored in the 7th, 8th, and 9th innings of baseball games in 2015. On average, that is 3.99 runs per “game”, where “game” signifies 9 innings of 7th-9th inning performance.
Second, also using Baseball Reference’s Play Index, I looked at the 300 pitchers with the most appearances in the 7th, 8th, and 9th innings. This does not represent every pitcher that pitched in the 7th, 8th, and 9th inning, but it gets us to Trevor Cahill, who pitched 16 innings in the 7th inning or later.
I then split this list of pitchers into two groups. Theoretically, the 90 best relievers in the league would be pitching in the 7th, 8th, and 9th innings (30 teams; 3 relievers each). Therefore, the first group is the first 91 pitchers with the most appearance (Tony Sipp and Blaine Boyer each appeared in 43 innings between the 7th and 9th innings, so there is one more than 90 in this case). The other 209 pitchers represent the “replacement” pool.
The average performance of the “replacement” pool was taken to determine the performance of a replacement player. Here is what that looks like:
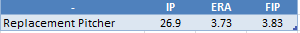
This is the basis for the more nuanced portions of the calculation. 3.99 runs were scored in the 7th-9th inning of MLB games in 2015, on average. The first thing to do is calculate the Runs Per Win (RPW) in the “game” (the 7th-9th inning game).
Dave Cameron explains how RPW for pitchers is calculated in this post in the FanGraphs Glossary. You should read it in to become acclimated with the logic of the next step. The article notes that the WAR calculations at FanGraphs credit each pitcher with a unique RPW value, as the better or worse a pitcher is will lower or raise their RPW value. It then details the calculation recommended by Tom Tango to determine RPW value:
Runs Per Win = (Player Runs Against + Lg Runs Against)/2)*1.5
I’m using FIP for the Players Runs Against for this explanation, but you could simply use RA9 or ERA. The tables below include an ERA-based WAR calculation in addition to a FIP-based WAR calculation. That’s not the main point of this conversation though.
So, I’ll take the 3.83 FIP of the replacement-level pitcher and the 3.99 League Runs Against Average and plug it into that equation, which equates to 5.86 RPW for the replacement-level 7th-9th inning pitcher. This equation is applied to each individual pitcher. I’ll use Aroldis Chapman throughout the explanation to walk through the calculation.
Replacement Pitcher RPW = (3.83 + 3.99)/2)*1.5 = 5.86 RPW
Aroldis Chapman RPW = (1.95 + 3.99)/2)*1.5 = 4.45 RPW
Next, I made a calculation of runs above average for each pitcher and the average of the replacement pool. Again, the most important numbers in this calculation is the FIP of the individual pitchers and the 3.99 league average. These figure are plugged into the following calculation:
Runs Above/Below Average = (Lg Runs Against*(Player IP/9))-(Player FIP*(PlayerIP/9)
Replacement Pitching Runs Above/Below Average = (3.99*(26.2/9))-(3.83*(26.2/9) = .49 Runs Above Average
Aroldis Chapman Runs Above/Below Average = (3.99*(63.1/9))-(1.95*(63.1/9) = 14.33 Runs Above Average
The replacement pool was .49 runs above league average. The replacement pool averaged 26.2 innings pitched, or roughly three “games” per year. The replacement player would give up 11.48 runs a year over 26.2 innings based on a 3.83 FIP, which is .49 runs less than the 11.97 runs of the 3.99 league average over the same amount of innings. This calculation was done for each player. Chapman is given as an example above.
Finally, the Replacement Runs Above/Below Average is subtracted from Runs Above/Below Average for each individual player. The difference between the two is then divided by each player’s unique RPW value and the result is each pitcher’s WAR. For example, the difference between Chapman’s Runs Above Average and the Replacement Player’s Runs Above Average is 13.85. Chapman’s unique RPW is 4.45. This values Chapman at 3.11 WAR.
WAR = (Player Runs Above/Below Average — Replacement Runs Above/Below Average) / Player Unique RPW Value
(14.33-.49) = 13.84;
13.84/4.45 = 3.11 WAR
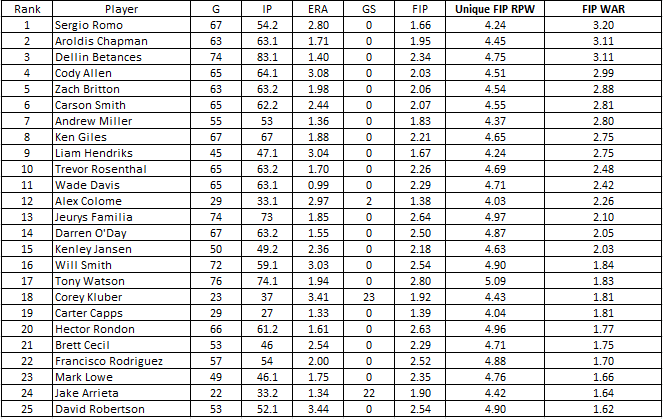
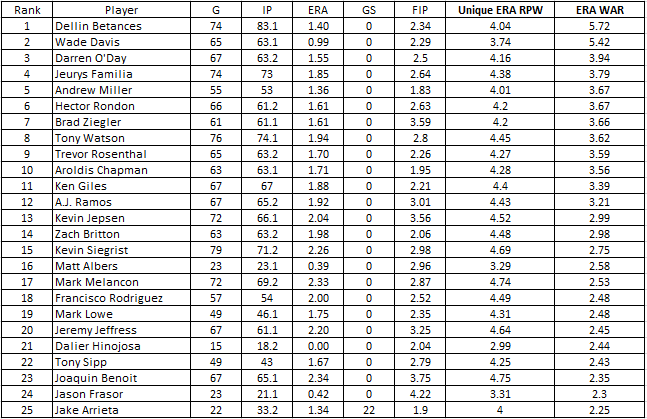
Before you glance at the tables below let me set out some more facts about the data:
- The list of 300 pitchers does include starters who appeared in innings 7–9.
- The list does not include every pitcher who appeared in innings 7–9 so the values in the chart are not exact. The exercise is meant to display the idea of an improved method to measure reliever value. My assumption would be that a more complete list would lead to an inferior measure of replacement.
- The data is only looking at 7th-9th inning performance. It does not account for performance in extra innings, or performance prior to the 7th inning.
- WAR is a counting stat, so WAR will be influenced by the amount of innings each player pitches.
- The median calculated FIP WAR is .21 and the Average FIP WAR is .35. The 25th Percentile ranges from -1.67 to -.81. The 75th Percentile ranges from .71 to 3.2.
- The median calculated ERA WAR is .26 and the Average ERA WAR is .5. The 25th Percentile ranges from -1.54 to -.27. The 75th Percentile ranges from 1.08 to 5.72.
You can read more of my thoughts, opinions, and research on baseball at https://medium.com/simply-bases. Twitter: @simplybases.
Ive always felt pitcher positional adjustments could make sense to a degree, problem being closers being used in blowout games, they tend to pitch worse and the game isnt on ghe line so their might be less focus or pressure, both could help a given player. Its definitely tougher to target true late inning reliever worth and a possible inneficiency due to the various ways of grading it.
Thank you for offering this up and taking the time to calculate and put everything together. Wouldn’t the fact that many games end in 8.5 innings (meaning the home team doesn’t bat in the bottom of the ninth) dramatically impact your replacement level? You may have adjusted for this, but it doesn’t reference it above.
First, thanks for the read.
In regard to the innings, don’t view it as an individual game. The data I used was how many 7th, 8th, and 9th innings were pitched in baseball cumulatively. How an individual game shook out does not matter. It’s just the total innings pitched in the 2015 MLB season. So if it was a 8.5 inning game, then there for that game there would be a full 7th, a full 8th, and .5 of the 9th inning. When you add that all up throughout all games of the year there were 13,448 innings of 7th, 8th, and 9th inning baseball pitched.
I hope that clarifies things. But let me know if not!
I am not competent to critique your math, I made a D in college statistics. But the fact that Sergio Romo ranks #1 in FIP WAR and doesn’t even appear on the ERA WAR list suggests that something is missing.
Sergio had a very weird year in 2015:
– His FIP was a superb 1.91 due to his excellent K%, BB%, and HR% allowed
– But, he allowed a very high .331 BABIP on all the other plate appearances, meaning he allowed more baserunners than you’d expect from a guy with a 1.91 FIP.
– And finally, only 72.7% of the baserunners he allowed were stranded on base (a career low). So at the end of the day, his ERA rose all the way up to 2.98, still good but hardly elite for a reliever.
Aaron, tz’s explanation sums up why Romo leads in FIP WAR but does not appear on ERA WAR.
The only thing I want to clarify, is the FIP and ERA numbers that tz cites for Romo are his full-season numbers. They will not match the numbers in the charts above because those numbers only account for Romo’s performances between the 7th-9th innings.
Hope that avoids any confusion.
You’re runs per win calculation is incorrect, in my opinion. Why?
When calculating runs per win, you simply look at league runs per game and the pitcher’s runs per game, in either ERA or FIP.
But that misses a key portion of the runs per win calculation: the pitcher’s teammates. You see, the whole point of the runs per win calculation is to estimate the value of each run based on the pythagorean expectation formula. The fewer runs scored in that game (in general), the more valuable each run becomes. That’s why we have a runs per win formula in the first place.
Of course, Aroldis Champman or Dellin Betances pitching a single inning in a game doesn’t do much to lower the amount of runs scored in the game. At most, Champman or Betances might allow 0.2 runs per inning, while a replacement level reliever might allow 0.5 runs per inning.
That difference, 0.3 runs, should be the only difference in the runs per win calculation for Chapman and a replacement level pitcher. The fact that your difference in RPW between a replacement level closer and an elite closer is so large should tell you that mathematically, you’re doing somethign wrong, because one inning of an elite closer does little to chase the overall run environment for the game.
Here would be a correct formula, for Chapman for instance:
RPW = (Replacement Starting Pitcher RA9 * Average Starting Pitcher IP/GS + Chapman RA9 * Chapman IP/G + Replacement Starting Pitcher RA9 * (9 – Average Starting Pitcher IP/GS – Chapman IP/G)) / 9 / 2) * 1.5
I’m sorry to kind of dampen the mood of your article. It’s definitely good for people to try and figure out if we’re undervaluing relievers.
Runs Per Win just isn’t the right place to look, in my opinion. I think taking a harder look at replacement level winning percentage (for starters and relievers) might be a good place to start, because personally I’ve found that the .470 and .380 values used by FanGraphs to be rather arbitrary (and, in my experience, not a good reflection of starting pitcher and relief pitcher value).
Sorry the formula should read:
RPW = (Replacement Starting Pitcher RA9 * Average Starting Pitcher IP/GS + Chapman RA9 * Chapman IP/G + Replacement *RELIEF Pitcher RA9 * (9 – Average Starting Pitcher IP/GS – Chapman IP/G)) / 9 / 2) * 1.5
Not to mention you also forgot to convert ERA and FIP to a RA/9 scale, another thing that increases the runs per win. This is a smaller mistake, though.