Archive for November, 2016

Hitting Stat Correlation Remix

We all love baseball. And, since we’re on FanGraphs, odds are we also love baseball stats. A stat is always intended to measure one thing — how many home runs did Miguel Cabrera hit, how many bases did Ricky Henderson steal, how often does Joey Votto get on base, and so on.

The savvy fan knows that no one stat tells the whole story. Even WAR, which is our best estimator for how much value a player brings, requires us to dig further into how the player got there. Was it defense? Offense? If it was offense, how’d he get there — lots of walks, lots of home runs, or did he have a high BABIP? And which of these are most likely to repeat?

That’s where correlation comes into play. If there’s a high correlation season to season, then odds are what we’re measuring* is repeatable, and we can expect more of the same going forward. Otherwise, we should expect a regression (positive or negative) toward the league mean the next season.

Or maybe a player has a high line-drive rate. How’d they get there? Do they swing a lot, do they tend to be power hitters, etc. There are a lot of relationships within a season as well.

*Even at a seasonal level, we’re not necessarily measuring true talent so much as performance. Estimating true talent involves a lot of regression, and that’s a fun and important study, but not what I chose to focus on for this tool.

A few years back, Steve Staude published a hitting stat correlation tool that let anybody explore these correlations at their leisure. It was a fun way to explore the data, not to mention a neat piece of Excel engineering. I wanted to bring it up to date a bit, and in the process switch from Excel to Tableau. I can’t embed the view in this post, but you can view it by clicking through to the view on Tableau Public.

I decided to include every season in the FanGraphs database (I’m sure I owe a database admin somewhere an apology). By default, it filters on 300 PA for both metrics (either intra-season or next season), but you may drop the floor to 1 PA. It’s a terrible idea and you really shouldn’t do it, but I’m not here to tell you how to live your life.

I also added a yearly trend of the correlation. For most stats, this doesn’t add a lot, but there are some interesting stories. For instance, the yearly correlation between BABIP and AVG for players with 300 PA has been slowly dropping in the last 20 years. Reflective of more emphasis on walks, or perhaps defensive positioning?

The player with the highest swing rate and lowest strikeout rate? Randall Simon in 2002, with a 63.6% swing rate and a 5.9% K rate, which seems like some sort of joke. All that swinging meant a low 2.9% walk rate, so it’s not like he got away with anything.

The usual caveats about correlation not equaling causation apply. Just because you get a high r-squared doesn’t mean there’s a causal relationship; one always has to apply a common-sense analysis as well. That said, dive in and have some fun.


Texas Medicine

The 2016 Texas Rangers finished with just 82 wins. With an aging core and a desiccating farm system, the Rangers are drifting toward baseball’s Sargasso Sea of medioc-

What? You say the Rangers won 95 games last season?? Get on with your bad self!

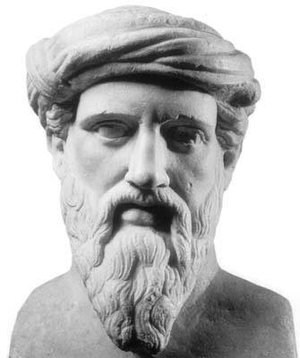
Hmm … diligent research has revealed that the Rangers did indeed win 95, despite a microscopic run differential of +8, the lowest positive run differential in the majors last year. That wily Pythagoras pegged the Rangers at 82 expected wins last season, and perhaps unsurprisingly, FanGraphs currently projects the Rangers to win, yes, 82 games next season. A modest uptick in offense (due in significant part to having Jonathan Lucroy available for the whole year) will be offset by a modest erosion of the Texans’ already leaky run prevention. With an aging core and a desiccating farm system, the Rangers are drifting toward baseball’s Sargasso Sea of mediocrity, a team neither good enough to challenge for a playoff spot, nor bad enough to enable Total Roster Makeover.

For public consumption at least, Rangers’ GM Jon Daniels is acting like he has a 95-win team on the roster, throwing out speculation that the team may be after Andrew McCutchen, Edwin Encarnacion, or perhaps even Chris Scissorshands. Daniels is, on the evidence publicly available, a rather capable individual, and it is difficult to believe he is ignorant of the true state of his team.

He has a core of four 3+ win players (Yu Darvish, Cole Hamels, Adrian Beltre, and Lucroy), none of whom is younger than 30. They have some young guys with upside (Rougned Odor, Nomar Mazara, Jurickson Profar, Joey Gallo), a glove-first shortstop whose contract won’t end until after humans have colonized Mars, and Shin-soo Choo, who has become the fragile platoon corner outfielder that many feared when he signed his own post-Mars-colonization deal.

Fortunately for the Rangers, their roster weaknesses are glaring. They have four positions (1B, CF, DH, and 5th SP) that each project to amass fewer than 1 win. These should be the focus of Daniels’ attention. Let’s take them in turn:

1B/DH

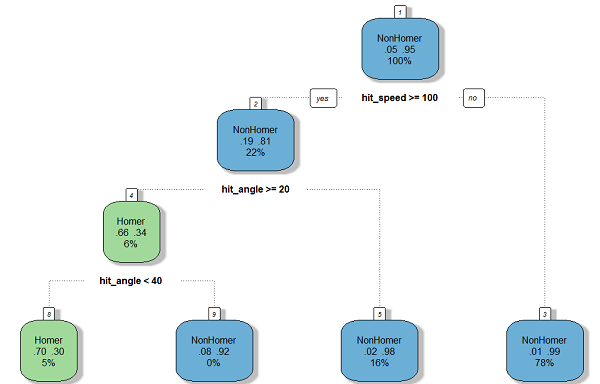
I’ll consider these together, because the Rangers can fill one of these positions with Joey Gallo, if they don’t trade him. Gallo is a true baseball anomaly, and his big-fly-big-whiff profile has been well chronicled. He had a 34.6% strikeout rate in AAA last year, a rate qualifying hitters exceeded only twice in the majors since 2007:

Mark Reynolds     2010     35.4%

Chris Carter           2013     36.2%

And the bad news is that neither of these whiffly guys broke 30% in their minor-league careers (leaving out a very short appearance in AA by Reynolds). So Gallo walks (and homers, and strikes out) alone. If the Rangers really were a 95-win team, they would probably be best served by moving Gallo for whatever they could get, which would undoubtedly be a useful return. A 95-win team can move a prospect for an overpriced veteran who will nevertheless put them over the top. But that team is not the Rangers, who are probably better off seeing what they have in Gallo, working him into the lineup as soon as practicable. But Rangers fans beware! No windshield in the Dallas-Fort Worth-Arlington metropolitan statistical area will be safe.

That still leaves a big hole at the other position. Profar could play first, but his bat likely won’t be able to carry the position, at least not yet. Encarnacion wants a megacontract, and while the Rangers may be able to afford the cash (they have the eighth-highest payroll in the AL next year, and they have a Texas-sized TV contract) the contract length will be brutal. Encarnacion recently turned down 4y/$80m from the Blue Jays, so he’ll presumably want more than that from the Rangers (or anyone else). Thanks to the qualifying offer, he’ll also (for now, at least) cost a first-round pick. While he obviously would provide some short-term help for the Rangers, adding a very expensive and declining veteran on a long-term deal probably isn’t the kind of move an 82-win team should be making.

Last season, E5 had his worst wRC+ and ISO since 2011, and his worst K% since 2009. Next year will be his age-34 season, and while even a decaying Encarnacion can help a team, his punishing contract is likely a better fit for a team that already has almost every other piece in place. For all his gaudy counting stats, E5 projects as just a 2.4 win player next year. The Rangers can probably get better results by spreading his putative salary over a larger number of players and a lower number of years. A platoon of Steve Pearce and Pedro Alvarez at DH could be the bargain-hunter’s option here. And let’s not overlook Ronald Guzman, who had a breakout season in AA last year (.825 OPS) before struggling in 95 plate appearances at AAA. He’s not a top prospect, but he’s still only 21, and he could be a useful piece later in 2017.

CF

The conversation probably starts with McCutchen, who appears to be a good buy-low candidate from a Bucs team that obviously wants to sell. Cutch has a team-friendly deal and a reputation as a glue guy, but the key questions are (a) will he ever hit again and (b) will he ever field again? The Rangers are going to have start restocking the farm soon, and giving away what remains of their young talent for McCutchen seems shortsighted unless they are convinced they can fix him (or that he can fix himself). Steamer, for what it’s worth, sees a significant bounceback.

Carlos Gomez presents a (much) less exciting option, but also one that will only cost money, and perhaps not in excessively painful amounts. If the Rangers believe that his health has returned for more than a minute, Gomez could fill the bill, but most of the value he has is likely to be on defense, and the Rangers did not have an especially fly-prone staff last year (nor will the addition of Andrew Cashner change that much).

Dexter Fowler raises some of the same issues as Encarnacion, though on a smaller scale. Although he put up adequate defensive numbers last season, most metrics have  seen him as a below-average center fielder throughout his career, and he will surely want more years than make sense for the Rangers’ current position on the development curve. He’ll also (for now) cost a first-round pick. All of the above is true with even greater force with respect to Ian Desmond. The Rangers should make sure he becomes someone else’s problem next year.

If the Rangers can somehow swing a trade involving Profar and one or more lesser prospects for McCutchen, then that might be the best plan. (I’m not forgetting Marcell Ozuna here, but I’m assuming he’ll cost even more in prospects than McCutchen, and I’m not assuming he’ll be able to retain his OBP progress from last year.)  There are no great options here, but the lower-risk move is probably to sign Gomez.

Starter 5

A.J. Griffin is currently slated for the cannon-fodder spot in the rotation, and this year’s free-agent pitching class is legendarily bad. Rich Hill could be a perfect fit, given that he won’t ask for too many years and is having a late-career resurgence that may only be explicable with reference to the dark arts. As a fly-ball pitcher, however, he would need help in center (e.g., Carlos Gomez), and he might cough up a few more homers than last year. And he’s obviously an injury risk, but that will be priced into the deal.

Ivan Nova (!) is probably the next-best option. Steamer projects a 2.3-win season, in line with what he achieved in 2011, 2013, and last year. I’ve never been a big Nova fan, but the Rangers don’t have a lot of options here, so he may be a decent plan B if Hill signs elsewhere. And that Top-100 prospect, southpaw Yohander Mendez, has put up good minor-league numbers across six levels (counting the three A levels separately): a collective 2.46 ERA over 292 innings, and an 8.6 K/9. He’ll also be just 22 next year. While probably needing a bit more seasoning, he could reach the rotation in next season’s second half if (when?) Cashner or Martin Perez falters, or Hill gets hurt.

* * *

The 95-win Rangers were an illusion, and their chances of standing toe-to-toe with the Astros in the 2017 AL West are slim indeed. Instead, they need to start preparing for the post-Beltre era. They have some good young talent in place and a front office that has shown aptitude for acquiring more. They can attempt to sneak into the playoffs this year at relatively low cost, while retaining a cadre of young talent with which they can challenge the Astros’ AL West dominance in the years to come. Or they can act like a 95-win team. Sometimes it’s better to take the medicine.


Michael Lorenzen Is the New Brian Wilson

Have you heard of Michael Lorenzen?  You might have heard of Michael Lorenzen.  You’re a baseball fan, and he plays baseball.  But chances are, you haven’t heard of him.  He’s a mostly unremarkable relief pitcher for a very unremarkable Cincinnati team.  He put up a 2.88 ERA with a 3.67 FIP for the Reds in 2016, hurt by a 22.7% HR/FB rate.  But he did do something special last year, and that something special is worth noting.  Before getting into that, though, let’s take a trip to the distant past of 2009.
Read the rest of this entry »


The 2017 Hall of Fame Pity Vote Candidates

For the next month and a half, while you’re scouring the internet for hot Mark Melancon rumors, you’ll likely run into a number of people sharing their opinions about the Hall of Fame ballot. Most of the time, those opinions will concern the best players on the ballot, rehashing old arguments about Barry Bonds and Curt Schilling, or maybe they’ll focus on some of the newcomers with a chance like Ivan Rodriguez or Vlad Guerrero. And if you like that, great! You’ll have plenty of reading material. But this won’t be one of those opinion pieces. Here we are going to talk about the denizens of the ballot and let them ride off into the sunset.

Read the rest of this entry »


The Qualifying Offer Is a Poorly Designed Tax

The qualifying offer is a tax that is designed to depress the salaries of free agents. I’m not sure it actually does a great job of that, but what is clear is that it has a number of other effects on free-agent salaries and destinations.

As a starting point, economists distinguish between good taxes and bad taxes. Good taxes have a few key features.

  • They are efficient – the simplest way to think about efficiency is that a tax doesn’t change your preferences that much. Once a tax is imposed you can buy less stuff overall, but in similar proportions.
  • They are fair, and in this context we mean that entities in the same position get treated equally.
  • They should be relatively easy to predict and understand.

The QO is not a good tax. A few of the worst features follow.

The rate of tax decreases for better free agents

Good taxes don’t distort preferences — at least not very much. Most consumption taxes (certainly in Australia) are charged as a percentage of the value of an item. Say a high-quality beer costs $10, and a low-quality beer costs $5. You can either have one good beer or two bad beers. Add a 100% tax (ouch). A bad beer costs $10, and a good beer costs $20. You are trading off a good beer for two bad beers and your preferences likely don’t change a lot, although you can probably buy fewer beers overall. Instead of a percentage tax, change it to a $5 flat tax per beer. I am now trading off 1.5 bad beers for every good beer – the tax has biased me towards high-quality beer (even more!).

The qualifying offer works as the latter kind of tax.

Take Cespedes and Trumbo. I will use Dave’s valuations (adjusted to make the math easier). Before the QO, say I value Cespedes at $120 million and Trumbo at $60 million. I trade off one Cespedes for two Trumbos (that’s a lot of Trumbo!). Now, say I am picking 16th in the draft with a pick valued at $20 million. The costs bump up to $140 million for Cespedes and $80 million for Trumbo. The ratio drops to 1.75:1. If I am a rational GM, the qualifying offer has significantly increased my valuation of Cespedes, relative to what I would pay Trumbo.

What this means in a general sense is that the qualifying offer makes the top-end guys more appealing (along with the players that don’t have taxes imposed on them), and erodes the market for the mid-market free agents.

The chart below plots the tax rate for a team with a draft pick valued at $20 million, assuming the cut-off for a team to offer a QO is a valuation of $20 million. What it shows is you have three zones: your cheap, tax-free free agents, your high-end, relatively low-tax guys and your middle-of-the-market danger zone. That Ubaldo signing last year, sheesh.

QO Tax by valuation

It applies at different rates to different teams.

Good taxes are meant to be equitable. That can mean it treats everyone the same, but sometimes it means that they tax better-off individuals at a higher rate. The QO attempts to do the latter. Unfortunately it introduces a new distortion in to the market. Every team faces a different rate of tax (a different draft pick), and a different set of relative prices between players.

Partially, this makes sense. MLB values competitive balance, and this is another approach to achieving that. However, this introduces an interesting wrinkle. The teams with the best draft picks at stake (the best teams) are biased towards the top of the free-agent class (and free agents that don’t have picks attached). Unfortunately this means that the worst teams are driven to the middle of the free-agent class, which history suggests is exactly where you don’t want to be shopping (Happy competitive balance day, here’s your tax-free Jeff Suppan!). This would be like exempting the poorest families from paying tax on tobacco.

Competitive balance matters, but worrying about achieving it with every tax is probably not the best approach. If you use modern tax theory as your guide, all that matters is that the system as a whole achieves your competitive balance objectives. Deal with competitive balance through mechanisms where it makes sense to (like revenue sharing and the draft) and then charge all teams the same free-agent tax.

The marginal rate declines when you buy more.

This one is odd. As I mentioned above, this tax bears a lot of similarities to excise taxes on gambling, smoking or drinking. These are the taxes at the government imposes to save us from ourselves. Here, the odd wrinkle is that the rate of tax declines when you buy your second free agent. This would be like the government levying a high rate of tax on your first packet of cigarettes, but exempting you from paying tax on your second packet because we didn’t get through to you the first time. The qualifying offer incentivizes teams to binge on the free-agent market once they have broken the seal.

The qualifying offer might not even depress salaries.

This requires some further research, but if owners aren’t spending money on free agents, the best alternatives are the draft or international free agents (or, pocketing more money). But both of these areas are capped, and the QO tax itself is paid in draft dollars. So, it doesn’t necessarily follow that this tax will depress the amount paid to free agents. It certainly redistributes money away from mid-tier free agents to upper- and lower-tier free agents, but the impacts on total spending are ambiguous.


Looking into Differences in Exit Velocity

Statcast has revolutionized the way we look at batted-ball data. We have been spoiled with exit velocity, launch angle and so much more. After looking into this treasure trove of data, I began to wonder, how closely is a hitter’s overall production tied to their exit velocity? More specifically, I wanted to uncover whether production was tied to differences between Air EV and Ground EV. First, I calculated the difference between Air EV and Ground EV from Baseball Savant. Next, I filtered the list to only include those with at least 100 batted-ball events to not skew the sample. I also calculated AIR% by adding together LD% and FB% to see who is maximizing their contact and see who may need a change in approach.

This first chart illustrates which players have the largest difference between Air and Ground EV:

Player Difference, Air EV and Ground EV (MPH) AIR%
Byung-ho Park 17.3 58.7%
Nick Castellanos 13.6 68.6%
Brett Eibner 13.0 57.6%
Ryan Schimpf 12.9 80.4%
Mike Napoli 12.9 63.6%
Oswaldo Arcia 12.9 58.2%
Adam Duvall 12.5 66.1%
Brian Dozier 12.3 63.6%
Sean Rodriguez 12.3 60.2%
Brandon Belt 12.1 73.8%

Byung-ho Park leads the way by nearly 4 MPH, with a difference of 17.3 MPH. With the exception of Eibner, Park and Arcia, this is a list of hitters whose primary BIP type is FBs. Each of these hitters has an AIR% over 60%, with Ryan Schimpf pacing the group at an incredible 80%. With such a stark difference in EV, each these players should focus on hitting the ball in the air to maximize their overall production. For Park, Eibner and Arcia, putting the ball on the ground severely limits how often they can make harder contact. All things equal, hard contact is better than soft contact and these players should adjust their approach accordingly to maximize hard contact, which could help their overall production.

As we move on, the next chart displays players with the smallest differences in Air and Ground EV:

Player Difference, Air EV and Ground EV AIR%
Billy Burns -2.4 46.8%
Melky Cabrera -2.2 56.9%
Max Kepler -1.5 52.8%
Matt Szczur -1.4 57.4%
Martin Prado -1.2 52.6%
Jose Peraza -1 56.5%
Lorenzo Cain -1 52.7%
Ryan Rua -0.9 47.9%
Miguel Rojas -0.7 46.0%
Tyler Holt -0.5 48.0%

The speedy Billy Burns tops this list, complemented by a group of players no one will mistake for sluggers. This group comes with considerably less ceiling and overall production. Of this group, only three guys managed to post a league-average or better wRC+ (Prado, Cabrera and Peraza). Lorenzo Cain has been better in the past but was hampered by injuries this past year. Cain and the three previously mentioned provide the blueprint for how this profile can work. By spraying the ball and making enough contact, these guys maximize their limited power but have a razor-thin line between their bats being productive and unplayable.

As an aside, there was only one player who had zero difference in his EVs. The culprit? Nick Markakis, which for some reason makes perfect sense. Anyways!

So now that I have shown the extremes we can begin to answer the original question: does EV difference even matter for overall production? To find out, I ran a couple different tests. First, I took the data and divided them evenly into quarters. The results look like this:

Group Average EV Difference Average wRC+  

Best Hitter

Top 25% 9.4 102 Joey Votto
25-50% 6.3 100 Mike Trout
50-75% 4.5 95 Miguel Cabrera
Bottom 25% 1.8 94 Daniel Murphy

The top 50% of hitters with large differences in EVs hit average or slightly better. Meanwhile, hitters in the bottom 50% produced slightly below average. To give each group a face, I took the best hitter by wRC+ and here we have four elite hitters. So far we have a very minor indication that says players with larger EV differences hit better than those with smaller differences. What we do not have is a concrete reason to disqualify a hitter from being elite based on their EV differences.

Next, I took the data and plotted players’ EV Differences and wRC+ to see if there was any correlation.  The graph is about as random as it gets with an R squared value of .022. This shows that there is a relationship between EV differences and overall offensive production but nothing significant.

All things equal, you probably take the guy with the larger differences but that does not guarantee any kind of success. We now know that their differences of how hard they hit balls in the air or on the ground do not preclude them from being elite. Hitting is both art and science and what we have learned today only reinforces that hitters can have very different profiles and still have excellent results.


Ervin Santana’s Sneaky Good Career

As of right now there are only eight active pitchers with at least 150 major-league wins on their resume: CC Sabathia, Bartolo Colon, John Lackey, Justin Verlander, Zack Grienke, Felix Hernandez, Jake Peavy, and Jered Weaver. Unsurprisingly, Jon Lester is only four wins away from joining the group. Cole Hamels is 14 off the mark. With a little bit of run support from the Minnesota Twins’ juggernaut of an offense, Ervin Santana can also join this exclusive group in 2017. Without a little research, it would’ve taken me at least a couple dozen guesses before I arrived on Mr. Santana as a candidate to join this group. He has flown under the radar for years now and it is about time he got his due credit as a solidly above-average major-league starting pitcher.

The problem with Santana is when he’s bad, he’s extremely bad. His disastrous seasons in 2007, 2009, and 2012 left us wondering when his next implosion would arrive. With those seasons well in the rear-view mirror, we can look at them as anomalies rather than Ervin’s reality. His 2012 in particular looks like a result of huge misfortune. His HR/FB shot up to 18.9%, 6.1% higher than any other season of his. As a result, his HR/9 approached 2. While Ervin has always been semi-homer prone, it is safe to say that a season like his 2012 was either a fluke or could be attributed to some kind of injury.

Early in his career, what plagued him was his low GB% and high walk rate. Slowly, as his career has progressed, he has become much more of a groundball pitcher and gotten control over his ballooning walk rate. His groundball rate has been above 40% every year since 2011 and his walk rate has been around or below three walks per nine every year since 2007, something that could not be said for his first three years in the league.

He is at 25.3 fWAR for his career, which is good for 19th among active pitchers, hovering around names with a much more successful connotation such as Ubaldo Jimenez and Scott Kazmir. It is easy to look past Santana and more towards guys such as Jimenez and Kazmir because the latter have done it with much more flash. Santana’s only standout season was way back in 2008, and since then he has only posted one season above 3.0 fWAR, his 2016 season. In other words, Santana has done it with under-the-radar consistency a la Bartolo Colon.

In the hypothetical world where there exists a Hall Of Solidly Good, Ervin Santana would be a first-ballot Hall-Of-Gooder. What strikes me is how different the baseball world seems to view him from what the numbers say about him.


The Season’s Least Likely Home Run

Jeff recently ran two articles about the season’s worst and best home runs, as measured by exit velocity.  As a small addendum to that, I’d like to include both exit velocity and launch angle to try to determine the season’s least likely home run.  So how do we do such a thing?  Warning!  I’m going to spend a bunch of time talking about R code and machine learning.  If you want to skip all that, feel free to scroll down a bit.  If, on the other hand, you’d like a more in-depth look at running machine learning on Statcast data, hit me up in the comments and I’ll write some more fleshed-out pieces.

As usual, we’re going to rely heavily on Baseball Savant.  Thanks to their Statcast tool, we can download enough information to blindly feed into a machine-learning model to see how exit velocity and launch angle affect the probability of getting a home run.  For instance, if we wanted to make a simple decision tree, we could do something like this.

# Read the data
my_csv <- 'hr_data.csv'
data_raw <- read.csv(my_csv)
# Make training and test sets
library(caret)
inTrain <- createDataPartition(data_raw$HR,p=0.7,list=FALSE)
training <- data_raw[inTrain,]
testing <- data_raw[-inTrain,]
# rpart == decision tree
method <- 'rpart'
# train the model
modelFit <- train(HR ~ ., method=method, data=training)
# Show the decision tree
library(rattle)
fancyRpartPlot(modelFit$finalModel)


That looks like what we would expect.  To hit a home run, you want to hit the ball really hard (over 100 MPH) and at the right angle (between 20 and 40 degrees).  So far so good.

Now, decision trees are pretty and easy to interpret but they’re no good for what we want to do because (a) they’re not as accurate as other, more sophisticated methods and (b) they don’t give meaningful probability values.  Let’s instead use boosting and see how well we did on our test set.

method <- 'gbm' # boosting
modelFit <- train(HR ~ ., method=method, data=training)
# How did this work on the test set?
predicted <- predict(modelFit,newdata=testing)
# Accuracy, precision, recall, F1 score
accuracy <- sum(predicted == testing$HR)/length(predicted)
precision <- posPredValue(predicted,testing$HR)
recall <- sensitivity(predicted,testing$HR)
F1 <- (2 * precision * recall)/(precision + recall)

print(accuracy) # 0.973
print(precision) # 0.792
print(recall) # 0.657
print(F1) # 0.718

The accuracy number looks nice, but the precison and recall show that this is far from an amazingly predictive algorithm.  Still, it’s decent, and all we really want is a starting point for the conversation I started in the title, so let’s apply this prediction to all home runs hit in 2016.

Once you throw out some fairly clear blips in the Statcast data, the “winner”, with a 0.3% chance of turning into a home run, is this beauty from Darwin Barney.*  This baby had an exit velocity of 91 MPH and launch angle of 40.7 degrees.  For fun, let’s look at where similarly-struck balls in the Rogers Centre ended up this year.

* I’m no bat-flip expert, but I believe you can see more of a flip of “I’m disgusted” than “yay” in that clip.

Congrats Darwin Barney!  There are no-doubters, then there are maybes, and then there are wall-scrapers.  They all look the same in the box score, but you can’t fool Statcast.


The Brewers Will Steal More Bases than Anyone In 20 Years

Checking out the Brewers’ team dashboard from 2016, and — HOLY HELL THEY STOLE A TON OF BASES. That’s 181, to be exact. Forty-two more than anyone else in the league. The seventh-most since 1996. The craziest thing about the Brew-Crew’s stolen-base total is that they didn’t even steal as many as they could. A huge chunk of the stolen bases came from break-out star Jonathan Villar, but an even bigger chunk came from three young up-and-comers in Hernan Perez, Orlando Arcia, and Keon Broxton. These three combined for fewer than 1000 plate appearances and all are expected to be starters at the outset of the 2017 season. The Milwaukee Brewers are going to challenge the 1996 Rockies’ number of 201 stolen bases for most team stolen bases in two decades.

Sensationalist title aside, it will take a little luck for the Brewers to break the 201 mark. Jonathan Villar alone will have a hard time repeating his 62-steal output, but right now I’m going to figure out just how the Brewers can make this work.

Firstly, they’re going to need health. Have a catastrophic injury to Villar and their chances of breaking the record go out the window. Same can pretty much be said about Broxton or Perez. Injuries are never fun so I’m going to put them aside just for this exercise in the name of entertainment. In a miracle by the Brewers training staff, all of their speedsters have a clean bill of health on the season and with that play in 150+ games. Same goes for solid stolen-base contributors in Ryan Braun and Scooter Gennett.

Jonathan Villar’s 2016 turns out not to be a fluke. He comes slightly back down to earth and steals only 50 bases in 2017, mostly attributed to his lower batting average/on-base percentage. Boom. Just like there we’re a quarter of the way there. As you can see, there’s no making it past 201 without Villar. In reality, I’d be pretty confident in betting the over of 50 steals for Villar.

Next is Hernan Perez. It’d be easy to extrapolate and and say in a full season, Perez would surpass 50 steals. The problem is it is hard to believe Perez will repeat his 2016 success. If Perez manages to stay in the lineup all season, he could easily make it past 40 steals, with 50 not out of the picture. Let’s play it safe and pencil Perez in for 40 steals. Okay, we made it to 90 after just two players.

Here’s where we can have a little fun. Brewers top prospect Keon Broxton is a strikeout machine. Even with those strikeouts, he made a big splash in his rookie 2016 season, hitting nine homers, stealing 23 bases, and sporting a .354 OBP in 254 plate appearances. Although Broxton has always been a big strikeout guy, there is reason to believe he might see some improvement. His K% of over 36% is bound to fall at least a few points. Age is also on his side. With a hypothetical decrease in whiffs, we can expect an increase in his already steady on-base percentage. I’m going out on a limb and predicting 50 steals for Broxton in a breakout sophomore campaign. That’s 140. A ton needs to go perfect for the team from Wisconsin but there is at least reason to believe these players can get 140 steals between the three of them.

The speed does not stop there. The Brewers’ top prospect, Orlando Arcia, stole 23 bases combined in Triple-A and the major leagues last year, his debut season. In Double-A in 2015, he stole 25 in 129 games. The young shortstop is expected to begin the season as Milwaukee’s starter. He should easily surpass the 20-steal mark assuming he holds onto the full-time job. With the running environment afforded to him in Milwaukee, I’d expect at least 25, with room for more. Twenty-five steals would have been the most on 19 different teams in 2016. Twenty-five might be the fourth-most on the 2017 Brewers alone.

From this point on the Brewers need to steal fewer than 40 bases to surpass the 201 mark. You don’t have to look far for those steals. Ryan Braun is getting older but he still stole 16 bases last year, and 24 in 2015. Scooter Gennett stole eight bases last year and reached double-digit stolen bases three times in his minor-league career. Kirk Niewenhuis stole eight bases in fewer than 400 plate appearances last year. Domino Santana is expected to see a full year of playing time barring injury, and has breached the double-digit mark in stolen bases in his minor-league career. And then there’s the occasional catcher steal or maybe even a steal from a pitcher or two. This is also not including any off-season deals the Brewers might pull off.

Adding all of this together, somehow it is even easier to see the Brewers blowing past the 1996 Rockies’ mark of 201 steals. Of course, with predictions like this a lot of things have to go right. They are largely dependent on a few speedsters, they have to avoid injuries, and the players still have to perform well enough to even have a chance to steal their bases. All in all, the 2017 Brewers have as much, if not more, of a shot of passing the 201 mark than anyone in the last 20 years.


Travis Jankowski and a Sub-Optimal Approach

The Padres have had an interesting year both on and off the field from the GM getting suspended for hiding medical information to trying to convert Christian Bethancourt into a Swiss Army Knife. One of the least interesting things about the Padres was the on-field product. In Year 2 of Prellermania, the Padres lost 94 games and spent time stocking the farm for 2018 and beyond. At present, there are few players of interest on the Padres. The one I find most interesting, however, is Travis Jankowski.

Jankowski just delivered 2.1 WAR playing in 131 games, primarily in CF, making him a useful player. A majority of this production comes from his defense and base-running, where he racked up 8 DRS and 3.1 BsR to make up for a below-average 82 wRC+. With that said, I believe Jankowski has additional upside that teams looking to upgrade in CF could target. Jankowski has some interesting metrics once you look past his surface stats that indicate there could be more upside than initially meets the eye.

This past season, Jankowski rated sixth in GB% at 58.4%, putting him in the company of Dee Gordon and Eric Hosmer. Jankowski also paced the league in going the other way, with an Oppo% of 39.1%. It seems obvious that Jankowski’s approach is to smack the ball the other way and let his 70-grade speed do the rest. Diving into Statcast, we find that Jankowski had an average launch angle of 2.4 degrees, and an average exit velocity of 86.2 MPH, backing up what we know about Jankowski’s groundball tendencies.

Diving deeper is where it gets interesting. I found that Jankowski had an average EV of 83.5 MPH on balls above 10 degrees compared to 90.8 MPH on balls below 10 degrees. In simpler terms, Jankowski makes a majority of his hard contact on the ground. Given his status as a lefty-hit / righty-throw guy, this makes some sense as a guy whose bottom, more dominant hand pulls the bat through the zone early, making it more difficult to get the ball up in the air. Still intrigued, I wanted to find hitters with similar EVs on launch angles below 10 degrees and came up with the following:

Name Exit Velocity 2016 wRC+
Jason Heyward 91.52 72
Ben Revere 90.99 47
Tyler Saladino 90.88 93
Travis Jankowski 90.84 82
Xander Bogaerts 90.69 113
Jace Peterson 90.56 95
Alexei Ramirez 90.44 63
Cesar Hernandez 90.4 108
Martin Prado 90.35 109
James Loney 90.26 89
J.T. Realmuto 90.25 107
Denard Span 90.24 96
Average 90.6 90


This is an interesting group of players, headlined by superstar Xander Bogaerts and the solid Martin Prado, and yet it also includes the disappointing Jason Heyward and the DFA’d Alexei Ramirez. If anything, it shows how razor-thin the margin is for players with this type of profile.

Next, I looked at the same group’s batted-ball profile and took the average of their hit type and hit distribution to compare to Jankowski’s and came up with the following:

 Name LD% GB% FB% PULL% CENT% OPPO%
Jankowski 26% 58% 16% 24% 37% 39%
Average 22% 51% 27% 38% 36% 27%


Looking at their batted-ball distributions, Jankowski stands as somewhat of an outlier in this group. Most notable is his how he rarely pulls the ball in favor of going the other way. With these tendencies, Jankowski is actually depressing his own value with the bat. When Jankowski goes the other way, he has an average EV of 84.5 MPH. Compare this to pulled balls, where his average EV is 89.1 MPH. In most cases, pulled balls are always going to be hit harder, but for someone as extreme as Jankowski, the opposite-field approach may be suppressing his overall offensive production. If Jankowski shifts his approach to drive more balls with authority to the pull side, he could push his bat closer to the league-average mark. As noted, Jankowski is a 70 runner and the additional chances on base would only serve to increase his base-running value. With these changes we are looking at a potential league-average bat from a guy who already has above-average defensive and base-running skills. This would be an insanely valuable piece. As we have seen, the trade market does not value defensive value the same as offense, so the acquisition price shouldn’t be prohibitive.

To have maximum value, Jankowski has to play CF, but with top prospect Manny Margot about ready to take over the position full-time, the Padres may deem Jankowski expendable. For teams not willing to pay the prospect price for Charlie Blackmon or not wanting to see Yoenis Cespedes play CF again, Jankowski represents an under-the-radar acquisition that could be had for a reasonable price. Given his skillset, Jankowski shouldn’t rack up the traditional counting stats rewarded in arbitration, and he could provide excellent value throughout his years of control. The Padres as a whole may not be very interesting but they have an interesting player in Travis Jankowski, who could provide immense value to a team with the foresight to acquire his services.