The Cards and Dodgers match up in the Division Series for the first time since 2009. The Dodgers swept that series which is best remember for Matt Holliday’s dropped fly ball in Game 2. They met again in the NLCS last season and the Cards won the series 4-2 by knocking Kershaw around for seven runs in four innings. The Dodgers held a 4-3 edge in the season series by winning three of four in LA and avoiding a three game sweep by winning a July Sunday afternoon game in St. Louis. Five of the seven games were decided by two or fewer runs.
Note: I wrote this over the course of the two week period beginning 9/22 so stats were up to date when I pulled them.
Catcher: After back-to-back top five MVP seasons and his first silver slugger award, Yadi was due for some regression this year. He broke his hand sliding on July 9th and was out until August 29th. During the Yadi-less stretch, the Cards pursued every option, but a trade, to attempt to fill in. Tony Cruz (back-up), Audry Perez (call-up), George Kottaras (waiver claim) and AJ Pierzynski (free agent) all saw time and the team treaded water by going 21-19 without him. Any time a team loses a perennial MVP candidate, the hole will be noticeable:
|
Avg./OBP/Slg. |
Defensively |
| Yadi |
.283/.335/.391 |
896 IP, 3 PB, 22 WP, 20/43 CS (47%) |
| Not Yadi |
.225/.283/.289 |
508 IP, 4 PB, 22 WP, 7/38 CS (18%) |
Barring injury, Yadi will play every game this postseason. Hand/wrist injuries are major concerns for any hitter as they tend to sap power and Yadi is no exception. He finished the season without hitting a home run since his return from the DL and posted a weak .267/.312/.326 line compared to .287/.341/.409 before his injury. Fortunately, his defense hasn’t suffered much as he has nabbed three of eight base stealers (37.5%).Yadi’s ability to control the running game will be key against the team that led the NL in steals (Dee Gordon accounted for just under half). He’ll fail to hit .300 for the first time since 2010 and play his fewest games since 2007 but he’s still one of the best catchers in baseball for his contributions on both sides of the ball.
The Dodgers will deploy a platoon of AJ Ellis and Drew Butera. If it weren’t for the disaster of a platoon in Tampa, the Dodgers combined catcher production of .181/.282/.262 would be the worst in baseball. I expect Ellis will play almost the entire series, but it really doesn’t matter who is playing. Ellis has only thrown out 25% of base stealers so look for Wong and Bourjos to take some chances if they get on base. The only other somewhat interesting thing about Ellis is he’s managed to face Carlos Martinez ten times. He hit a home run so his .250/.400/.625 line looks menacing but he has also struck out three times in those ten plate appearances.
Edge: Cardinals
First Base: Matt ‘Big Mayo’ Adams took a step back this year. After hitting no lower than .321 in April, May, or June, he faded in the second half. Through the first two months of the season he had hit only three home runs which led many to question if he had traded power for average. He responded by clubbing 6 HRs in June but then failed to go deep from July 19th to August 22nd. Adams does not walk – his walk rate is among the lowest of qualified hitters, so if he’s not hitting for power or average, he’s not providing much of anything. The defensive numbers rate him as one of the best first baseman in the league. While that’s a stretch, he is limber for a big man and will surprise with his mobility and athleticism. In an ideal world Adams would be on the bench vs Kershaw and Ryu (if he’s healthy) since his platoon split is over 300 points of OPS. The Cards don’t have the luxury of having a RH 1B on the roster so he’ll be exposed.
The Dodgers counter with the league leader in RBI, Adrian Gonzalez, who posted his highest OPS+ since 2011 while playing in nearly every game. Since arriving in LA from Boston, he’s been a consistent run producer and a solid three-WAR player. Gonzalez will likely be sandwiched between Yasiel Puig and Matt Kemp in the Dodgers lineup and represents their only lefthanded threat. Look for Matheny to deploy Randy Choate and Sam Freeman against him on a regular basis. Gonzalez is 2-11 lifetime vs the two Cards lefties.
Edge: Dodgers
Second Base: Last seen being picked off to end Game Four of the World Series, Kolten Wong entered Spring Training needing to win his formerly presumed starting position from veteran Mark Ellis. Ellis ended up injuring his knee and Wong hit .375/.434/.646 in 18 Grapefruit League games to make the injury not even matter. He was the Opening Day second baseman and hit second. The honeymoon lasted 20 games and he was optioned to AAA for the next three weeks until his recall on May 16th. He then went on a ten game hot streak and won NL Rookie of the Month honors. Following his 4/5 performance on May 28th, he hit .089/.146/.200 over his next 15 games and went on the DL with shoulder inflammation.
Following a rehab stint in Memphis, he rejoined the team and finally received consistent playing time appearing in 63 of the team’s final 77 games. He also returned with new found power. Prior to his injury on June 20th, he had hit only 1 HR and was slugging .304. Following the injury he has hit 11 HRs and slugged .467. He’s the Cards best basestealing threat and led the team with 20 SBs in 24 attempts. He also is an outstanding defender. Really, the only knock on him is he doesn’t walk that much, but that’s mitigated by his contact ability. Wong is still very much a work in progress but this has been a positive year. He’s shown all five tools and if he makes progress and becomes more consistent, he’ll be an All-Star second baseman.
When the Dodgers made a splash signing Cuban defector Alex Guerrero for $28 million over four years and paid Mark Ellis a $1 million buyout rather than exercise a $5.75 million option, it appeared that Dee Gordon would be left out. Gordon certainly hadn’t done much to help his cause as he had a career .614 OPS in 181 games entering this year. Gordon broke out this year, made the All-Star team, and has been worth 3.1 WAR. He’s fallen off in the second half as his OPS has fallen from .742 to .628. In the second half he’s only walked four times – once each in August and September. He’s only stolen 21 bases compared to 43 in the first half and has been successful only 68% of the time compared to 83% in the first half. There haven’t been any reported injuries. Despite all these factors, Mattingly continues to bat him leadoff. He’s the weakest hitter in the lineup and should be hitting eighth – ninth when Greinke pitches. Hopefully we see this happen again.
Edge: Cardinals
Shortstop: Jhonny Peralta has arguably been the Cardinals most valuable position player this year and certainly worth every penny of the four year, $53 million contract he signed this offseason. He batted in every lineup position from second to seventh. He fended off a late season charge by Matt Holliday to lead the team with 21 home runs. Many felt Peralta got off to a low start as he hit only .196 in April. A .178 BABIP was to blame and Peralta regressed to a .311 BABIP, not far off his career .312 mark, for the rest of the season. His walk rate was his highest since 2007 which propelled the best BB/K ratio of his career.
Much has been written about his defense as all of the defensive statistics suggest he’s one of the best fielding SS but he doesn’t quite pass the eye test. He made 98.2% of routine plays – good for fourth among qualified shortstops but quickly fell down the Inside Edge leaderboards finishing 19th out of 22 qualified shortstops in “even” plays (40-60% of the time, the play is made) and 16th in “unlikely” plays (10-40%). While he’s not the defensive wizard some of the metrics suggest, he’s an extremely capable defender and extremely valuable to the Cardinals as a run-producer. As bad as the team’s offense has been, they would not be in the playoffs with Pete Kozma and his career .235/.297/.318 line.
Hanley Ramirez has lived up to his injury-prone label this year. Even though he’s only been on the DL once this year, Baseball Prospectus’s injury database lists 12 additional day-to-day injuries and he missed at least one game for six of those injures. The full list is below:
| Date |
Injury |
Games Missed |
| 9/16/2014 |
Right Elbow Sprain |
0 |
| 8/9/2014 |
Right Abdomen Sprain |
14 (DL) |
| 7/21/2014 |
Left Hand Contusion (HBP) |
3 |
| 7/5/2014 |
Left Hand Contusion (HBP) |
0 |
| 6/29/2014 |
Right Calf Strain |
3 |
| 6/24/2014 |
Right Shoulder Inflammation |
4 |
| 6/18/2014 |
Right Hand Contusion |
0 |
| 6/12/2014 |
Right Shoulder Inflammation |
1 |
| 5/24/2014 |
Left Calf Strain |
3 |
| 4/28/2014 |
Right Thumb Contusion |
0 |
| 4/26/2014 |
Face Laceration |
0 |
| 4/17/2014 |
Left Hand Contusion (HBP) |
1 |
| 3/7/2014 |
Left Arm Contusion (HBP) |
0 |
In the 2013 NLCS, Hanley was hit by a pitch in the ribs in game one and had to miss game two. Hanley was never a good defensive shortstop but the wheels really came off the train this year. Only Yunel Escobar was a worse defender by UZR. Even 40 year old Derek Jeter is better defensively than Hanley. The Dodgers recognize this and have removed him in 18 of the 19 September games he has started. The primary back up is Miguel Rojas who hits to the tune of .186/.250/.229 but has 11 defensive runs saved in under 300 innings – fourth most among SS with at least 200 innings at the position – and leads that population in RZR (revised zone rating). His defensive abilities allowed him to post 0.6 fWAR despite his batting line. Hanley is in there for his offense and he had the highest wRC+ of all qualified shortstops (due to Tulowitzki’s injury). He isn’t the MVP candidate he was in 2013, but he has rebounded from his down years to post his second highest OPS + since 2009, behind last year. He doesn’t have much of a platoon split, was consistent month to month and is still able to steal some bases. He’ll probably hit fifth for the Dodgers.
Edge: Cardinals. Peralta’s defensive ability pushes him over the top.
Third Base: Matt Carpenter exploded as a second baseman in 2013 and finished fourth in the MVP balloting. After the off-season trade of David Freese, Carpenter moved back to third base. While few expected him to repeat his 2013 season, he put up similar numbers – albeit without as much power. Last year he led the league in hits and doubles, while this year he led in walks. It was a different, but effective offensive profile. Carpenter hit leadoff in every game he started and posted at least a .362 OBP each month of the season. Carpenter is an excellent leadoff hitter – only Mike Napoli, Brett Gardner and Mike Trout saw more pitches per PA than him.
One knock on his game is his baserunning. While he set a career high with five stolen bases this year, he also advanced an extra base only 33% of the time. Only Yadi at 29% took fewer extra bases among Cards full time position players. The Cards as a team are bad baserunners and Carpenter exemplifies that. After making five errors in April while getting adjusted to 3B, he’s proven to be strong defensively. Carpenter is a very solid player and should be well worth the five year contract extension he received last spring.
Who would have thought Juan Uribe would prove to be worth his three year, $21 million contract he signed in the 2013 offseason? Uribe has now posted the two best seasons of his career by OPS+ and set new career highs for OBP in both seasons. He has the most postseason PAs of anyone on the Dodgers and has two World Series rings. He’s an asset on both sides of the ball; His OPS of .778 ranks seventh on the Dodgers but would rank second on the Cardinals. The former shortstop, who had only started at 3B in 220 of his 1,287 career games prior to 2013, trails only Manny Machado and Nolan Arenado in defensive runs saved since the start of 2013 at 3B. Somehow, someway, he’s become one of the best third baseman in baseball.
His peripherals took a step back in 2014 as his walk rate was almost halved from 7% to 3.7% and he was bolstered by a .341 BABIP. He’s hit RH slightly better than LH over the course of his career. All in all, this version of Uribe is very valuable when he’s on the field. The 35 year old made two trips to the disabled list this year with hamstring strains and his lone stolen base attempt occurred in April.
Edge: Dodgers
Left Field: Matt Holliday has been everything the Cards could have hoped for when they signed him in the 2009 offseason. By FanGraphs value, he’s been worth at least $20.4 million in each season. His .274 average, this year, is the lowest of his career but he’s been plagued by the lowest BABIP of his career, too. His .300 BABIP is .339 below his career BABIP, but some of that may be deserved as he’s hitting fewer line drives than ever. He only had six home runs at the all-star break but has been on a tear in the second half to finish at 20. He’s still somewhat of a defensive liability but the Cards really need his bat in the lineup at all times so he hasn’t been removed in close and late situations as often.
I’m assuming the Dodgers platoon Carl Crawford and Scott Van Slyke here.
Too much of Carl Crawford revolves around the awful contract Boston gave him in 2011. There’s still three years and more than $60 million remaining but he’s far from a disastrous player; hardly anyone could live up to that contract. Crawford is looking like a .285/.330/.400 hitter with some speed. It’s far from the traditional LF profile but it’s serviceable. Crawford’s career OPS is more than 100 points higher vs left handed pitching than right-handers. This year he’s got a flukey reverse platoon going on, but that’s noise. I except him to get the lion share of LF time in this series since the Cards will be throwing all RH starters. He’s certainly lost a step as a 32 year old, but he’s still able to steal bases at an 80% clip. He’s a marginal defender and doesn’t have much of an arm.
The other half of the platoon is St. Louis native Scott Van Slyke. I intentionally walked Van Slyke in the spring of 2005. He was a great hitter for our tiny high school league, but no one thought he’d ever put up the MLB numbers he has this year. He’s appeared at every OF position and first base – he was a pitcher and shortstop in high school – but he’s spent the majority of his time in LF. He absolutely demolishes left handed pitching. 13 of his 21 career HRs have come against lefties and this year he has a 1.039 OPS against them compared to a .769 OPS vs right handed pitching. Since the Cards don’t have a left handed starter, he’ll probably be deployed off the bench. He’s a good athlete and is more than capable In LF.
Edge: Cardinals
Center Field: Everyone immediately thought Peter Bourjos would break out in St. Louis following the trade last offseason. That didn’t happen. We saw that Bourjos is exactly what he had previously shown: A glove first, speedy, light hitting OFer. His biggest accomplishment in 2014 was staying healthy and he’ll play the second most games of his career. He has historically had a reverse split and that widened even further this year. I would not use him as much more than a defensive replacement in this series but I’m sure Matheny will start him for a game or two. He’s a great defender and will save a run or two this series in CF.
The better option in CF is the Federalist, Jon Jay. Much like he defeated Colby Rasmus, Jay seems to have squashed Bourjos’ hope of being an everyday CF in St. Louis. Jay isn’t flashy but he makes all the routine plays and some good plays. He isn’t well suited for the corners due to an extremely poor arm. He’s hit at least .297 over every season except in 2013 and is nearing a personal best OBP this year. He’s hit the fewest HRs of his career but that’s also because he’ll fail to top 500 PAs for the first time since 2010. I expect Jay to bat second for most of this series and play CF for 7 innings. He’s been a key component of the Cards recent playoff success and appeared in all 48 of the possible games since the start of 2011. The results haven’t been pretty as he’s hit .188/.263/.219 across 183 postseason PAs. He’ has never hit a postseason HR. Jay already played his way into a contract next year and will likely be back in St. Louis as the last remaining member of the Memphis Mafia (RIP Freese and Torty, Happy Trails Danny D).
The Dodgers have played Kemp, Ethier and Puig in CF at least thirty times each. None of them are CFs. Kemp used to be but now needs to play in a corner. Puig is best suited for RF but I expect he’ll play CF.
Last season Puig only started six of his 96 starts in CF and this season that jumped to 51 of 140. He has a very strong arm and finished second in MLB with 15 OF assists – trailing only fellow Cuban Yoenis Cespedes. He doesn’t move very well in CF but the Dodgers need him and Kemp in the lineup so they take the tradeoff. Among CFers with at least 400 innings, Puig was last in plays made outside his fielding zone. His teammate and fellow COF, Andre Ethier was just ahead of him with 18 CF plays made out of zone and no other CFer had fewer than 24. Jon Jay and Peter Bourjos, the Cardinals two primary CFers, had 57 and 69, respectively.
Where the Cardinals have the Dodgers on defense, Puig brings a well-rounded strong offensive profile to the table. He both cut his strike out rate and upped his walk rates in 2014 – the marks of a maturing hitter. One area of concern is the massive power drop in the second half of the season. After hitting 43 extra base hits in the first half, Puig only tallied 18 in the second half. The power drop is concerning, but his second half line of .278/.370/.420 was still good enough for a 130 wRC+ and significantly better than anything the Cards can expect. Puig isn’t the fastest runner and is aggressive and not a great baserunner. He was only 11/17 on steals this year and as Kemp and Gonzalez heated up in the second half, he significantly decreased his stolen base attempts from 14 to four.
Edge: Dodgers
Right Field:
Right field could be patrolled by a number of players for the Cards. Jon Jay could play when Peter Bourjos plays CF, Randall Grichuk will play vs LHP and Oscar Taveras will play the rest of the time. Grichuk has really come on since his August recall hitting .352/.364/.556 in 25 games (10 games started). His first two stints in MLB, earlier this summer, didn’t go as well as he hit .136/.191/.273. Most of this success is due to how he is being utilized: He must only bat against left-handed pitching. In AAA Memphis, he had a .974 OPS vs LHP whereas he cratered to .693 vs RHP. He doesn’t walk much so he really shouldn’t be hitting second as he has in 13 of his 19 games started. He’s a good fielder and only committed two errors all season at Memphis.
At any point in the past two years, if I was told I’d be more excited about Grichuk than Taveras going into this series, I’d be shocked. Oscar is just 22 so there’s no reason to panic but he hasn’t been able to contribute in any way this year. His defense and base running are below average and those really stick out when his prodigious bat doesn’t show either. Oscar has hit better in September but he’s only stated 11 games and has two extra base hits. He’s had some success pinch hitting but that’s mostly small sample noise than anything else. He’ll be on the roster and should play, but that’s a function of the Cards not having anyone better to take his roster spot.
Matt Kemp was left for dead earlier this season. He entered the All Star break hitting .269/.330/.430 and rumors swirled that he and the $107 million remaining over the next five years of his contract would be out of LA. The Dodgers kept him and he responded by hitting .303/.360/.589 with 16 HRs in the second half. That’s not too far off from the version of Kemp that finished second in the 2011 NL MVP balloting. The major difference between those two Kemps is the speed. In 2011 Kemp stole 40 bases. This year he has only attempted to steal 13 and he was thrown out on five of those attempts. In 2011 he advanced the extra base 62% of the time; this year he only advanced 41% of the time. The wheels are gone. As such he’s been relegated to right field. The two-time Gold Glove award winner is now a below-average RFer. His arm is still strong and he’s recorded five assists in fewer than 500 innings which would put him among the leaders at the position over a full season. He’s also managed to stay healthy this and only Adrian Gonzalez played in more games for the Dodgers than he did. All in all, he’s an asset and his power makes him a threat each time at the plate. He is a career .240/.286/.327 hitter in 42 games vs the Cards, so maybe they’ll contain him.
Edge: Dodgers
Bench: The Cardinals bench is slightly better than last year, but still remains one of the weakest in the league. The one constant since the start of 2011 has been Daniel Descalso, but he had the fewest PAs of his career since his cup of in 2010. He eclipsed 300 PA in each of the next three years but didn’t top 200 this year due to stability at 3B and SS and better options at 2B. He appeared at every infield position and is capable everywhere, but should not play SS. This is likely Descalso’s final rodeo with the Cards as he’s due a big raise in arbitration and his season numbers are in line with his careers numbers only because of a BABIP induced .324/.452/.412 line in the second half compared to .182/.234/.239 in the first half. Look for rookie Greg Garcia to fill Descalso’s role for a quarter of the cost, and better SS defense, next season. Descalso won’t be much of a factor this series.
Joining Descalso on the bench will be AJ Pierzynski, Pete Kozma, Oscar Taveras and Randal Grichuck. Pierzynski joined the team shortly after Yadi’s injury and his from the Red Sox. He had three hits in his debut with the team and even with that performance he posted worse numbers than he did in Boston. Cruz is even worse but has been with the team longer and is slightly better defensively – though as shown above they’re both bad. AJP can hit right-handers respectably enough to be a backup catcher. Cruz can’t hit anyone and offers no value.AJP better be on the team and Matheny should not be afraid to use him as a pinch hitter, even if it leaves no backup catcher on the bench.
Pete Kozma is back for another October after being DFA’d in April. The team is 9-4 when he plays and 4-1 when he starts in 2014. This is not a coincidence. Kozma is a proven winner and brings clutch hits and amazing defense. Look for him to appear at SS or 2B in close and late situations and even get a start or two against Kershaw and Ryu. The best games of Kozma’s career happen in October and expect another standout performance or two from him. Kozma is also short for Kershaw killer as the Pistol is 4-8 with 3 2Bs and a walk against him.
The Dodgers have a much better bench as I’ve already discussed whichever of Crawford and Van Slyke isn’t playing, above. Joining them will be one of the most surprising hitters in the majors this year, Justin Turner, long time righty killer, Andre Ethier, the aforementioned defensive wizard, Miguel Rojas, and a backup catcher. Turner and Ethier are the players of note here. Not many fans know Turner posted an .897 OPS in322 PA this year. In his previous 926 MLB PAs, he hit eight HRs. This year, he hit seven. He’s always been a good contact hitter and got BABIP luck of .404 to post a .340 average while appearing at every infield position. He didn’t have much of a platoon split. Look for him to get contact oriented pinch hits opportunities and potentially relieve an injured Dee Gordon or Hanley Ramirez.
Ethier will be Mattingly’s foil for the Cards RH dominant bullpen. He’s not the hitter he once was and has a disastrous contact, but he managed a .253/.325/.385 line against RH pitching this year and hit all four of his HRs against them. He saw his playing time dwindle and only started 22 games in July, August, and September after starting 19 in each of the season’s first three months. 40 of his 115 career PH appearances came this year and he hit .290 in them. He’s a terrible defender and barring injury to any of the four OFers ahead of him, won’t see the field at all this series. His best hope of consistent playing time is to DH in AL ballparks vs right handed pitching in the World Series.
Edge: Dodgers, sizably.
Starting Rotation:
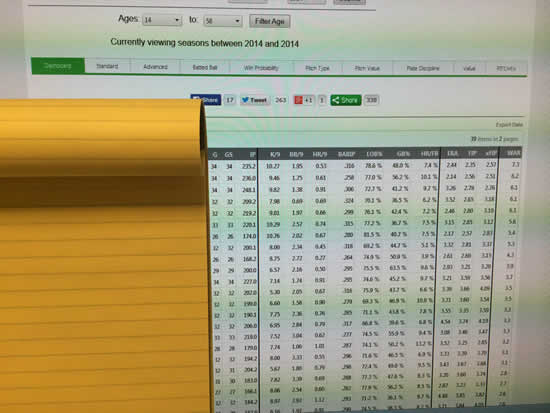
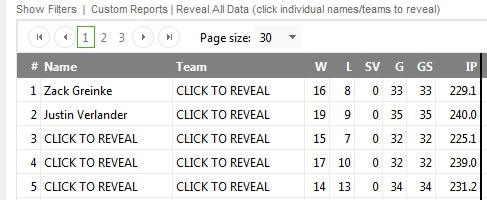
Any discussion of the starting pitching in this series begins and ends with Clayton Kershaw and Adam Wainwright. Through the end of April, it sure looked like the Cy Young award was Wainwright’s to lose. He had gone 5-1 with a 1.20 ERA while Kershaw was on the DL following his season opening start in the Australian series. Kershaw would return in the beginning of May and go on to lock up the Cy Young award and, in my opinion, the MVP award too. Despite opposing hitters have their highest BABIP against him since 2010, Kershaw posted the lowest ERA, FIP and xFIP of his career. He also posted the highest strikeout rate, lowest walk rate and highest ground ball rate of his career.
He’s had an ERA in the ones in each of the past two seasons and combined to allow 87 earned runs. To put that in perspective, 21 starters allowed at least that many runs just in 2014. He’s remarkable. The Cardinals as a team have a .273/.365/.367 line against him and they were able to beat him twice in last year’s NLCS. Maybe they’ve figured something out, but I’d expect Kershaw to dominate. The Cards will need to beat him at least once to win this series in my opinion.
Wainwright will opposed Kershaw, but he’s in a completely different league. Wainwright had an incredibly successful season, allowing his fewest runs since 2008 and holding batters to their lowest average against him. His velocity is down about a full MPH from last season, but he’s an incredibly intelligent pitcher and finds ways to get batters out even when his stuff isn’t at its best. He had a rough stretch of “dead arm” in August which produced a 5.17 ERA but appeared to right the ship in September going 5-0 with a 1.38 ERA and average just a hair under eight innings per start. Wainwright does an outstanding job controlling the running game and opponents only attempted eight steals against him this season with three of the eight coming in games caught by Tony Cruz. Look for Waino to work deep into the game. Only James Shields and RA Dickey have thrown more regular season innings since the start of 2012 and in that span Wainwright has 50 innings in the playoffs on his arm.
The matchup for game two will be Zack Greinke and Lance Lynn. Coming into this season, Lynn was seen as a pitcher who benefited from good run support to post high win totals and prone to breaking down in the second half. He dispelled both of those ideas this year as shaved more than a run off his previous career low ERA, thanks in large part to a strong second half. Lynn has now made at least 29 starts in each of his three seasons as a starter and has been remarkably consistent as his FIP’s for each year has been between 3.28 and 3.49. Since the start of 2012, he’s thrown the 25th most regular season innings and has the 13th lowest HR/9 of all starting pitchers. The Dodgers hit Lynn hard in his start against them in LA – it was his worst start of the season – but he was much better at home. Lynn, like Wainwright, does a good job controlling the running game and opposing runners were only one for four taking bases against him. Lynn has really struggled as a starter in the postseason going 1-3 with a 4.50 ERA and never making it through the 6th inning.
Zack Greinke has been one of the most consistent pitchers since returning to MLB in 2007. He’s only been on the DL twice for flukish reasons – he broke a rib playing basketball in the offseason then broke his collarbone in a brawl. He posted his best FIP since his 2009 AL CY Young season and set a new career high in K/BB ratio while throwing the most change-ups of his career. Greinke is a very cerebral pitcher, like Wainwright, and can get hitters out by making smart pitches even when he doesn’t have his best stuff. The Cardinals need to attack Greinke early. Batters have hit .314/.351/.450 on the first 25 pitches of his starts this offseason and after he settles in, he really clamps down. Additionally, batters have hit .355/.351/.720 on 96 first pitch PAs against him. Greinke adds some value at the plate as he had the third highest OPS of any pitcher and the lowest strikeout rate. If the 2014 Lance Lynn shows up and puts his poor playoff appearances behind him and the Cardinals attack Greinke, this is a very winnable game and they’ll be back home with a 1-1 split.
Game three will likely feature former Cardinal Dan Haren and recent Cardinals acquisition John Lackey. Lackey didn’t exactly endear himself to Cardinal Nation following the controversial trade for Allen Craig and Joe Kelly. He struggled to a 3-3 record and peripherals closer to his disastrous 2011, “chicken and beer” season in Boston than anything else. It could just be noise – Lackey allowed no more than two earned runs in eight of his ten StL starts; in the two starts he allowed six and nine runs. In those eight starts, he went at least six innings in each except for one ejection. He’s thrown 104 innings in 16 starts over seven postseason series and appeared in relief on throw days twice. That’s exactly the type of bulldog mentality the Cards hope show up this October. In his short time with the Cardinals, the defense has been uncharacteristically shaky behind him as five batters have reached on error in 60.2 innings: The team made 8% of its errors in 4% of its innings. Lackey, like the rest of the staff, pitches better at home. In only five starts, he pitched 34 innings with a 2.38 ERA and only walked five batters. Game three will be in St. Louis so hopefully Lackey maintains that performance.
Dan Haren will oppose Lackey in game three (assuming Hyun-jin Ryu isn’t able to go). He’s now entered the twilight phase of his career and is at best a fourth starter. He’s bounced from the LA Angels to Nationals to the Dodgers in the past three years, but should be back in LA next year as his $10 million option for pitching 180 innings vested in his final start of the year. Haren is very susceptible to the long ball. Over the past three years only RA Dickey has allowed more home runs than him. One point in the Cardinals favor is right handed hitters have been historically better (+0.035 OPS points) against Haren than left handed batters. In 2014 he posted his lowest K% since 2005. With the Dodgers suspect defense, the Cardinals must put the ball in play vs Haren. Greinke and Kershaw will strike hitters out, but Haren is much more hittable. The Dodgers will be hopeful to start Ryu here (or game four), but if Haren pitches in St. Louis – he was 6-7 with a 4.75 ERA on the road this year – this is a MUST win game.
If Ryu is healthy, he or Haren will pitch this game. If Haren pitches game three, this one is completely up in the air – Kershaw could start on short rest if the Cards are up 2-1. That’s unlikely seeing he’s only pitched on three days’ rest once in his career and that was to start the NLCS last year vs the Cards. It’s more likely the Dodgers would throw Roberto Hernandez. The last update I’ve seen on Ryu is that he threw a pain-free 40 pitch bullpen on September 28th. His last outing was September 12th and he got shelled for four runs in one inning. If he pitches, it’s unlikely he’ll be as sharp as he was before his injury. He had built on his solid rookie season and lowered his FIP to a very respectable 2.62 by increasing his strikeout rate and reducing his walk rate even though his ERA moved in the opposite direction. The Cardinals have been vulnerable to left handed pitching in the past, but rebounded this year to post a higher OPS against them than right handers current Cardinals are also hitting .294/.314/.441 against him, but only have 34 ABs.
A Roberto Hernandez sighting would be welcome for the Cards, even if Ryu isn’t sharp. Over the past three seasons only eight starters have a worse K/BB ratio than him and only John Danks and Hector Noesi have a worse FIP among qualified starters. He is not very good and was acquired by the Dodgers only because they lost healthy pitchers after the non-waiver trade deadline.
The Cards’ game four starter isn’t settled either. If Michael Wacha were healthy, he’d be a shoo-in to start game two and push everyone back, but his health makes him a candidate here. Wacha returned without a minor league rehab assignment and pitched four times after not starting since June 17th. Shoulder injuries are very dangerous for pitchers and Wacha certainly was not himself when he returned. Opposing hitters hit .294/.355/.441 against him and he faced lifeless Reds and Diamondbacks lineups in three of his four starts. In my opinion, he should not be in the playoff rotation or even on the roster. I would trust Shelby Miller with this start. I don’t completely buy into his renaissance over his seven starts since facing a boot from the rotation. Over those seven starts, he’s benefited from a .207 BABIP to limit hitters to a .190 average. This isn’t sustainable. He did somewhat reduce his walk rate below his career rate, not his strikeout rate was also down over that stretch. I would expect five innings and at least two runs against this Dodgers lineup from Shelby. At this point he’s proven to be a durable thrower, but that’s about it. He walks a lot of batters relying wholly on his fastball (71.7% of his pitches – sixth highest since start of 2013).
Edge: Dodgers. It’s very close but Kershaw pushes them over the top and a Ryu appearance would go better than a Wacha appearance.
Bullpen: The Dodgers employ two of the seven highest paid relievers in baseball in Brian Wilson ($10 million) and Brandon League ($7 million) and their bullpen is 24th in WAR. It’s not a particularly good unit. Kenley Jansen is the only member worth more than 0.4 WAR and two members – Wilson and Chris Perez – have thrown more than 40 innings and have been negative contributors. The good news is that Kershaw leads the league in innings per start at 7.34 so Don Mattingly doesn’t have to worry about the pen much when he starts.
Wilson is still able to get strikeouts as he’s K’d 10.4 batters per nine, but walks have been a big issue at 5.48 per nine. He’s also given up as many HRs as he did in 2010 and 2011 combined and he threw more innings in each of those seasons than he did this year. There’s really no positive to Wilson’s season – his WPA/LI is 12th from the bottom in only 40 innings. If Mattingly insists on using him, it should be exclusively against right handed hitters as left handed hitters have a .914 OPS against him, while right handed hitters have managed a .323 OBP against him but only a .686 OPS. Unfortunately for the Dodgers he has a player option for $10 million in 2015 that he’d be a fool not to exercise.
Brandon League was better than last year, but that doesn’t say much. He joins Wade Davis and Kevlin Herrera as the only qualified relievers to not give up an HR this season. Davis and Herrera are two of the best relievers in the league. League benefited tremendously from good luck. He had the eighth lowest strikeout rate of that bunch compared to Davis and Herrera who finished 3rd and 25th, respectively. League “held” opposing hitters to a .358 OBP and still somehow managed a 2.57 ERA. That is astounding as that OBP would be in the top 30 of qualified hitters. He stinks and Cardinals fans should hope Mattingly goes to him with confidence.
Thirty nine year old Jamey Wright is another oft used reliever who isn’t very good (hint there’s a theme). Like League, he “limited” opponents to a .341 OBP but managed to avoid home runs to keep his ERA down. As mentioned above, he’s 39 and this showed as he wore down this season and had a 5.74 ERA in the second half including 9.00, 5.14, and 7.88 ERAs in July, August, and September. Additionally, here are his splits by leverage index:
|
OBP/OPS |
| High |
.400/.765 |
| Medium |
.357/.670 |
| Low |
.310/.652 |
Synopsis: He breaks under pressure and becomes even worse than he is normally.
JP Howell is better than Wright and League. The three of them all ranked within the bottom 30 of qualified relievers in K/BB ratio, but Howell is left-handed and is able to get both hitters out. His numbers are somewhat skewed by a poor September in which he had an 11.81 ERA and if he bounces back to form (no other month above 2.35). I’d like for him to be used in high-leverage situations between the starters and Jansen. He’s been one of the Dodgers best relievers over the past two years and as long as a rough September is behind him, he’ll be fine.
Pedro Baez is a rookie of note who may be on the roster in place of overpaid, terrible right handed pitcher, Chris Young. Baez is right handed and a former position player who converted to pitching in 2013. He’s not great but he’s better than Young and possibly better than League and Wright if Mattingly gives him a chance. For a young guy, he doesn’t have great strikeout stuff, but he also does a good job of limiting walks. In a small, 24 inning sample, he was susceptible to three HRs. I wouldn’t expect him to be used in many high leverage situations but could get some work in a three run ball game.
Jansen is as lights out as they get in the ninth. Mattingly has used him once before the ninth inning this year and never when the Dodgers are down a run and all appearances when the game were tied are at home. Mattingly only deploys this weapon in save situations. He’s nasty and has struck out at least 99 batters in three consecutive seasons
The Cardinals have three lefties in Kevin Siegrist, Randy Choate, and Sam Freeman. Siegrist has been the most disappointing of the three as his ERA is 6.90. He’s allowed 23 runs after only allowing two last season and can’t even get left handed hitters out. I’d be surprised if he’s on the playoff roster. Choate has one ugly, six run outing skewing his season totals. Remove that appearance and his ERA falls from 4.63 to 3.15 and his WHIP goes to 0.96 from 1.14. He has held lefties to a .097/.212/.153 line. In essence, he’s been Randy Choate. Under no circumstances should he face a right-handed batter as they’ve clubbed him to a .385/.458/.481 clip. Additionally, Andre Ethier, Adrian Gonzalez and Carl Crawford, the three major left-handed threats in the Dodgers’ lineup have combined to go 3-27 with three walks (all Crawford) and 6 strikeouts in their careers. Sam Freeman has a nice shiny 2.43 ERA but his FIP is more than a full run higher at 3.80 and he hasn’t been effective a strange, significant reverse platoon split in his career. Right handed hitters have only managed a .523 OPS against him while left handed hitters are knocking him around at a .749 OPS. I would not expect him on the roster.
The right side of the Cards pen is very interesting and a significant advantage in this series. The Cards will deploy Seth Maness, Carlos Martinez, Pat Neshek and Trevor Rosenthal in that order. Jason Motte, who closed out the 2011 World Series, shouldn’t be on the roster as he’s been generally ineffective due to diminished velocity in his first year back from TJS. He’ll be a free agent after this season and I’d imagine the Cards would have interest in bringing him back with an incentive laden contract since he’s one of the most well liked guy in the clubhouse and a very good member of the community. I’d be surprised if he got much more than an NRI from someone else. Justin Masterson should also be left off the roster as he was never able to solve whatever mechanical funk is hindering his ability. He hasn’t pitched since September 9th and the trade will go down as one of Mozeliak’s worst as Masterson posted a 7.53 ERA in 28.2 IP.
We’ll start with Maness who is fourth in MLB in reliever innings. Maness now has 141.1 career innings with a 2.48 ERA, 1.15 WHIP and 3.31 FIP. He doesn’t strike many out but he hardly walks anyone. Maness and Neshek have the fourth and fifth lowest BB rates among qualified RPs. Maness succeeds by pounding the zone with his sinker (60%) and getting groundballs at a 56% clip. He’s allowed runs in four of his 39 appearances since July 1st but in three of those four outings he’s allowed three or more runs. Look for Maness to bridge the gap between the starter and the late inning relief arms or pitch between Choate and Neshek. He’s versatile and Matheny has a lot of confidence in him. I certainly have more faith in him than I did last year when Matheny went to him in Game 5.
Pat Neshek is one of the best stories in the game. He came to Spring Training as a non-roster invite and made the All Star team in his home town. He’s also an avid baseball card and memorabilia collector and traded his jersey number to John Lackey for a Babe Ruth signed baseball. Without a doubt it’s been the best year of his career and he’ll receive a nice payday this offseason. He’s equally effective vs lefties and righties and is able to go two innings if needed. Matheny would prefer to use Neshek in the eighth inning but if Rosenthal continues to struggle, he could get some saves.
After watching Trevor Rosenthal breeze through 20.1 innings in the 2013 postseason while striking out 33, walking five, and allowing six hits, it was easy to expect him to challenge for the league lead in saves in 2014. As is often the case, the results don’t match the process as 2014 has been extremely shaky for Rosenthal. The issue has been walks. His walk rate more than doubled in 2014 as he issued 42 free passes. Everything else was about the same but the walk rate pushed his FIP more than a full run higher to 2.98. For whatever reason he’s struggled getting the first guy he faces out as those batters in his 71 games are hitting .328/.408/.443 against him. This is a new problem for him as last year he shut down the first batter, holding them to an .185/.284/.262 line. After a particularly bad August where opponents had a .754 OPS and he walked nearly as many as he struck out, he has begun to throw a breaking ball more than any other point in his career. Rosenthal is not the same weapon he was last October but he is still generally effective.
I would strongly consider putting Marco Gonzales on the post-season roster. The Cardinals obviously like his makeup as they called him up barely after a year of signing him. He has a devastating changeup and has held left-handed hitters to a .579 OPS across A+, AA, AAA and MLB this year vs a .694 for right-handed hitters. In a smaller, 34.2 IP sample at the MLB level, the split widens to .397 and .827. Two other statistics strongly point towards Gonzales’ inclusion. He has been much better as a reliever than a starter. In 25.2 IP as a starter, he walked 17 and gave up 28 hits. As a reliever, he’s walked four and given up four hits in nine innings. Additionally, he’s particularly effective against hitters the first time he faces them within a game.
|
PA |
BA |
OBP |
SLG |
| First |
80 |
.175 |
.288 |
.329 |
| Following |
76 |
.237 |
.395 |
.460 |
Outside of a AAA game against Joc Pederson and Alex Guerrero, he’s never faced anyone on the Dodgers. While he’s never been in a postseason environment, he has experience suggesting he’ll be calm and collected. As a rising junior, Gonzales participated on the USA Collegiate National Team. There he was the MVP of the MVP of the Honkbal Week in Netherlands based on his two starts, including eight innings of one run ball against the Netherlands in the Netherlands to lead Team USA to a bronze medal. Between that start and opening the tournament for the US against Japan, he pitched 16 innings with 19 strikeouts, two walks, and only allowed two runs. This was a big performance in a big tournament.
Second, he pitched in two high leverage situations in the final series against Arizona and excelled. He entered the first game of the series to a tie game in the bottom of the ninth – the Cards needing a win to maintain a one game lead on the Pirates – and held the D-Backs scoreless and eventually got the win. He again entered on Sunday with runners on first and second and one out with a one run lead and held the D-Backs scoreless for the remainder of the game. Gonzales is a risk but I would be very upset to see Motte, Lyons, Greenwood, or even Siegrist on the roster ahead of him. He would help the Cards get out of a situation.
Edge: Cardinals, big time.
Manager: Some fine baseball minds have likened Matheny’s lineup decisions to throwing darts. I would not disagree but it has worked for whatever reason. This may have been Matheny’s best season as a manager as he had to tinker with personnel, adapt to unpopular trades, and generally deal with the media and fan’s disappointment with the team’s hitting. This is a young team and should be the same group of players for the next two-three seasons.
|
2012 |
2013 |
2014 |
| Record |
88-74 |
97-65 |
90-72 |
| Lineups Used |
122 |
89 |
119 |
| Batter’s Age |
31.1 |
28.7 |
28.6 |
| Sacrifice Attempts |
104 |
94 |
97 |
| Pitcher’s Age |
29.1 |
26.9 |
27.2 |
In his fourth season as a manager, Don Mattingly has improved the team’s win-loss record in each year of his tenure.
|
2011 |
2012 |
2013 |
2014 |
| Record |
82-79 |
86-76 |
92-70 |
94-68 |
After sacrificing more than all but the Reds in 2013 and Brewers in 2012, Mattingly reeled it in and finished in the middle of the pack. He used slightly more lineups than the Cards this year with 124 different ones, but by the end of the season had a pretty good idea of what he wanted to do – decidedly different than Matheny.
In terms of challenges, Matheny was 13/32 (40%) compared to Mattingly’s 55% (21/38): Mattingly challenged more often and with more success. I think they’re about equal here. Mattingly prefers to sit in the shadows and let his players do the talking while Matheny has really become the face of his franchise. Both managers were fortunate enough to come into good situations and while Mattingly has the additional challenges of Puig and LA, Matheny has weathered a tough year of criticism both nationally and more importantly, locally. I’m confident neither will do too much to hurt their teams in a negative way.
Edge: Even.
Overall Thoughts: I believe the series boils down to the Cards having a much, much better bullpen and much, much better defense. The Dodgers are unquestionably better hitting team as they’ve put up a .264/.332/.404 line good for the second highest OPS in the NL against the Cards’ weak .253/.321/.371 line. While the Cards have actually allowed fewer runs than the Dodgers, the Dodgers hold the ERA edge due to 63 unearned runs compared to 39 for the Cards. Kershaw gives the Dodgers the rotation edge. The Cards are built to win close games and at least three of these potential five games should feature under 6.5 runs. Nearly half of the Cardinals games were decided by two or fewer runs and they were 46-34 in those games and the Dodgers were nearly just as good as they went 41-32 in such games.
Home field advantage is a big deal for the Cards as they play .630 baseball at home compared to .474 on the road. The numbers and Kershaw all point to the Dodgers winning this series. I made the mistake of picking them in the NLCS last year and won’t do the same this year. The pick is Cards in four. They’ll drop the first game in LA against Kershaw, but will rebound to win the next three and take the series.


