Archive for April, 2014

Would Charlie Root Really have Beaned Babe Ruth?

I’m speaking about one instance in general, the famous or infamous alleged “called shot” by Babe Ruth at Game 3 of the 1932 World Series.

Stimulated by ESPN Chicago NOT calling that the No. 1 moment in Wrigley Field’s 100-year history (more on that later), I got curious.

The “called shot” game from the 1932 World Series has the mythos of whether or not Ruth did point at center field while at bat in the fifth inning, after making some sort of gesture before that, it seems, at Cubs pitcher Charlie Root (sic, per Baseball-Reference, Wikipedia and elsewhere; FanGraphs’ “Charley” is much less attested) after he got 2 strikes on him.

To me, this is the No. 1 event not just because of gray-area questions about what Ruth did and did not do, but also from Root’s vociferous denial that Ruth was calling anything, claiming he would have beaned him if he was.

Really? Let’s first look at quotes from the Wikipedia link above on the “called shot.”

  • “Don’t let anybody tell you differently. Babe definitely pointed.” — Cubs public address announcer Pat Pieper (As public address announcer Pieper sat next to the wall separating the field from the stands, between home plate and third base. In 1966 he spoke with the Chicago Tribune “In the Wake of the News” sports columnist David Condon: “Pat remembers sitting on the third base side and hearing [Cubs’ pitcher] Guy Bush chide Ruth, who had taken two strikes. According to Pat, Ruth told Bush: ‘That’s strike two, all right. But watch this.’ ‘Then Ruth pointed to center field, and hit his homer,’ Pat continues. ‘You bet your life Babe Ruth called it.'”)
  • “My dad took me to see the World Series, and we were sitting behind third base, not too far back…. Ruth did point to the center-field scoreboard. And he did hit the ball out of the park after he pointed with his bat. So it really happened.” Associate Justice John Paul Stevens, United States Supreme Court
  • “What do you think of the nerve of that big monkey. Imagine the guy calling his shot and getting away with it.” – Lou Gehrig
  • The Commissioner of Baseball, Kenesaw Mountain Landis, attended the game with his young nephew, and both had a clear view of the action at home plate. Landis himself never commented on whether he believed Ruth called the shot, but his nephew believes that Ruth did not call it
  • Washington Post legendary columnist Shirley Povich, detailed in an interview with Hall of Fame catcher Bill Dickey. “Ruth was just mad about that quick pitch, Dickey explained. He was pointing at Root, not at the centerfield stands. He called him a couple of names and said, “Don’t do that to me anymore, you blankety-blank.”

So, hard to say, but it adds to the mystique, right? And, of the collected quotes, three say he called the shot, and the others are kind of ambivalent.

So, can we explore further?

Relatively recently discovered footage leans more toward the idea of Ruth pointing his bat at the Cubs dugout, Wikipedia claims. That said, even that and him reportedly holding two fingers up to Root, or pointing at him, would have been something halfway like saying “here it comes.” In other words, short of Ruth pointing to the centerfield scoreboard, Root arguably had reason to bean him anyway. Beyond the above, Ruth had already homered off him earlier in the game.

And speaking of …

Let’s look at Baseball-Reference’s play index for that game, to further question Root’s claim.

First, the game was tied 4-4 entering the top of the fifth. Root wouldn’t want to jeopardize that lead. And, beaning Ruth with 1 out would have brought up Lou Gehrig who, like Ruth, had already hit one homer in the game and by this point was a more dangerous batter than Ruth.

So, especially with two strikes on Ruth, from quick-pitching or whatever, no Root wouldn’t have beaned him. He would have tried to strike him out. Beaning him with a two-strike count to know he would face Gehrig next in a tie game would have been stupid. Root needed the out. The Cubs needed the win. A strikeout of Ruth would have given the bench-jockeying Cubs dugout more ammunition, too.

In actuality, Root didn’t and couldn’t strike out Ruth. Gehrig then hit another homer too, at which point Root got yanked.

So, Root may be right, but I kind of doubted it. He had reasons for his statement, of course. Root’s not a HOFer, but he is arguably a member of the Hall of Very Good, winning more than 200 games and posting nearly 40 career WAR. And he’d like to be remembered for that rather than for getting shown up, getting “faced,” by Babe Ruth. Who wouldn’t?

Beyond that, as I talk about in more detail at my blog, about the history of Wrigley, besides the “called shot” dethroning the Bartman game from the top spot, I’m not even sure I’d rank that game at No. 2 on Wrigley’s Top 100. That’s in large part because I’m not a Cubs fan, I know.


It’s Time to Lower the Mound…Again

We have seen an incredibly high number of Tommy John (TJ)[1] surgeries undergone already this season. The surgery is on pace to surpass any single-season total in history. This signifies that an unusually high number of pitchers have already gone under the knife and it is still just the first month of the season. Even with so many talented pitchers being sidelined for a season because of TJ, we have also seen league-wide offense falloff quite a bit. There are many reasons for each of these trends, and also many potential solutions, but I feel that the best solution to each problem is to lower the pitcher’s mound. I do not believe pitchers should pitch from a flat surface, which is even with the batter’s level. However, I do believe the mound should be lowered to just 6 inches above the plate. It may seem extreme or irrational, but it has been done before and it would help both issues that professional baseball is facing. One obstacle to finding a way to slow or prevent TJ is the procedure’s high success rate. It is also a difficult problem to solve because it is unclear what causes the injury and when exactly the injury begins. Nevertheless, these should not prevent the MLB from attempting to limit the growing number of pitchers requiring TJ surgery, especially when it can also increase the league’s offensive production.

24 pitchers have needed TJ surgery already in 2014, which has yet to complete its first month of regular season games. For reference, 28 pitchers received the procedure in all of 2013, and only 7 had undergone the surgery at this point last year. It is not surprising to see an increase upon last year’s total, as 2013 was actually a decrease upon 2012’s total of 55 TJ’s for pitchers. However, even in 2012, there were only 15 TJ surgeries by this point in the season. The procedure has been widespread in baseball for some time now, and it has saved many careers, which has made finding a solution unnecessary. Even with the surgery’s outstanding success rate, the time has come for the MLB to step in to protect its players.

Among the many factors that have influenced the increase in TJ surgeries of late is the procedure’s success rate. One study, completed in 2013, found that 83% of pitchers to undergo TJ return to the Majors and 97% return to pitch, at least in the Minor Leagues.[2] This success rate would not necessarily impact players that have a completely torn Ulnar Collateral Ligament (UCL), as they would have no other options to return to the mound, but it may influence pitchers with a partial tear of the UCL. In the past, many of these pitchers would turn to rehab instead of undergoing TJ. Adam Wainwright is a great example of this, as he rehabbed from a partial tear of his UCL, before undergoing TJ surgery 6 years later when he completely tore his ligament. However, because of the success of the procedure, there is little motive to attempt a rehab that may not work, and only delay the surgery, which pushes back the return date. As the Cardinals former team physician and orthopedic surgeon, George Paletta, said, “It’s become an accepted side effect of the job”.[3]

Another reason that is often cited is pitchers are initially beginning to injure their arms in youth baseball. High School pitchers are often pitching in showcases or in front of scouts, which puts extra pressure on them to throw as hard as they can and often pitch even when their arm in not entirely recovered from their previous outing. This was not the case as recently as 15 years ago, as High School showcases did not become common until the early 2000’s. This is one of the early waves of young pitchers that are reaching the Majors after going through the showcase process. From now on, the most, if not all, of the pitchers that reach the Majors will have been through this rigorous process.

Another issue facing young pitchers is that many of them are pitching in competitive games nearly year-round. Overuse is one of the many reasons pitchers experience arm injuries and pitching throughout the year has greatly increased the amount of use on pitcher’s arms. Once, many high school baseball players played multiple sports and were able to take time off from throwing; however, many pitchers now throw year-round without many breaks from throwing. Youth pitchers are also putting more stress than before on their arms because they are throwing harder than ever. This may seem to be a good thing, and it is for performance, but it puts extra stress on their ligament that is not fully developed. Dr. James Andrews says that High School pitchers throwing between 80-85 mph are in particular risk of arm injuries because they are putting too much stress on a ligament that has not developed enough. As Lindsay Berra explains, a pitcher does not rupture his UCL on one pitch:

Strasburg was probably in trouble from the get-go. He didn’t rupture his UCL on one pitch with the Nationals — even if a pitcher feels a pop on a particular pitch, his UCL was anything but pristine before the incident. Like a rope, Strasburg’s UCL probably started to fray the moment he began pitching off a mound, the extra height of which can compound the stress of each pitch. It likely got worse not only because of his mechanics. Kids who throw the hardest pitch the most: they get hitters out.[4]

While it is clear that TJ procedures are increasing, the exact cause of TJ is not clear, as many factors impact whether people require TJ. However, it is evident that pitching off a mound increases the stress put on the pitcher’s arm. Comparing just the number of TJ procedures for pitchers and for position players, it is clear there is a substantial difference. Since the first TJ surgery in 1974, 622 pitchers have undergone the procedure, while only 41 position players have received the surgery. There are more differences than merely the mound, but none of them account for such a large discrepancy between the two types of players.

Another common comparison for anecdotal evidence is pitchers compared to quarterbacks in football. According to a study in 2010, there had been 10 reported instances of NFL quarterbacks with damage to their UCLs, yet only one of these players underwent surgery. The other nine quarterbacks chose to use therapy to repair their injury and their mean number of days until their return was 26.4 days.[5] As with the differences between pitchers and position players, there are numerous differences between quarterbacks and pitchers. However, these differences do not account for such a significant gap between both UCL injuries and TJ surgeries.

Both of these examples contain too many confounding variables to draw any significant conclusions. However, a study completed in 2008 examined the effects that the 10-inch mound has on a pitcher’s mechanics and the stress that it puts on the pitcher’s arm in comparison to a mound at 8 inches, 6 inches and flat ground. The study, led by William Raasch, selected 20 from MLB organizations and Milwaukee-area NCAA Division-1 pitchers. The study found that pitchers throwing from a 10-inch mound compared to pitchers throwing from flat ground experienced extra stress on both their pitching shoulder and elbow.[6] They found that the greatest difference was at foot strike, as the mound changes the timing of the foot strike compared to the position of the pitcher’s arm. This study found that pitchers definitely experience more stress on their arm when throwing from an elevated surface than from a flat surface.

While the majority of this post has been dedicated to the effects the mound has on a pitcher’s health, lowering the mound will also improve the offensive production in the MLB. Of course, when the mound was first lowered to 10 inches in 1969, it was done in order to improve offense. After “The Year of the Pitcher” in 1968, the MLB saw the average runs scored per game increase by .65 in just one season. It is clear that lowering the mound had a significant impact on the league’s offensive output. Once again, we are in need of the mound to be lowered in order to improve the league’s offense. With better pitchers, defensive shifts and, most significantly, more stringent testing for Performance Enhancing Drugs (PEDs), we have seen a sharp drop off in offensive performance.  In 2013, the MLB R/G (4.17) was the lowest it has been since 1992 (4.12). This is not just a single-season aberration, as it has been experiencing a steady decline since 2006, when it was at 4.86. HR/G are also down quite significantly since 2006, when it was 1.11, and were just .96 in 2013. Easily the largest difference between 2006 and 2013 is the increase in strikeouts per game, as they have skyrocketed from 6.52 to 7.55 in 2013. By lowering the mounds, the MLB will be able to improve upon these numbers and return offense back into baseball.

Lowering the mound may seem to be a radical step to solve two things that some people may not seem like problems; however, it is the best of the few options the MLB has. While some will argue that this will not limit TJ procedures because many pitchers are already damaged goods by the time they reach the Majors, this is a change that will soon reach the NCAA, High School and youth baseball leagues if the MLB does it. This will have a profound impact on the number of TJ procedures once these pitchers reach the Majors, as they will have reduced the stress on their arm over a long period of time. The impact will not be immediate in the MLB, but when the next wave of young, talented pitchers reaches the Majors, there will be fewer TJ procedures.

The immediate impact will come from the increase in offensive production, as the lower mound will take away some of the advantage from the pitchers. As I have mentioned above, there are not many appealing alternatives. The most common solutions to the low offensive numbers is to juice the baseballs, similar to what Japan did this past season. While this would certainly improve offensive production and be less costly than changing the mounds, it would not help decrease the number of TJ procedures. A bit more radical of an alternative, that I do not believe could ever happen, is the MLB allowing the use of PEDs. While this would likely increase offense, it would almost force players to take PEDs or else they would be at a disadvantage to the rest of the players that do take PEDs. It is not fair to put athletes in this position, especially when we know how detrimental steroids can be to a person’s health.

Another option is to add a DH to the National League, which has been discussed and is quite possible. However, this also fails to help pitchers avoid TJ. Also, in 2013, the NL averaged just 4.00 R/G compared to the AL’s average of 4.33 R/G. Assuming the NL’s production would match the AL’s, the addition of the DH would add just 802 runs to an MLB season. When the MLB first lowered the mound in 1969, the league scored 2,527 more runs than the previous season and that was with only 24 total teams. By lowering the mounds again, the increase in offensive production would substantially increase beyond where it would with the addition of a DH in the NL. Among these options, I believe the best is to lower the mound to 6 inches above home plate.

The number of TJ surgeries continues to rise and it is time to make an attempt to limit this procedure. The best way to do this is to lower the height of the mounds in the MLB, as this will decrease the stress that pitchers suffer when they pitch. Once the MLB does this, all other levels of baseball will follow suit, just as they did in 1969. The purpose this time; however, will be two-fold, as the lower mound will also serve to take away some of the pitcher’s advantage, and therefore, improve the MLB’s offensive numbers. Knowing what we know about the mound’s impact on a pitcher’s mechanics and the extra stress that it exerts on the pitcher’s arm, we cannot idly watch as more and more pitchers suffer through a year of rehab from a surgery that can be limited.


[1] http://www.baseballheatmaps.com/disabled-list-data/

[2] http://www.newsday.com/sports/baseball/study-shows-pitchers-who-get-tommy-john-surgery-almost-all-pitch-again-1.7621000

[3] http://espn.go.com/mlb/story/_/id/7712916/tommy-john-surgery-keeps-pitchers-game-address-underlying-biomechanical-flaw-espn-magazine

[4] http://espn.go.com/mlb/story/_/id/7712916/tommy-john-surgery-keeps-pitchers-game-address-underlying-biomechanical-flaw-espn-magazine

[5] http://www.ncbi.nlm.nih.gov/pubmed/20609599

[6] http://www.sciencedaily.com/releases/2008/03/080323210203.htm


The Fielding Edge: Why Pujols is No Cabrera

When Miguel Cabrera signed his big new contract with Detroit earlier this year, the response of this blogger and many other fans was — No! Specifically, the seeming albatross of Albert Pujols’ contract, and somewhat lesser ones of Prince Fielder and Ryan Howard, were cited as warning signs.

However, Pujols’ injury-hastened offseason, with extra rest, seems to have put a bit of a new spring in his step through taking the fasciitis out. His quick start en route to passing the 500-homer mark would seem to be good evidence of that. Even if a start this hot doesn’t hold, if he finishes the year at somewhere between his 2011 and 2012 levels, it’s a major turnaround and one the Angels will gladly take.

Fielding has been known to set Pujols at least somewhat apart from the other three. But, how much? More than one might expect. Indeed, Pujols overall might come off better than one might expect.

Here’s a check of all four, on total zone runs and ultimate zone rating per 150 defensive games.

Pujols: 96/6.2

Cabrera: -7/-2.0

Fielder: -38/-5.5

Howard: 14/-3.4 (really)

All numbers are for first base only for each player. Howard’s numbers make me raise my eyebrows a bit. They also make me think that we still haven’t “nailed down” defensive sabermetric calculations as tightly as offensive ones. Not just this, but differences between FanGraphs and Baseball-Reference make me say that.

But, before I go down that road, I’ll present one other first baseman’s figures. He’s a bit older, so we don’t have UZR or UZR/150 numbers for him, just total zone runs. You’ve “probably” heard his name among defensive first basemen a few times. I present Keith Hernandez.

Hernandez: 121

And so, Albert Pujols’ fielding neighborhood looks a lot better than one might think.

So, let’s go to Baseball-Reference next. Here, I’ll have all games, not just at 1B, included, for two stats over there: fielding runs and dWAR.

Again, the differences are notable.

Pujols: 134/1.9

Cabrera: -77/-12.0

Fielder: -93/-17.8

Howard: -46/-12.4.

A couple of notes. With B-R, Howard falls a lot closer to Cabrera and Fielder. On both, the idea mentioned by some bloggers and sportswriters, that teams and managers would have to some day worry about Fielder losing his range, is shown to be wrong. He never had it to lose, claims about his prowess at first aside.

Let’s also see what B-R tells us about the Merry Mex.

Hernandez: 117/0.6

Whoa; Pujols actually ranks better than him. Really?

Yes. Another statistic has further proof.

Hernandez was famed for his ability to start 3-6-3 double plays. B-R says he initiated 127 ground ball DPs of all types.

Guess what? Pujols is close behind with 121. After he recently turned his first one this season, I decided, just out of curiosity, to check these numbers.

The others? Not even close. Howard has about 80 fewer and Fielder about 75 fewer. Cabrera, with much less time at 1B, is more than 80 such double plays behind Hernandez.

This is about more than illustrating Pujols’ individual value as a fielder. It’s about team issues.

Cabrera could well be moved to DHing more than 1B already next year, if the Tigers don’t resign Victor Martinez. Fielder, instead of Mitch Moreland, should already be the Rangers’ primary DH. Howard is in the National League, and with a GM who still believes he has a serious shot at the postseason, which is preventing him from being traded into the  AL.

But, Pujols, still playing league average or a touch above at 1B, and likely to do so for a few more years, gives the Angels and Mike Scioscia more flexibility on making out lineup cards. For more details about all this, visit my blog post, please.


The Unlikeliest Way to Score from First Base

You, being an internet-reading baseball fan who even occasionally ventures into FanGraphs’s Community Research articles, have almost certainly heard of Enos Slaughter, and not just because of his multiple appearances in crosswords. You also may know that he is probably best-known for his Mad Dash, in which he raced home from first base in a World Series game on what was charitably ruled a double, but what many observers believe should have been ruled a single[citation needed]. Scoring from first on a single — I bet that’s pretty rare, right? After all, one such case of it got its own Wikipedia page!

Well, according to Retrosheet, a runner scored from first on a single 16 times last year (not counting plays on which an error was charged). It’s already happened at least once this year. So if we’re talking about unlikely ways to score from first base, this doesn’t really qualify as “rare.”

You know what is rare? This is rare.

Read the rest of this entry »


All Hail the New Bunt King?

On April 24, Danny Espinosa had a remarkable game. He bunted for a hit and had a solo home run to the left-field corner. The bunt was the remarkable part.

Danny Espinosa has seven (7) bunt hits so far in 2014. That’s more bunt hits than 28 MLB teams, in a tie for first place with the Marlins and Danny’s D.C. teammates. In fact, Espinosa’s bunts account for 35% of his total hits (7/20), and he’s only failed once.

This is so unprecedented that a better word would be “outrageous”. In 2013, Leonys Martin led the MLB in bunt hits with just 12. And Martin only succeeded 40% of the time that he tried getting on base with the bunt. I had to go back to 2011 to find a guy who pulled off the base-on-bunts 20+ times in a season: Juan Pierre attempted 62 and succeeded with 23.

Only one qualified hitter in recent (batted-ball data) history has done anything even slightly similar to what Espinosa is doing so far. Fully 20% of Willy Taveras‘ career hits were bunts; he succeeded nearly half (46%) of the time, racking up a total of 130 bunt hits, including 38 in the year 2007, which is the single-season record, even though he only played in 97 games (!!). Only Juan Pierre has more bunt hits in the batted-ball-data era, but he’s much less successful on a percentage basis.

There are many reasons to think Espinosa won’t follow in their footsteps. For one thing, he’s a very different hitter: not a powerless center fielder who relies solely on speed, but a homer-happy middle infielder with a dangerous strikeout tendency.

In fact, therein might lie an explanation. Last year, Danny Espinosa hit rock-bottom, plagued both by injuries and the stupid belief that he could play through his injuries. His collapse was uglier than Ron Burgundy’s, and he put up a .280 OBP in the minors. Now he’s on the comeback trail. The power is back. The strikeouts are back. The batted-ball profile in general is back to pre-2013 numbers.

With one big exception: the bunts.

I believe this is deliberate. Espinosa is trying to get on base, he’s trying to cure a predilection for infield pop-ups, he’s trying to re-establish himself against major-league pitching, and he’s trying to re-establish himself in a lineup where he’s currently filling in for an injury. He likes unorthodox approaches to reaching base, leading the NL in hit-by-pitches in 2011.

Given Jeff Sullivan’s recent series of posts about bunts, bunting is a tougher skill than we’d think. Danny Espinosa was always good at bunts. (Maybe we can convince Jeff to make GIFs of all seven bunt hits so far.) In 2011 and 2012 his bunt hit attempts succeeded about 43% of the time, nearly as good as Willy Taveras. He chipped in a few sacrifices, though not too many. He might commit to this stratagem until teams start expecting the bunt every time he steps in.

If Danny Espinosa wants to set records, the records are there for him to take. If he succeeds on even half his attempts, that’s a season record. If he succeeds 32 more times, that’s a season record. You’d be crazy to believe he will break those records. But you’d have been crazy to believe, a month ago, that he would have even had a chance.


Danny Salazar, Not According to Plan

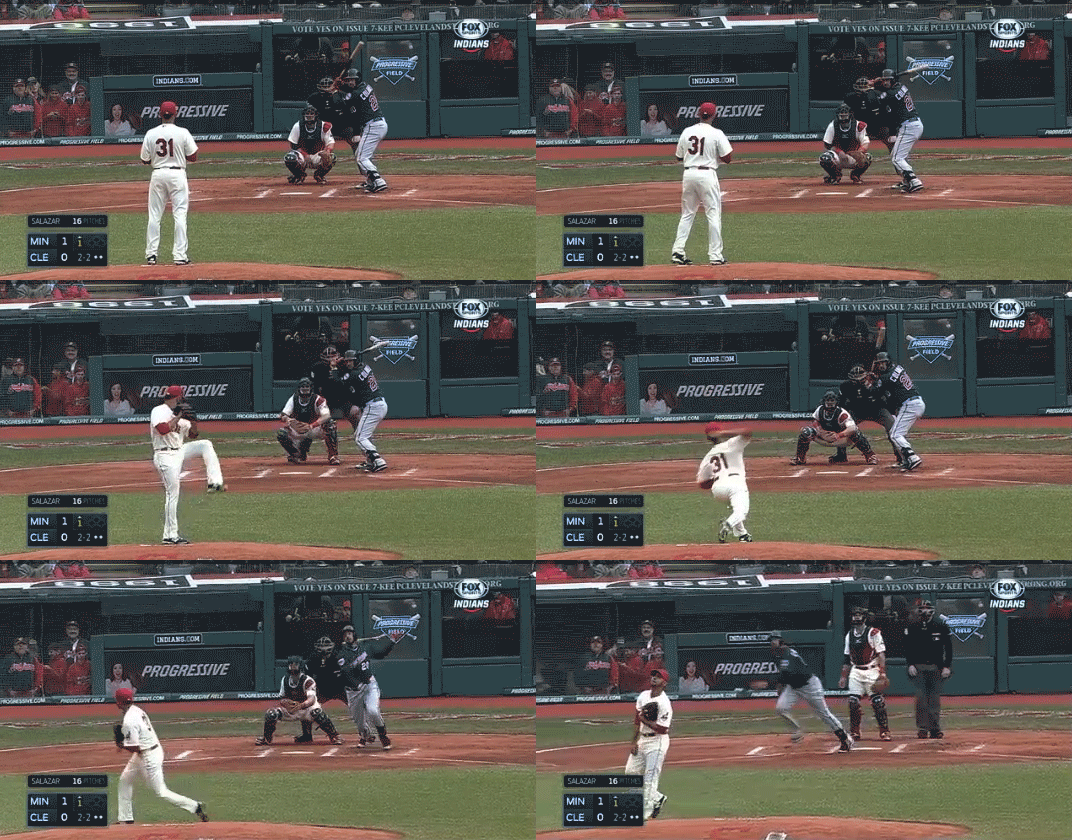
Last season, Danny Salazar was among a wave of hard-throwing young pitchers that made electrifying debuts down the stretch, falling upon the national eye during the postseason.

Salazar threw 52 regular season innings over 10 starts in 2013, posting a 3.12 ERA and 3.16 FIP while striking out more than 11 batters per nine innings. His 30.8 K% was second of all starting pitchers who threw at least 50 innings, putting him behind only Yu Darvish and right ahead of Max Scherzer. His 2.75 xFIP was third in that same pool of pitchers, trailing only Matt Harvey and Felix Hernandez. His 14.6% swinging-strike percentage was tops in baseball, beating Francisco Liriano’s second-place rate by more than a full percentage point.

For 1/3 of the 2013 MLB season, 23-year-old Danny Salazar was among the most dominant starting pitchers in baseball. But with that kind of performance comes high expectations, and thus far, unlike young peers Sonny Gray, Michael Wacha and Alex Wood, Salazar is not living up to expectations.

Through his first four starts, Salazar sports a 7.85 ERA and a 5.70 FIP. Strikeouts are down, walks are up, and he has allowed five home runs in 18 innings.

Despite how good Salazar was in 2013, those who follow him and/or the Indians will likely remember his season by two big swings from two big men in two big games.

To wit:

Miggy

Miguel Cabrera hit that on the first pitch with two outs in the eighth inning of a late season game between two divisional rivals battling for first place. It gave the Tigers a one-run lead, they went on to win and it was a key momentum shift in the American League Central race. Salazar had been dynamite that evening, striking out 10 Tigers and fanning Cabrera in his first three trips to the plate, until the best hitter in the MLB ultimately came out on top. It was a “welcome to the big leagues” moment right out of a screenplay.

Delmon

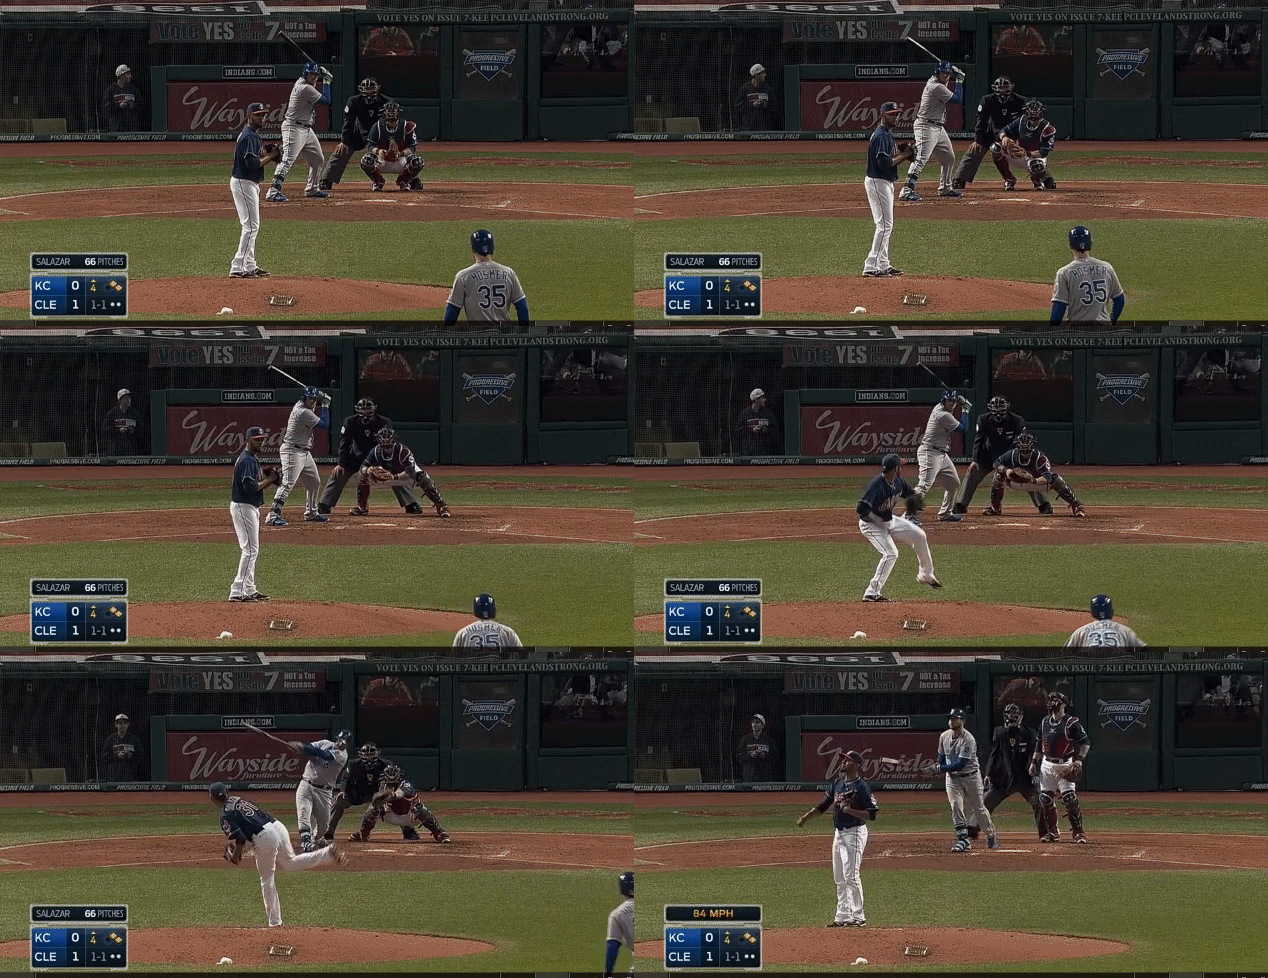
Here, Delmon Young got a first pitch fastball in the third inning of an AL Wild Card play-in game and hit a no-doubter as no-doubty as any no-doubter could be. The Rays went on to win and Cleveland’s first playoff appearance in six years was gone as quickly as it came.

These two blemishes on an otherwise stellar 2013 campaign foreshadowed what Danny Salazar would struggle with early in the 2014 season.

Both these pitches were left up in the zone and Salazar paid for them. Elevated pitches are nothing out of the ordinary for Salazar. He works up in the zone often, as pitchers who can throw 100 miles per hour tend to and should do.

salazarzone

It contributed to some of his success last year, but it’s also contributing to his failures this year. There were two red flags in Salazar’s 2013 numbers that were concerning to begin with and are now trending in the wrong direction. The first was his inability to generate ground balls. Salazar’s ground ball rate of 34.4% would have ranked in the bottom 10 of qualified starting pitchers last season. To make matters worse, 13.7% of Salazar’s fly balls left the yard, also a bottom-10 figure. It’s tough for any pitcher to sustain success without generating ground balls or while giving up a lot of home runs. Combine the two and you’ve got a problem on your hands.

Danny Salazar knows he needs to get more ground balls. In spring training he was working on “being a little more consistent with keeping the ball down.”

That’s not exactly happening. Salazar’s ground ball rate has plummeted to 25.9%. His HR/FB is up to 18.5%. Let’s take a look at the home runs that Salazar has conceded through his first four starts of 2014.

No. 1 – Chris Colabello

hr1

86 mph slider, elevated and left over the heart of the plate.

No. 2 – Alexei Ramirez

hr2

85 mph split finger changeup that was thrown right down the middle of the plate and stayed up for too long.

No. 3 – Jose Abreu

hr3

88 mph slider, left way up in the zone and over the heart of the plate. Can’t hang a slider much worse than that and Salazar knew it immediately.

No. 4 – Ian Kinsler

hr4

This one was a fastball. Flat and elevated. It was a 3-1 count and Kinsler knew the fastball was coming. 18 times in Danny Salazar’s young career has he found himself in a 3-1 count. All 18 times he has come back with a fastball. Kinsler knew Salazar couldn’t trust his offspeed stuff, sat on the fastball and put it in the left field seats to give the Tigers a 4-3 lead.

No. 5 – Mike Moustakas

hr5

84 mph slider elevated and left over the middle to an opposite-handed hitter. Might be even worse than the pitch to Abreu.

The slider clearly is an issue. Every time a batter has got a hit off Danny Salazar’s slider this season, that hit has been a home run. Consider this simple scatter chart of Salazar’s sliders in 2014:
slider
What you’ve got down at the bottom there is six sliders in the dirt, five of which went for balls. Of the remaining 20 sliders that weren’t in the dirt, only six were below the waist, where you want a good slider to wind up. That’s a lot of elevated, hittable sliders, as evidenced by the three in the middle there that went out of the park.

Then there’s the split change. This is Salazar’s out pitch. Its elite 22% whiff rate last year was the best in his arsenal and a result it accounted for nearly half of his strikeouts. However, it also needs to serve as his ground ball pitch, seeing his slider doesn’t generate any grounders, his fastball lives up in the zone and he doesn’t really throw a sinker or two seamer. Last season the split change had a 10.7% ground ball rate. This year, he has gotten only two ground balls with it and his rate is down to 2.99%. This could have something to do with the fact that, after watching video of his last start, Salazar believes he may be tipping the pitch. “With my changeup sometimes, I open up my glove too much,” Salazar said.

So, the split change isn’t getting any ground balls and he may be letting the batter know it’s coming. The sliders are all up in the zone and every time someone hits one it goes out of the park. Factor into the equation that his fastball velocity has dropped two miles per hour and its whiff rate has gone from 14% to 9% and its not hard to see why Salazar has struggled early on. All three of his pitches have had something wrong with them.

The Indians shouldn’t be so quick to pull the trigger on demoting him as some have suggested just yet, as this four game sample shouldn’t make us forget the elite production Salazar proved he was capable of last season. But that’s not to ignore that four games and 18 innings already make up nearly 30% of his major league body of work and his career ERA and FIP have already jumped to 4.35 and 3.83. With Trevor Bauer seemingly finding new life in Triple-A, if Danny Salazar doesn’t begin to correct these trends over his next several starts, you’ll have to wonder how long the Indians can let him work on trying to fix all three of his pitches.


Why is Bronson Arroyo Still Throwing a Changeup?

I respect the change-up. As a pitcher myself, I know how difficult it is to throw a good one (thus I don’t). It’s not the most glamorous pitch in baseball, but certainly an effective one if executed correctly. Plus, what constitutes a good off-speed offering reads like a laundry list of mechanical and ball path attributes that have to be repeated over and over again. Proper grip on the baseball. Delivery and arm speed must be identical to the fastball. Velocity needs to be lower than the fastball. The ball should move (ideally both horizontally and vertically) and spotted in a good location. And lastly, there’s the intangible pitching IQ of understanding when to throw it.

The Diamondbacks Bronson Arroyo and his change-up seem to be missing a majority of these qualities… but for some reason he continues to throw the darned thing. 16% of the time in 2013, in fact, and already almost 18% of the time this season. I’m baffled.

Now, of course I can’t know what’s going on in his head (although if someone can point me to an all-encompassing Pitching IQ metric I would be more than happy to apply it). And I also can’t measure his arm velocity at release. So I can’t quantify all of his deficiencies. But there is, fortunately, hard numerical and visual data showing he’s lacking the necessary skills to throw a change-up well.

Let’s look at Arroyo compared to pitchers who threw more than 200 change-ups between 2011 and 2013:

Movement:

Since change-ups (especially the circle change) tend to move down and to the right for right-handed pitchers versus down and to the left for southpaws, absolute value of x-Mov and z-Mov is used to standardize axis movement for both.

2011-2013 Abs(x-Mov) Abs(z-Mov)
League Average 7.17 4.30
Arroyo 6.00 3.60

I’ll give him a C- for movement. F’s are left for the likes of a Samuel Dedunowho posted a whopping 0.3″ of lateral and 1.6″ vertical (ignoring the natural pull of gravity) movement in 2013.

Velocity:

Again, keep in mind this does not include all pitchers, just ones who have thrown 200 or more change-ups between 2011 and 2013.

2011-2013 vFA (pfx) vCH (pfx)
League Average 90.9 82.9
Arroyo 86.6 78.2

When batters are already sitting on a below average fastball, it’s fair to say it won’t take much of an adjustment to catch up to the change. Below average may even be an understatement. There are only 12 guys in this data set of 275 with a lower average vFA. Jamie Moyer is one of them.

D+.

Location:

There are very few pitchers that can have success locating the change-up for called strikes.  Fernando Rodney being the freak off-speed guru who fools batters looking with a career 46.2 Swing%, 48.8 Zone% and 1.51 Val/C on the change. Typically the best change hurlers induce swings. And those swings either result in bad contact or a flat out whiff. But location of the pitch is still overwhelmingly crucial to achieve either.

I’ll use 2013 poor contact master Hyun-Jin Ryu and Braves injured whiff king Kris Medlen for illustration.

Ryu, with his 56.2 Swing% and 70.9 Contact% is looking to get bat on ball with the change. Ending 2013 with a .187 BABIP, the pitch worked beautifully to induce dribbling grounders (54.7 GB%) to an already above average Dodgers defense (3.1 UZR/150). How did he do it? Pin-perfect location (courtesy of Brooks Baseball).

 photo 74025e6d-0ca0-4068-802d-d2575977591e_zps07ccd3d1.png

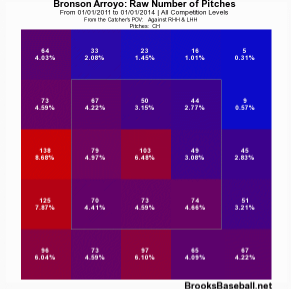
Arroyo also induces hitters to get the bat on the ball with the change… at a whopping 85.5 Contact% rate. But is he getting poor contact with the pitch? I somehow don’t think .600+ SLG and 23 HR  over the past three full seasons would constitute bad contact. Let’s compare his zone chart with that of Ryu.

 photo 53238386-6da5-4f8b-9c21-44707dbd34a3_zpsc37ace95.png


Not quite, Bronson.

“But what about whiffs?” you ask. With a 6.8 career SwStr%, batters aren’t swinging and missing Arroyo’s meatballs either.

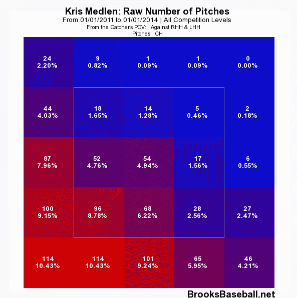
Let’s look at Medlen who owns a 27.5 career SwStr% on the pitch for comparison.
 photo 312d97a3-59b7-474d-8d46-43e4196b2988_zps9c5924cd.png

Pretty, no?

I’ll give Arroyo a D- for location. At least he’s not hanging them up and in on lefties.

So overall grade: barely passing.

I really don’t know what to say at this point. I’m miffed. Confounded. And who is the culprit to blame in the grand mystery of why he continues to throw this sub-par pitch? Batters have already gone deep on it twice in 2014. Is it the catchers? Do we point the finger at Devin MesoracoRyan Hanigan, and now Miguel Montero for keeping blind faith and confidence? Are these guys cursed with chronic short-term memory loss? Or do we blame Arroyo for stubbornly going out there outing after outing and continuing to shove that ball in the back of his palm and firing away? If that’s the case, I get it. I’m a pitcher. I’ve stood there on the mound and though, “This next one will be better, guys. I swear!”

So, please, Bronson. In the end, there is really nothing good that has come from you throwing the thing so often. I like you. I really do. I will forever be indebted to you for giving my beloved 2004 Red Sox their first World Series since “tarnation” was a common curse word. But please. Enough change-ups already.


Alden Carrithers and Being Good Enough

Alden Carrithers is twenty-nine years old, has zero major league at-bats, and has never hit more than three home runs in any minor league season.

Which is kind of why he’s so amazing, because he just might be relevant. Perhaps Carrithers won’t be relevant to the all-star game, or perhaps he’ll never even be relevant to major league baseball. What that doesn’t mean, however, is that he shouldn’t be. Carrithers is never going to play in the midsummer classic — that’s an assumption that can be made with a high degree of certainty — but there is a good case to be made that he belongs in Major League Baseball.

Carrithers has only one really plus tool, but that tool is pretty fantastic. This is Carrithers’ seventh season in the minor leagues, and in every single one of them he has more walks than strikeouts. That likely won’t hold up in the major leagues, but it will continue to at least some extent. Reaching base often for free while rarely taking the automatic trip back to the dugout is the kind of thing that generates value, and it’s the kind of thing that Alden Carrithers is. This isn’t a novel, new concept. But it is something that’s hard to always remember and realize, and really factor in to a player that would otherwise be labeled as Quad-A at best.

Because as much as this is, this really isn’t an article about Alden Carrithers. It could be about Mike O’Neill who had a ridiculous 91 walks with only 37 strikeouts last season, or it could be about Jamie Johnson of the Tigers, who’s had many more walks than strikeouts in his past two seasons. But those guys have flaws in their games that are pretty obvious, and they’re all further away from proving themselves ready for the show than Alden. This is really an article about something-for-nothing guys, and how available they are.

A naïve argument against the necessity for an article that points out the possible worth of a player of Alden Carrithers’ type is that these guys exist in bulk. That argument is more arguing against the very premise of WAR itself, however, since replacement level is very intentionally set to where it represents just that — replacement level players. There aren’t an abundance of one WAR guys hanging around. If there were, WAR would simply be wrong. There are, however, an abundance of zero WAR guys hanging around, which is kind of the idea.

Back to Alden, and why he’s probably not just another one of the zero WAR guys. The bane, of course, is his power. He’s never hit more than three dingers, as mentioned earlier, and his ISO has fluttered in the range of .066 without ever reaching higher than his rookie-ball .114. The literally outstanding plate discipline makes up for a lot of that, but in and of itself the plate discipline isn’t enough to make him a major league player.

His defense projects to be solid without being fantastic. There’s a lack of data on defense in the minor leagues, but the majority of scouting reports on him have been generally agreeable without being glowing. He can play second base, which gives him a little immediate boost in value, while also being able to pitch in at third base as well as left field. He’s only really projectable defensively at second base for any long-term stint, but that’s not a terrible thing. Second base is currently the third-weakest position in baseball from a hitting perspective — only catcher and shortstop are worse. And while shortstops and catchers are often able to add value simply by being capable of playing catcher and/or shortstop, the same often isn’t true with second basemen. The basic point is that second base is probably currently the worst position in baseball. It’s really hard to be good enough to play major league baseball, but if one is inclined to do so then second base is probably a good choice.

His speed is of the same ilk as his defense, in the sense that it is solidly useful as well as unspectacular. He’s stolen bases at a 77% clip throughout his minor league career, but he’s only stolen 89 bases total, suggesting that while his baserunning isn’t prolific it is in fact solid. This is further backed up by his Bill James speed score that has hovered just north of 5 throughout his career (suggesting just north of average). Oliver projects Carrithers to have a WAR/600 of 1.8, which is a reasonable projection although it probably slightly over-rates his defense (6.3 runs above average) while under-rating his running (-1.6 runs above average). The wOBA projection is at .297, which is roughly in line with Steamer and ZiPS.

All that said, if a starter goes down and Carrithers has to play for a quarter of the season or so he will likely contribute about half a win. A second baseman will probably go down this season, and he will probably be replaced with a zero WAR level player. Ryan Goins is currently the starting second baseman for the Blue Jays, and he’s a zero WAR player. Last year Dan Uggla became terrible and the Braves replaced him with Eliot Johnson who ended the season as–wait for it–a zero WAR player. Meanwhile Carrithers was available via a phone call, forty miles down the road at Triple-A Gwinnett.

This past winter, Carrithers was basically available for anyone who wanted him as a minor league free agent. The Oakland Athletics picked him up, and he’s currently at their triple-A affiliate Sacramento in the PCL. The A’s already have Callaspo, Sogard, and Punto playing second base at the major league level, all of whom are probably a little better than Carrithers. But Carrithers also isn’t that much worse than those guys, from a total value perspective. If any or all of those guys go down the A’s won’t be hurt that much, and it cost them nothing. It’s this sort of thing that (along with a lot of other sorts of things) gets a team ahead in a game where everything can feel random. The A’s, after all, are still moneyballing. That hasn’t stopped yet.

Carrithers will probably never wear a uniform in a major league stadium. But if he does, it will probably be the kind of uniform-wearing that will help the team he’s playing for win baseball games. Something for nothing, is a pretty good way to win.


Modeling Future Contract Extensions

Last month, Dave Cameron published a brilliant yet simple free-agent pricing model.  Using only projected 2014 WAR (ZiPS and Steamer projections are averaged) and the assumption that one incremental win is worth $5 million, it accurately projects the contract length and cost of last offseason’s free agents.  Cameron also made some minor tweaks to his model to project 2015 free agent contracts.  Both articles are absolutely worth checking out in full.

It’d be fun and easy to extend Cameron’s model to predict what David Price (2016), Chris Davis (2016), and Giancarlo Stanton (2017) would make on the free agent market.  (If you’re curious, Price would get 6/$136, Crush would get 6/$112, and Stanton would get 9/$260, assuming that the value of an incremental win increases annually by $500,000.)

But the recent slate of massive contract extensions illustrates the folly of this exercise.  Savvy front offices lock up top talent before it hits free agency, usually at a discount relative to the free agent market.  Young players often prefer an immediate certain payday rather than rolling the dice in free agency, when their future value will be far more unpredictable.  A model that predicts the value of contract extensions would thus be a useful counterpart to the free agent pricing model.  You’re in luck, because I just built one.

I kept the basic contours of Cameron’s model in place; as before, the only inputs are projected 2014 WAR and an estimated value of an incremental win.  This gives us the contract length (projected 2014 WAR times a multiplier that scales up depending on the WAR projection) and average annual value (projected 2014 WAR times $5 million).

To test the accuracy of this approach, I compared the extension model’s output to 32 contract extensions that have been signed since July 1, 2013.  I excluded players projected to produce less than 1 WAR this season.  I estimated the value of an incremental win produced by a closer as $10 million, which lines up with what closers earned in free agency last offseason.  If a player’s extension kicks in after the 2014 season, I counted the remainder of his current contract as part of the extension.

Free Agent Model vs. Actual Contracts

Player Team 2014 WAR Proj Yrs Proj Amount Proj AAV Act Yrs Act Amount Act AAV $/WAR
Mike Trout Angels 8.6 17 $731 $43 7 $146 $21 $2.4
Miguel Cabrera Tigers 6.0 12 $357 $30 10 $292 $29 $4.9
Clayton Kershaw Dodgers 4.7 8 $186 $23 7 $215 $31 $6.6
Dustin Pedroia Red Sox 4.6 9 $207 $23 8 $110 $14 $3.0
Andrelton Simmons Braves 4.5 9 $200 $22 7 $58 $8 $1.9
Jason Heyward Braves 4.1 8 $164 $21 2 $13 $7 $1.6
Matt Carpenter Cardinals 3.6 7 $126 $18 6 $52 $9 $2.4
Freddie Freeman Braves 3.5 7 $121 $17 8 $135 $17 $4.9
Jason Kipnis Indians 3.5 7 $121 $17 6 $53 $9 $2.5
Ian Desmond Nationals 3.2 6 $95 $16 2 $18 $9 $2.9
Jose Quintana White Sox 3.1 5 $78 $16 5 $27 $5 $1.7
Starling Marte Pirates 3.1 6 $92 $15 6 $31 $5 $1.7
Chase Utley Phillies 3.0 4 $59 $15 2 $25 $13 $4.2
Coco Crisp A’s 3.0 4 $59 $15 3 $30 $10 $3.4
Yan Gomes Indians 3.0 4 $59 $15 6 $23 $4 $1.3
Brett Gardner Yankees 2.8 4 $55 $14 5 $58 $12 $4.2
David Ortiz Red Sox 2.7 2 $27 $14 2 $31 $16 $5.7
Jordan Zimmermann Nationals 2.7 4 $54 $14 2 $24 $12 $4.4
Jedd Gyorko Padres 2.7 4 $54 $14 6 $35 $6 $2.2
Homer Bailey Reds 2.6 4 $51 $13 6 $105 $18 $6.9
Hunter Pence Giants 2.4 4 $48 $12 5 $90 $18 $7.5
Julio Teheran Braves 2.3 3 $34 $11 6 $32 $5 $2.4
Tim Lincecum Giants 2.0 2 $20 $10 2 $35 $18 $9.0
Will Venable Padres 1.9 2 $19 $9 2 $9 $4 $2.3
Jose Altuve Astros 1.9 2 $19 $9 4 $13 $3 $1.7
Craig Kimbrel Braves 1.8 7 $123 $18 4 $42 $11 $6.0
Ryan Hanigan Rays 1.6 2 $16 $8 3 $11 $4 $2.3
Michael Brantley Indians 1.6 2 $16 $8 4 $25 $6 $4.0
Chris Archer Rays 1.5 2 $15 $8 6 $26 $4 $2.9
Martin Perez Rangers 1.5 2 $15 $8 4 $13 $3 $2.2
Charlie Morton Pirates 1.4 1 $7 $7 3 $21 $7 $5.2
Glen Perkins Twins 1.0 4 $40 $10 4 $22 $6 $5.5

The initial results are mixed.  The model comes very close to the actual average extension contract length (prediction of 5.1 years vs. actual of 4.8 years), but badly overshoots the actual AAV.  Again, this is because GMs pay more for a win on the free agent market than for a win produced by a player already on their roster.  To account for this, I set the value of an incremental win at $3.7 million, the average WAR / $ of the 30 non-closers’ contract extensions.  (For closers, I used $7.4 million.)

Extension Model vs. Actual Contracts

Player Team 2014 WAR Ext Yrs Ext Amount Ext AAV Act Yrs Act Amount Act AAV $/WAR
Mike Trout Angels 8.6 17 $541 $32 7 $146 $21 $2.4
Miguel Cabrera Tigers 6.0 12 $264 $22 10 $292 $29 $4.9
Clayton Kershaw Dodgers 4.7 8 $138 $17 7 $215 $31 $6.6
Dustin Pedroia Red Sox 4.6 9 $153 $17 8 $110 $14 $3.0
Andrelton Simmons Braves 4.5 9 $148 $16 7 $58 $8 $1.9
Jason Heyward Braves 4.1 8 $121 $15 2 $13 $7 $1.6
Matt Carpenter Cardinals 3.6 7 $93 $13 6 $52 $9 $2.4
Freddie Freeman Braves 3.5 7 $89 $13 8 $135 $17 $4.9
Jason Kipnis Indians 3.5 7 $89 $13 6 $53 $9 $2.5
Ian Desmond Nationals 3.2 6 $70 $12 2 $18 $9 $2.9
Jose Quintana White Sox 3.1 5 $57 $11 5 $27 $5 $1.7
Starling Marte Pirates 3.1 6 $68 $11 6 $31 $5 $1.7
Chase Utley Phillies 3.0 4 $44 $11 2 $25 $13 $4.2
Coco Crisp A’s 3.0 4 $44 $11 3 $30 $10 $3.4
Yan Gomes Indians 3.0 4 $44 $11 6 $23 $4 $1.3
Brett Gardner Yankees 2.8 4 $41 $10 5 $58 $12 $4.2
David Ortiz Red Sox 2.7 2 $20 $10 2 $31 $16 $5.7
Jordan Zimmermann Nationals 2.7 4 $40 $10 2 $24 $12 $4.4
Jedd Gyorko Padres 2.7 4 $40 $10 6 $35 $6 $2.2
Homer Bailey Reds 2.6 4 $38 $9 6 $105 $18 $6.9
Hunter Pence Giants 2.4 4 $36 $9 5 $90 $18 $7.5
Julio Teheran Braves 2.3 3 $25 $8 6 $32 $5 $2.4
Tim Lincecum Giants 2.0 2 $14 $7 2 $35 $18 $9.0
Will Venable Padres 1.9 2 $14 $7 2 $9 $4 $2.3
Jose Altuve Astros 1.9 2 $14 $7 4 $13 $3 $1.7
Craig Kimbrel Braves 1.8 7 $91 $13 4 $42 $11 $6.0
Ryan Hanigan Rays 1.6 2 $12 $6 3 $11 $4 $2.3
Michael Brantley Indians 1.6 2 $11 $6 4 $25 $6 $4.0
Chris Archer Rays 1.5 2 $11 $6 6 $26 $4 $2.9
Martin Perez Rangers 1.5 2 $11 $6 4 $13 $3 $2.2
Charlie Morton Pirates 1.4 1 $5 $5 3 $21 $7 $5.2
Glen Perkins Twins 1.0 4 $30 $7 4 $22 $6 $5.5

With the adjustment to $/WAR, the results look much better.  The predicted average AAV ($11.3 million) is now only 6% higher than the actual average ($10.6 million.)  For the 31 players on the list (excluding Mike Trout, an outlier if there ever was one), the model projects a total of 147 years and $1.87 billion in contracts; the actual sums are 146 years and $1.67 billion.  Not perfect, but decent.

The model misses very badly for unusual situations.  Jason Heyward and Ian Desmond are projected as 8/$121 and 6/$70 respectively, but they both signed 2 year contracts worth less than $20 million last offseason.  Both players were unable to come to terms with their teams on longer deals.  This is probably because they are the odd men out on teams that have either just made it rain on prodigious young talent (Kimbrel, Freeman, Simmons) or will do so in the near future (Strasburg, Harper).  Instead, Heyward and Desmond opted for shorter contracts in order to avoid arbitration and set themselves up for 2016 free agency.

Mike Trout is a unique case.  The fishy outfielder signed a 7 year, $146 million extension last month, which looks like a massive underpay compared to the 17 years, $541 million (!!!) the model says he is worth.  Don’t get me wrong: for the Angels, the Trout signing is still the best deal since the Louisiana Purchase.  But it’s unrealistic to conclude that the Angels saved $395 million, since nobody would wait until Chelsea Clinton’s second term to test free agency, least of all someone who is currently breaking baseball.

Despite these shortcomings, the model can still evaluate the wisdom of recent extensions.  Plotting the 32 players on a 2×2 matrix (the x-axis is the difference between actual and projected AAV, and the y-axis is the difference between actual and projected contract length) shows which front offices overpaid and which got steals.

Scatterplot of Contract Extensions

Slide1

The extensions fall into four groups: locked-in bargains, short-term bargains, “win now” splurges, and albatrosses.

  • Locked-in bargains are the best kind of extension: these contracts are cheap and relatively long.  Yan Gomes is a good example; the model thinks he’s worth $11 million a year for 4 years, but the Indians locked him down for $4 million a year for 6 years.  Initially, I felt bad that Yan missed out on an extra $20 million, but then I remembered that he’s a millionaire in his mid-20s who probably sleeps well at night, whereas I am a non-millionaire in his mid-20s who does not play a sport for a living.
  • Short-term bargains are contracts that are cheap but shorter than projected.  According to the model, Andrelton Simmons is worth $13 million a year for 9 years; the Braves signed him for $16 million a year for 7 years.  So the Braves paid a below-market AAV for Simmons, but deprived themselves of controlling him for two more years (at least in theory).  One caveat here: as explained earlier, Heyward and Desmond fit into this quadrant because their teams were unwilling to pay out for longer contracts, and Trout is simply a freak show.
  • Win now splurges are contracts that are expensive but relatively short.  Clayton Kershaw fits here because he makes $14 million more per year than the model thinks he deserves, but has a 7 year contract rather than the 8 years the model would give him.  One could argue that Kershaw is a potential albatross, but if he leads the Dodgers to a World Series this year, their fans, like the Honey Badger, won’t care.
  • Albatrosses are exactly what they sound like: excessively long, pricey contracts that make fan bases cry.  Hunter Pence and Homer Bailey are the biggest albatrosses on the list; they were paid an extra $42 million (Pence) and $67 million (Bailey) than the model says they’re worth.  Miguel Cabrera really belongs in this quadrant as well.  The model considers Miggy a win now splurge, but only because it thinks he deserves 12 years rather than 10.  No, Tigers fans, Mike Ilitch did not help me build this model.

Finally, the model can estimate how much your team should pay to extend your favorite young star.

Extension Model for 2015-18 FAs under 30 with WAR > 2

Player FA Year Age in 2014 2014 WAR Ext Years Ext Amount Ext AAV
Yu Darvish 2018 27 5.1 9 $168 $19
Giancarlo Stanton 2017 24 4.5 9 $148 $16
Max Scherzer 2015 29 4.6 8 $136 $17
Jason Heyward 2016 24 4.1 8 $121 $15
Carlos Gomez 2017 28 4.0 8 $117 $15
David Price 2016 28 4.2 7 $109 $16
Pablo Sandoval 2015 27 3.7 7 $95 $14
Chase Headley 2015 29 3.6 7 $92 $13
Carlos Gonzalez 2018 28 3.5 7 $91 $13
Chris Davis 2016 28 3.5 7 $89 $13
Brett Lawrie 2018 24 3.4 7 $88 $13
Stephen Strasburg 2017 25 3.5 6 $78 $13
Carlos Santana 2018 27 4.0 5 $73 $15
Jay Bruce 2018 27 3.2 6 $70 $12
Ian Desmond 2016 28 3.2 6 $70 $12
Matt Wieters 2016 27 3.6 5 $67 $13
Justin Masterson 2015 29 3.1 5 $56 $11
George Springer 2019 24 3.0 5 $56 $11
Jason Castro 2017 26 3.2 4 $47 $12
Jonathan Lucroy 2018 27 3.2 4 $47 $12
Brandon Belt 2018 25 2.8 4 $41 $10
Desmond Jennings 2018 27 2.8 4 $41 $10
Jordan Zimmermann 2016 27 2.7 4 $40 $10
Colby Rasmus 2015 27 2.7 4 $40 $10
Yoenis Cespedes 2018 28 2.7 4 $39 $10
Pedro Alvarez 2017 27 2.7 4 $39 $10
Eric Hosmer 2018 24 2.6 4 $38 $10
Johnny Cueto 2016 28 2.2 3 $24 $8
Yovani Gallardo 2016 28 2.1 3 $23 $8
Billy Butler 2016 27 2.1 3 $23 $8
Jed Lowrie 2015 29 2.1 3 $23 $8
Brandon Morrow 2016 29 2.1 3 $23 $8
Asdrubal Cabrera 2015 28 2.1 3 $23 $8

To return to our earlier examples, Chris Davis would get 7 years and $89 million, David Price would get 7 years and $109 million, and Giancarlo Stanton would get 9 years and $148 million if they signed extensions this season.  Of course, it’s tough to predict who will sign an extension and who will try their luck in free agency.  Build me a model that can do that, and I’ll eat my Mets hat.


Battle of the Ks: K/9, K/BB and K%

The great debate has been raging for years: which strikeout-related metric is a better predictor of actual pitching success? Some would say there is no right or wrong answer — that each metric has it’s own unique merit and value. That one must look at certain strikeout-related metrics in combination with others. Unfortunately, as tragic as it may seem, statistical evidence begs to differ. Statistics tell us there is in fact a right answer, and it’s a whopper.

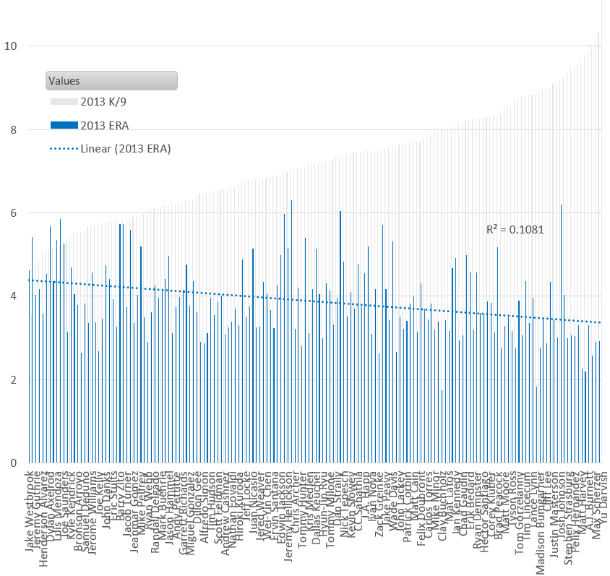
Let’s start with K/9. Looking at all 2013 pitchers with 80+ innings, the correlation (R2) between strikeouts per 9 and ERA is a solid  .1081. This correlation has been consistent, plus or minus a few hundredths, for the past five years. So nothing exciting or anomalous can be found in looking at other seasons. Yu Darvish leads the category with Tony Cingrani, Max Scherzer, Anibal Sanchez, and A.J. Burnett rounding out the top five. Additionally, eight of the top ten K/9 leaders ended up with sub 3.10 ERAs. So a decent indicator all-around.

 photo 53a65e17-24d6-482d-b2de-766753f09051_zps2940fbe7.png

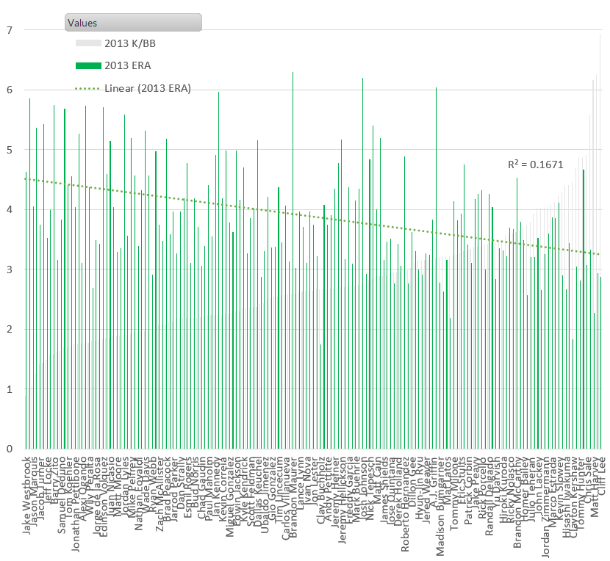
K/BB get’s a bit more interesting. We see a jump in linear correlation to .1671 — more than a 50% increase over K/9. Clayton Kershaw, Cliff Lee, and Adam Wainwright  all leap into the top ten of this metric, with Hisashi Iwakuma climbing into the top fifteen — four elite hurlers in 2013 left out of the K/9 leaderboard.

 photo 98225caf-a307-44c3-850b-d610a9444d32_zps70ee67d9.png

But the real gem is K%. It shows double the correlation versus K/9. Plus, the top fifteen in this category ended the year with sub 3.30 ERA — whereas Scott Kazmir (4.04) and Josh Johnson (6.20) smeared the good name of the K/9 leaderboard; with Kevin Slowey (4.11) and Dan Haren (4.67) unpleasantly loitering on the K/BB board.

The reason K% is so powerful is that it simplifies how effective a pitcher is at simply striking out each batter he faces. When BABIP gets involved — as it does for K/9 (high BABIP pitchers are rewarded on K/9 since the number of outs remains the same even if they’re giving up, say, 10+ hits per game) — the value of each strikeout is severely reduced.

 photo 17feabf1-8665-45c5-af39-48d69923e54a_zpsf45972cf.png


To recap:

2013 R2 (correlation to ERA)
K/9 .1081
K/BB .1671
K% .2089

So should we end the debate completely? No. But if you asked me to put money on Tim Lincecum, a career 25.8 K% pitcher with no decline in the stat over the past 2 years, over Tyler Chatwood, a career 13.0 K% who had a breakout year in 2013 with his freakish 76.3% LOB, I would bet on Lincecum every doggone time.