Who is the Real RBI Leader for 2012?
We all know that Miguel Cabrera had a phenomenal year in 2012, winning the Triple Crown and later being named the American League MVP. His 44 home runs and .330 batting average are all his own but the 139 RBI he amassed are a shared number, as he couldn’t accumulate RBI without the R (runners). What if everybody had Cabrera’s opportunities? Would others have eclipsed his RBI total?
To analyze this I calculated a percentage measure called the Runner Movement Indicator, or RMI for short. It’s a simple calculation once you have the data. Each time a batter comes to the plate with a runner on base, the potential bases that the runners can move are added together. A runner on 1st can move three total bases, 2nd base can move two and 3rd base can move one. Then, at the end of the at-bat, the final positions of the runners are compared with their starting position to determine the total bases moved out of the potential bases. For example if Cabrera gets a single with a runner on 1st, moving the runner to 3rd base, he is awarded two of the possible three bases, for a 0.667 clip. By calculating RMI as a percentage of the opportunities, we’re factoring out the increased benefit Cabrera gets from his stellar teammates.
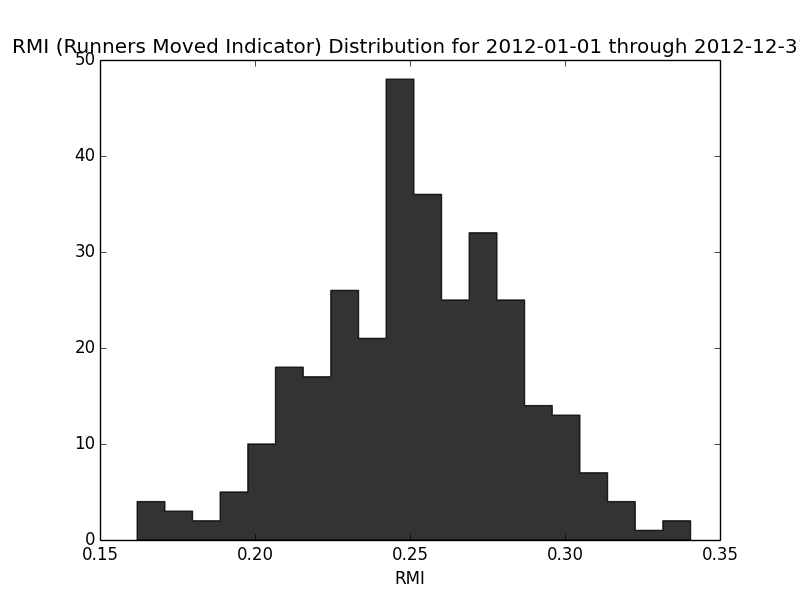
One of the beautiful things about RMI is not just that it is a simple calculation, but that it reads nearly like a batting average. This makes it is immediately easy to tell the good from the bad. Below is a histogram of the RMI for all qualifying players in 2012.
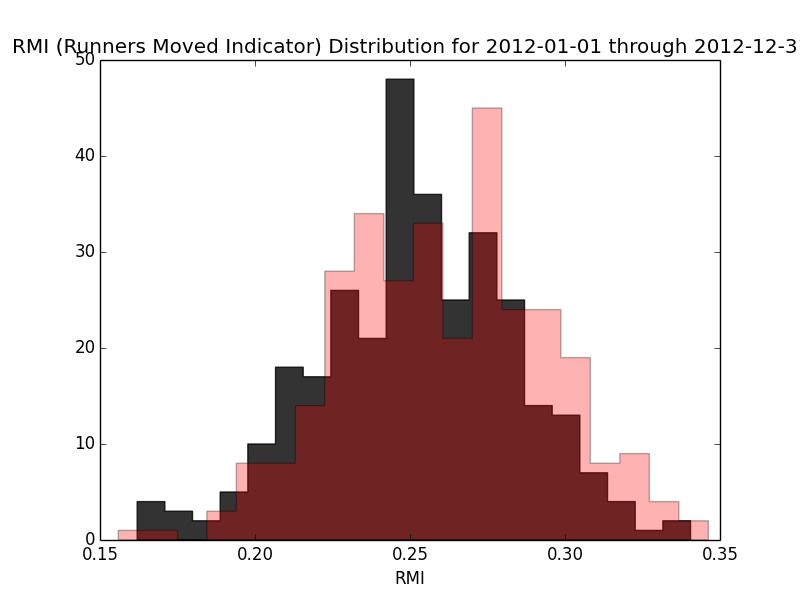
Now let’s overlay that with the batting averages from the same year in red. You’ll see the distribution is quite similar.
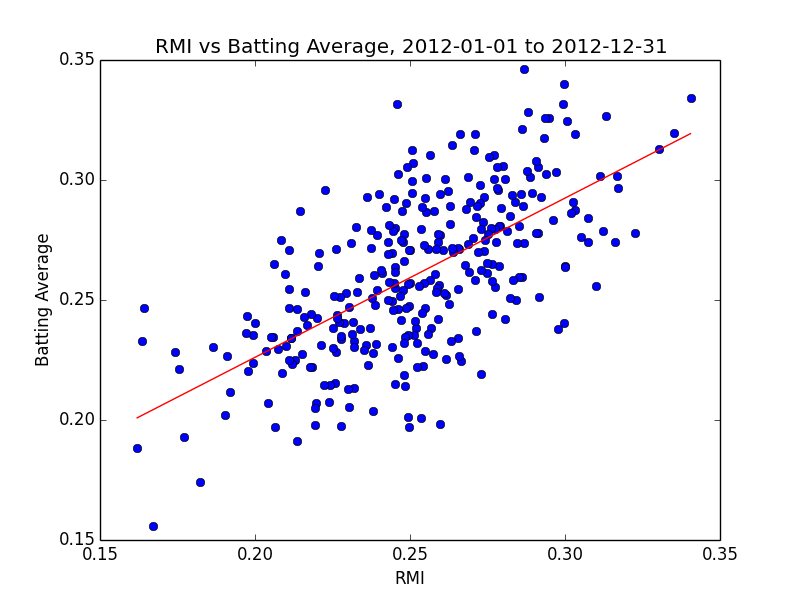
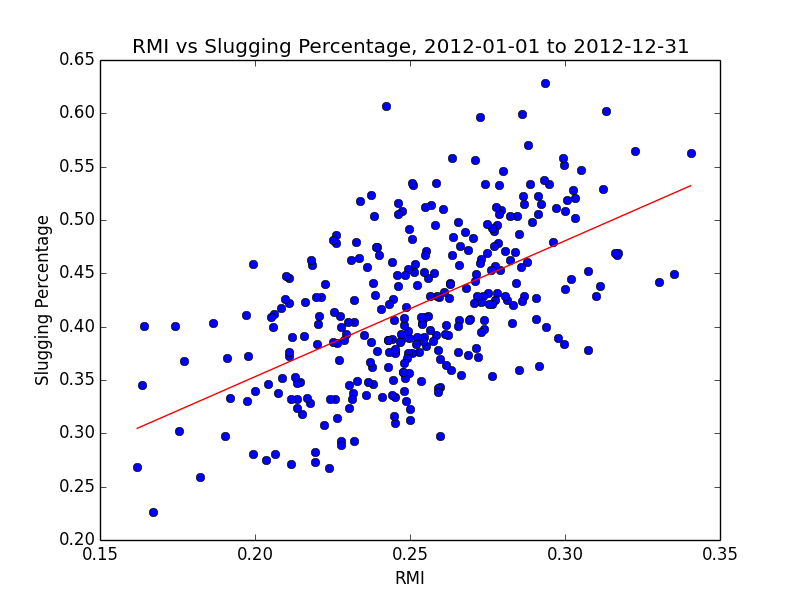
One might think that players with high batting averages also have high RMI, but that’s not quite the case. If we try to correlate RMI with Batting Average, OBP or SLG, we stay below a 0.5 R2 in each case although all with the expected positive slopes.
|
RMI vs BA |
RMI vs OBP |
RMI vs SLG |
|
0.411 R2 |
0.429 R2 |
0.323 R2 |
 * * |
 * * |
 * * |
Now that we know a little about RMI, let’s look at the leaders from 2012.
|
Player |
RMI |
Actual Bases Moved |
Potential Bases Moved |
RBI |
|
Joey Votto |
0.342 |
218 |
637 |
56 |
|
Joe Mauer |
0.332 |
336 |
1011 |
85 |
|
Torii Hunter |
0.328 |
300 |
915 |
92 |
|
Josh Hamilton |
0.323 |
288 |
891 |
128 |
|
Adrian Gonzalez |
0.317 |
329 |
1037 |
108 |
|
Yasmani Grandal |
0.317 |
117 |
369 |
36 |
|
Miguel Cabrera |
0.316 |
319 |
1008 |
139 |
|
Josh Rutledge |
0.316 |
128 |
405 |
37 |
|
Garrett Jones |
0.315 |
249 |
791 |
86 |
|
Elvis Andrus |
0.311 |
271 |
871 |
62 |
We see that Cabrera is 7th on the list for 2012. Still great, but not the best. We also see that Joey Votto moved runners around the bases at the highest rate, 26 points higher than Cabrera. So let’s use the RMI data above to see if anybody would have taken over the RBI lead given the same opportunities as Cabrera.
To do this we first subtract home runs from RBI, as the batter’s own bases aren’t used in RMI. Of Cabrera’s 139 RBI in 2012, 44 came from himself scoring on his own home run. This means he had 95 RMI influenced RBI based on a 0.316 RMI. If we apply this same ratio to Votto’s RMI of 0.342 we get 103 RBI. Votto’s 14 home runs bring him up to 117 RBI, still well shy of Cabrera.
Of course we know that Josh Hamilton was the one chasing Cabrera’s home run total in 2012, so let’s do the same calculation with him. Hamilton’s 0.323 RMI would give him 98 equivalent RBI. Adding in his 43 home runs brings him to 141 RBI, 2 higher than Cabrera. Too close to call? Nah… Hamilton wins.
Takeaways
The ability to get on base is one of the best predictive factors of runs and therefore wins. It gets better if you add RMI but they should be considered a distinct contribution. RMI leaders may not have great batting averages and vice versa. Undervalued players can be found with high RMI that have average OBP and BA stats.
More Data
Complete player and team RMI stats can be found on with the links below
Data Collection & Mining Techniques
All of the data used in this post was loaded from MLB’s gameday servers into a MongoDB database using my atbat-mongodb project. This project is open source code that anybody can use, modify, contribute to, etc. Fork me please!
https://github.com/kruser/atbat-mongodb
All data aggregation code and charts are written in Python using MongoClient, matplotlib, scipy and numpy modules. You can find that code on github as well. https://github.com/kruser/mlb-research
Other Notes on RMI
-
After collecting my data I ran across Gary Hardegree’s Base-Advance Average paper from 2005, which does a nearly similar calculation, with the exception that it gives the batter credit for moving themselves. I prefer to keep this a clutch stat and remove the batter’s bases.
-
The RMI data does not correlate to team run production as high as Batting Average, Slugging Percentage or On-Base Percentage. Adding OBP to RMI correlates much higher, but then again, that’s what a run is–getting on base and moving around to home. So there isn’t anything noteworthy enough there to post numbers.
-
In order to qualify for my list a batter must have a minimum of two potential base movement opportunities per game. Opportunities fluctuate largely among regular players so it is important not to keep this requirement too low.
Software Developer from Austin, TX. Transplant from Minnesota. Big Twins fan.
A very interesting read.
Small quip–
“For example if Cabrera gets a single with a runner on 1st, moving the runner to 3rd base, he is awarded two of the possible three bases… we’re factoring out the increased benefit Cabrera gets from his stellar teammates.”
Reconsider that 1st to 3rd example–a stellar or slow baserunner–say, Mike Trout vs Delmon Young–would add/subtract value on the basepaths in a way that isn’t factored out here, right?
@jcxy, absolutely true. An improvement might be to weight the advancement based on the speed of the runner. That would take the simplicity out of the equation, which I rather like, but it would factor in your point.
dude, there’s a reply button
Dude, where’s my car?
I bet baserunning would account for more than 2 rbi’s worth of bases.
“We’re factoring out the increased benefit Cabrera gets from his stellar teammates”
But leaving in teammate speed without correction.
@UCLAboi – sure it would. The RMI to RBI ratio is a toy, although the RMI itself I contend to be very telling. Maybe not predictive but certainly telling.
@JohnChoiniere – one step at a time. RBI also suffers from awarding a batter for fast teammates.
…and would he please stand up, please stand up?
I had an idea for this exact stat a couple of years ago but couldn’t find anything about it. When was it created?
@Sam – I haven’t seen a formal definition of the stat. I’ve seen one other paper on the subject as I mention in the post, but it included the batter’s own bases, which I didn’t quite like.
Here is my brain dump on the subject: https://docs.google.com/document/d/15TnBSabiBaSamamAirtTI1gEev1fEIx-V16BNOiipug/edit?usp=sharing
How did you accumulate your data. I would love to make my own reports as high a quality as your. But I don’t where to find good data.
I apologize for my last comment. I did not read the whole article before I posted a comment. Not a smart move. Thanks for the info.
@Ian – The data comes from the MLB servers that feed their AtBat application.
http://gd2.mlb.com/components/game/mlb/
Now, that data as it is, isn’t great for doing analysis as it is very flat and stored in a directory hierarchy that is more suited to their application. So I wrote project to pull that data down and store it in a MongoDB database. That project is open-source and I invite anybody to check it out. It probably requires some software development background, but not a crazy amount.
https://github.com/kruser/atbat-mongodb
After I had the data in my database, I wrote some python scripts to mine it out. I have those on GitHub as well.
https://github.com/kruser/mlb-research
If you want to use those projects and have trouble getting going, send me a note on github.
I like this statistic for its simplicity. As others have pointed out, speed of base runners is a factor and you could make a more complex stat based on that. That would be interesting, but I think it’s a valuable stat as is.
I may be way off (and if so by all means tell me), but wouldn’t a more telling measure be the sum of the RMIs for each base relative to league average at that base? I realize this is meant to be a simple measure and that over the course of a season’s opportunities it’s likely to be mostly a wash. I just can’t shake the idea that if you have a hitter who hits only singles (BA 1.000) but always has only a runner on third and a hitter who hits only doubles (BA 1.000) but always has only a runner on first, the singles hitter is guaranteed to have an RMI equal or greater than that of the doubles hitter. It seems the OBP of teammates is being factored out, but the positioning of teammates which can be affected by their SB and XBH abilities is not.
What would the RMI be if a runner is at 3rd with one out and the batter hits a sac fly? I’m guessing 1.000? Even though the player didn’t get a hit.
@mlstarr – you’re not way off, but those occurrences may be factored out over time. Click the links for the player data over the past couple years and see what you think.
@Jefferson – correct, 1.000. The same goes for if he grounded out (not the third out) and the runner still scored. My minimum qualifier for the lists I provided is 2 potential bases per game.
Great article and stat. Who created it?
Do you have a spreadsheet with number of times each player has had a runner on first, second, and third instead of the total potential bases, or would that take some mining?
It’s amazing on which pace Joey Votto was in his 2012 season. Would’ve been a historic one if he stayed healthy.
@Jay – I created RMI
@mistarr – Great idea. I updated my RMI code to accumulate this data as well. I updated the 2012 spreadsheet with those counts. They’re the last three columns.
https://docs.google.com/spreadsheet/ccc?key=0AtERgAQ83pATdHVSMUI1YnFBVThpYnhSYmRiTmJpT1E&usp=sharing
How did you get the numbers for each player? Did you have to watch each AB?
@Jay – MLB has all of this data available via XML documents. For example, here is the log from the Twins/Yankees game that was just rained out.
http://gd2.mlb.com/components/game/mlb/year_2013/month_07/day_12/gid_2013_07_12_minmlb_nyamlb_1/inning/inning_all.xml
This is good. I have the same comments about baserunner speed and certain advances being easier than others, but appreciate the simplicity for now. Also worth pointing out you should probably base the conversion to RBI based on games played or PA. RBI are dependent on your team getting on base for you and you want to strip that away, but Cabrera played 13 more games than Hamilton so he has actually earned some extra RBI chances simply by being healthy.
@kruser- thanks for the response. While I applaud your goal of simplicity, I feel that baserunner speed is a worthwhile factor to further consider–if only for completeness sake. We certainly wouldn’t be shocked if it turns out that the sum difference is on the magnitude of fractional, right?
@jcxy – I wouldn’t mind a variation of the RMI stat and factored baserunner speed. How deep do we go though? Some slow runners are better at reading hit balls than faster runners and may get a leg up. Both benefit the batter but are hard to measure objectively.
The scoreboard does not change based on getting on base or movement on the bases, even though both are instrumental to the run generation process. It only changes when a runner scores and runs only score with RBI, errors, or PB/WP – the vast majority by RBI-95+%). RBI’s, including your own RBI from a HR always change the scoreboard, why replace it with something else given its importance.
I agree with the effort to adjust RBI totals for opportunity. However, limit it to actual runs driven in and not put lipstick on a pig and call the pig honey.
Perhaps weight the runners on base by RE (average RE with 1 out for simplicity), and then calculate (total RBI-sum of RE) divided by the (sum of the RE).
Solid work, but I do not think it answers the question of “who is the real rbi leader’. To answer that, I prefer my method. Find the ‘expected’ value of runners driven in based on the baseout situation each player is presented with, such as .59 RBI per every at bat with a runner on 3rd and 2 out. You can find read more at:
http://www.hardballtimes.com/main/article/the-opportunity-of-rbi/
I love the simplicity. It makes it easier to understand and if I were a GM, I’d definitely use it. GMs know if they have good base runners on their team, a guy who has a high RMI would flourish even more if added to their roster. Very well thought out article and very impressive knowing that you wrote a program to grab the info yourself.
What do you do with PAs that end in IBBs and UIBBs?
@Garbanzo – Great question. All walks are treated equal in my current equation. So a walk with a runner on 1st will yield a 0.333 RMI, even an intentional walk.
I’ve thought about changing it so IBBs in that scenario would generate a 1 for 1, or 1.000 RMI as the batter had no chance for a 3 for 3, but for now I haven’t implemented that. Thoughts?
I think this would make more sense if you counted the batter as a runner, too. Add four “potential bases moved” for the batter each at-bat, and count his total bases toward “actual bases moved”. Then you don’t have to count home runs separately at the end.
If a player gets a 0 for 2+ when he’s walked with RISP and 1b open…… Maybe you should do RE24 changes but vaporize the baserunner if he reaches (or HRs) before calculating the RE24 value of the end state.
(Aha, if I actually read the article my point is mentioned. I completely disagree with your reasoning here. Even with the batter’s own advancement accounted for, at-bats with runners on are still weighted much higher! I bet the stat with the batter’s own bases moved added in correlates much better with overall team offensive production than this one. Why add OBP, which is calculated quite differently, when you can instead fluidly account for the hitter’s own advancement? There’s probably a better way to do it, though.)
Excellent article, I’ve been wondering for some time how batters would rank in a stat which measures not just RBIs, but moving runners ahead on the bases.
Having just perused the comment section, I see the questions on how much baserunner speed changes these numbers, and would wonder if team baserunning/stolen base values could be averaged and applied to this to balance batters moving slower or faster runners. Also, this applied on a team level.
The study isn’t fair. Power-hitting lefties, switch-hitters, and slap-hitting righties are going to have more runners moved than power hitting right handers because it’s easier for these guys to move the runner from first to third, and is not indicative of the players’ ability to drive in a run. Yes, that hitter is better at moving runners along because the distance from right field to third is a lot farther than left field to third, but the distance from left field to home and the distance from right field to home is the same, unless you’re playing at a ballpark with odd dimensions, such as Fenway. The only way to even this out is if slugging percentage was factored in there somehow.
It’s an interesting article and concept for sure, but several major flaws including these:
1) Do I understand correctly that if a batter comes up with runners on 2nd & 3rd, and gets intentionally walked, that’s an 0-for-3 on the RMI? Sheesh, no wonder Cabrera didn’t pan out as well.
2) Not counting the batter moving himself reminds me of the same flaw as that “runs created” stat. Both of these seem to say that if a batter gets an RBI single with a runner on 2nd, that’s of equal value as if the guy had slugged a 2-run homer.
Nice work. It seems like hit-and-run could have an effect too, especially if some teams are more prone to this tactic than others. A hitter with good contact skills coupled with a team that likes to hit-and-run may get a little advantage.
You could consider building in a weighted average of the BsR of the 5 previous batters. if you were comfortable with a value-based stat that is.
This is really cool work, it seems to me to be a stat that a non-stathead would be able to get behind as is, but I think it would obviously be more accurate if it factored in baserunning.
Just wanted to say great job man. Very impressive work, but an even more impressive presentation. I’m glad the FanGraphs staff acknowledged this.
Now we need to know how much of RMI is a repeatable skill and how much of it is randomness.
This is great. I’m no statistician by any stretch, but I like to see people tinker with numbers because my thinking needs to be challenged regularly.
I enjoy seeing Elvis Andrus’ name among the usual suspects. It seems to suggest 2 things at a glance: (1) your theory and its attendant equation doesn’t exclude lighter hitters; and (2) Elvis brings runners around the bases. Boy, does that say a lot about Andrus and how valuable he is.
@Phils_Goodman – I agree. For now I’m happy with the stat being a good tell of what actually happened, like BA-RISP. in the future I might undertake proving it out one way or another.
@cheif00 – exactly. A run isn’t just the RBI. Andrus being a good example there. Mauer being another.
There were some previous comments in this thread about taking intentional walks out of the equation, as the batter has no influence there. The batter did influence the fact that they were intentionally walked though, so I’m a little torn here. My gut says to remove these at-bats but leave in unintentional walks.
Any guesses as to how far Cabrera goes up in 2012 RMI before I do that?
Good stuff.
In addition to the IBB issue, regular walks seem over-valued – if RMI is supposed to be a real RBI indicator. I think your calculation treats a walk with runners on first and second as RMI equivalent to a single with a runner on second. But the latter plates a run while the former doesn’t.
The over-values high walk guys like Votto, and penalizes free swinging high BA players. This is why I suspect that Votto will have significantly lower RBI totals than Cabrera, which if a matter of luck would balance out over a career.
@ajkreider – a walk with runners on first and second would yield advancement of 2 out of 5 possible bases, or a 0.400 RMI for that plate appearance.
Meanwhile a single with a runner on second where the runner scores would yield a 2 out of 2 possible bases, or a 1.000 RMI.
You are correct of course. I should’ve picked a better example. As with runners on first and third, a sac fly or fielder’s choice plates a run. A walk doesn’t but is credited with the same RMI (.250). A guy who homers 1/3rd the time with a guy on first gets the same RMI as a guy who walks three times in the same situation.
The point is that walks very seldom plate runs. Doesn’t mean your stat isn’t useful, obviously.
Follow up on my last comment. Cabrera had 18 IBBs in 2012. Turns out the other runners were already factored out in the XML data provided by MLB, so the numbers stand.
I disagree with many of the people suggesting that teammate baserunning should be accounted for in RMI. While it certainly would make it more accurate, RMI seems like a very good base for similar statistics. As the OP has pointed out, the simplicity would be lost, given the imperfections in those metrics. Also, adding teammates running would only plug in one of the several missing variables from the perfect stat.
Thanks for using a good plotting tool (MATLAB?) instead of using Excel or whatever that abomination Dave Cameron uses.
Matplotlib – a Python module. It’s pretty great.
http://matplotlib.org/
I’m curious about year to year correlations- does RMI indicate a repeatable skill or does it tend to jump around?
I’d like to do a proper repeatable skill study, but I haven’t done that yet. I have the measures back to 2010 if you’d like to eyeball them for now.
https://docs.google.com/spreadsheet/ccc?key=0AtERgAQ83pATdHVSMUI1YnFBVThpYnhSYmRiTmJpT1E&usp=sharing
Interesting stuff. What was the sample size for the AVG/OBP/SLG correlations? 2010-2013 or just 2012? I’m wondering if a stronger correlation would show up given a larger sample size.
I see Elvis Andrus at #11 in 2012 and I just can’t bring myself to believe that he’s really THAT efficient at moving runners over. Who do you want batting in a close game with runners on base, Elvis Andrus or Edwin Encarnacion? I’ve got to think that this is measuring luck to a large extent. This could be similar to BABIP, and could be used to help identify who is getting lucky in the RBI department and who is not, similar to how BABIP is used for AVG.
@Mister, excellent comment!
I only used data from 2012 in my regression plots, so about 300 data points. My spreadsheets have yearly data back to 2010 if anyone wants to plot it out for more years. I’ll look into doing that soon as well.
As far as the BABIP, I’ve been thinking the same thing. As much as I want it to be a predictive skill, I think it may be more about identifying over/under performers. Take Joe Mauer as an example. He has a 0.332 RMI in 2012 on a 0.319/0.415/0.446 but this year through July 8th his RMI is 0.255 on a very similar 0.312/0.391/0.465. I’m looking forward to a much luckier/timely second half for him.
Either way, it would take more analysis to prove if it is a repeatable skill or if it is more like BABIP.
I’m trying to get your AtBat project up and running and I’ve hit a roadblock when attempting to load the DB for the first time. I’m hoping to perform some data analysis in support of a project that I’m working on. If you’re willing to help me out with some debug advice, please send me an email. Thanks!
Hey, Ryan.
Are you still updating these stats somewhere for 2013 and 2014? Is someone else carrying the torch?
Thanks!