Are the Mets in Rebuilding Mode Once Again?

The Mets are the talk of the town…for all the wrong reasons. They currently sit at a 31-41 record and are 12 games behind the Washington Nationals in the NL East, which as of now seems to be theirs for the taking. The Mets boast one of the worst bullpens in the majors and have been plagued by injuries as well as underperformance from the bulk of their lineup. With the results of this season, many are beginning to wonder if it’s time to turn the page on this current pack of Mets players, many of whom were on the 2015 team that lost to the feisty Kansas City Royals in the World Series. I will attempt to go group by group in an effort to determine whether or not the Mets should begin a new rebuilding process, the most dreaded phrase in sports.

Starting with the outfield, Yoenis Cespedes is locked in for three more years in his current contract. It’s understandable why the Mets were looking to sign him in the offseason based on his performance in 2015 and 2016. However, injuries and poor performance have contributed to the current record that the Mets have. Cespedes still won’t lose his spot in left. Curtis Granderson, due to his age, will most likely not be re-signed, as well as Jay Bruce who, if he is not traded before the deadline, will most certainly test free agency. Juan Lagares has been injury-prone the last couple years but the one piece of good news is that Michael Conforto has seen a resurgence since coming back from Triple-A Las Vegas. Also, one of their top prospects, Brandon Nimmo, should receive regular playing time in the outfield, if not this season, then definitely in 2018.

Next, we have the infield, which has been decimated by injuries. Neil Walker and Asdrubal Cabrera have struggled through injuries (and who knows if/when David Wright will ever step on a baseball field again). Jose Reyes and Lucas Duda have mightily underperformed. The good news for the Mets is that Cabrera, Walker, and Reyes will be gone after the season, which means that the infield can get much younger. Top prospects Dominic Smith and Amed Rosario will be September call-ups and, if all goes well, can be regulars in the lineup next year. T.J. Rivera and Wilmer Flores have proven to be reliable pieces in the lineup. Despite some injuries from Flores, he has made up for it with his versatility in both the field and in the lineup, giving manager Terry Collins options to choose from. While Flores and Rivera may not be long-term solutions, they are the best options that the Mets have at the moment. As far as catching is concerned, Travis d’Arnaud is probably the Mets’ best option right now, although he has severely underperformed since being traded to them. The Mets should try to get another catcher in free agency.

Finally, the best pitching staff is a huge question mark, but also a big concern among scouts. Matt Harvey clearly no longer has any interest in remaining with the team and Noah Syndergaard, Zack Wheeler, and Steven Matz are just injuries waiting to happen. Even Jacob deGrom, who has been I believe the best starter this season, has a history of arm injuries that makes Mets front-office personnel nervous. Even Robert Gsellman and Seth Lugo are recovering from injuries sustained during this season. The bullpen has been just as bad. The bullpen so far has logged 257 innings to the tune of a 4.97 ERA. Not to mention they have not had a reliable closer since Jeurys Familia has been both suspended and injured this season, and the rest of the bullpen outside of Addison Reed and Jerry Blevins has been downright horrendous.

Overall, the Mets need to begin the next phase of the rebuilding process. With aging veterans and current players underperforming, it’s clear that the time for a championship has come and gone for this group. The Mets need to get younger and it starts with the old addition-by-subtraction technique. By dumping aging veterans with big contracts, the Mets will be able to allocate their resources and maybe pick up some pieces in free agency while simultaneously giving their top prospects playing time and allowing them to develop. As the great Cosmo Kramer once said on Seinfeld, “I think it’s time that we shut down and re-tool.”


The Free Agent Value of Michael Pineda

Michael Pineda is having by far the best season of his career ever since he broke into the big leagues with Seattle in 2011. This is good news for Pineda who is in a contract year and looking to earn a huge payday on the open market this winter. However, this is bad news for teams, especially the Yankees, who have many questions surrounding their starting rotation with CC Sabathia also in a contract year and Masahiro Tanaka having the chance to opt out of his current contract after the season (although the latter seems unlikely at the moment). Pineda reminds me of one player in particular: former Yankee Ivan Nova.

Like Pineda, Nova has a fastball in the mid-90s and good secondary pitches, including a nasty curve and a change-up which he has begun to develop under Pittsburgh Pirates pitching coach Ray Searage, aka “the pitcher whisperer”. While Nova’s strikeout numbers have gone down, he has learned to pitch rather than just throw, which has resulted in fewer guys getting on base against him as well as his K/BB ratio going down, which I believe have been key contributing factors to his success in Pittsburgh. Also like Pineda, Nova hit the ground running, going 16-4 with a 3.70 ERA in 2011, and he was arguably the Yankees’ second-best starter behind Sabathia. However, as teams began to expose tendencies, combined with mounting injuries, Nova was never able to maintain the same level of success in New York.

The same could be said for Pineda, who missed two full seasons and most of 2014. Even after coming back in 2015, Pineda still struggled to maintain any level of consistency, after posting respectable numbers as a rookie. Now, Pineda has harnessed the power of his wipe-out slider and has become a ground ball pitcher (51.5%) to cope with the home-run haven that is Yankee Stadium. His K/BB ratio has gone down and his WHIP has dropped from 1.35 to 1.13 this season. The formula is simple: the fewer baserunners there are, the better a team’s chances are of winning. Also, like Nova, Pineda is using a change-up more in his pitching repertoire, to complement his slider. As a result, he has generated a 43.3% swing and miss percentage on pitches outside the zone, a 7% increase from last season. Additionally, they are close in age, since Nova was 30 when he signed his new contract, and Pineda will be 29.

The Pirates ended up giving Nova a three-year, $26-million contract last offseason. As long as Pineda continues to have success this season, he will also end up getting a similar deal. I predict he will end up staying with the Yankees for three years for somewhere in the range of$36-39 million simply because the Yankees will be desperate for starting pitching and may even pay a little bit over his market value to keep him. These types of deals are always risky, and many look to the Dodgers signing Rich Hill. However, Pineda has proven that he has always had the talent to pitch in New York and it seems that he finally has his head in the right place to help him reach his full potential. I believe that the Yankees will also re-sign Sabathia to a one-year deal in the range of $5-10 million, considering he will be 37 next season. If the Yankees manage to acquire another lefty or even sign Jake Arrieta, the Yankees starting rotation could be something to look out for in 2018.


Pitch-Framing and Twins Pitchers

On Wednesday, November 30, 2016 the Twins announced the signing of free-agent catcher, Jason Castro to a 3-year, $24.5MM contract, a move that was widely attributed to the Twins’ new front-office comfort with advanced analytics. Jason Castro is widely regarded as very good defensive catcher, due in large part to his ability to frame pitches and steal strikes for his pitchers. In 2016, Castro ranked third in all of baseball in Baseball Prospectus’ Framing Runs statistic, with 16.3. Kurt Suzuki, the Twins primary catcher in 2016, ranked 92nd at -6.8. Suzuki’s main backup, Juan Centeno, ranked 97th with -9.7.

Castro is a roughly average offensive catcher. He put together a 88 wRC+ in 2016, which ranked 17th among catchers with at least 250 PAs, via FanGraphs. For reference, the league-average wRC+ for catchers in 2016 was 87. But, he got a $24.5MM contract primarily because of his framing and the Twins are expecting him to make an impact on their pitching staff.

So where might the Twins pitchers benefit from better framing? Let’s look at the Twins pitchers (that are still with the organization in 2017) that threw at least 50 innings in 2016, sorted by innings pitched:

Table 1 Twins 50 IP

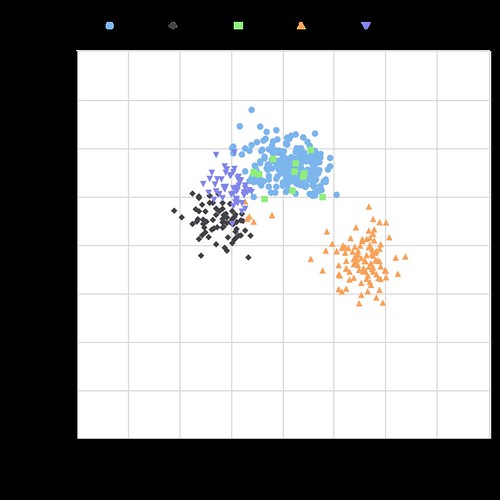
Using this list of pitchers, we can utilize FanGraphs’ excellent heatmaps tool to explore each pitcher’s distribution of pitches around the strike zone. For example, here is Kyle Gibson’s 2016 pitch% heatmap, which displays the percentage of pitches thrown to each particular segment in and around the strike zone (from the pitcher’s perspective). The rulebook-defined strike zone is outlined in black.

Gibson Pitch% Heat Map

There are not many surprises here, as we can see Gibson most often pitches down in the zone, and to his arm side, which is likely driven in large part to the high number of 2-seam sinking fastballs he throws (27.2% of total pitches in 2016, per PITCHf/x data available on FanGraphs).

What this data also lets us do, is explore each pitcher’s propensity for pitching to the edges of the strike zone. Let’s assume much of the benefit of pitch framing occurs at the edges of the strike zone, where pitches are less definitively a ball or a strike to the eyes of the umpire. By focusing on the edges of the zone we can identify which Twins pitchers might benefit most from better framing.

For this analysis, I focused explicitly on the strike-zone segments just inside and just outside the rulebook strike zone, which are the areas between the gold lines in the graphic below:

Gibson Total Edge Pitch%

Using the pitch data in these sections, I calculated a metric for each Twins pitcher, Total Edge%. These data points are summarized in the table below and show us the percentage of pitches thrown on the edge, or just off the edge of the strike zone, by each Twins pitcher:

Table 2 Twins Total Edge%

What we can see is the Twins’ starting pitchers seemed to pitch toward the edges of the strike zone more than the league average and more than their reliever teammates in 2016, with the exception of Brandon Kintzler. Ervin Santana is approximately at league average, which was 44.7%. Kyle Gibson is significantly above, at almost 49%. Jose Berrios, Phil Hughes, and Hector Santiago are all up around 47%.  So, as a starting point, we can assert that Gibson, Berrios, Hughes, and Santiago are the primary candidates to benefit from better framing.

But how do they fare in getting called strikes around the edges of the zone?

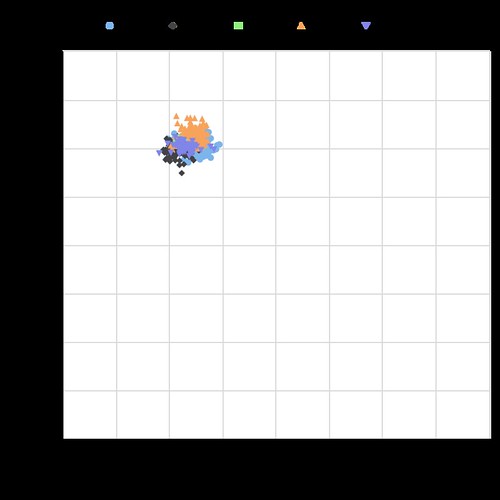
Using the same heatmaps tool, we are also able to visualize each pitcher’s called strike percentage (cStrike%), in each segment of the strike zone. Here is Gibson’s for 2016:

Gibson Total Edge cStrike%

As we would expect, pitches located in the middle of the zone are nearly always called a strike, evidenced by the bright red boxes and rates at or near 100%.

Our interest is just on and just off the edge of the strike zone, which I again outline in gold. Here, we see more variation, with the called strike percentage ranging from as high as 88% in the zone to Gibson’s arm side, to as low as 27% inside the zone up and to his glove side. We also see, pitches just off the strike zone are called strikes at a much lower percentage than pitches just in the zone, as you would expect. We need a reference point. How do the Twins compare against the rest of baseball?

Using this data, I calculated two additional metrics, In-Zone Edge cStrike% and Out-Zone Edge cStrike%, which delineate the called strike percentage on the edge and in the zone, and on the edge and out of the zone. Focusing on these strike zone segments, I calculated the called strike percentage for each Twins pitcher. Also included are the MLB averages for each metric.

Twins In Zone Edge cStrike%

What we see above is that six of the 10 Twins pitchers to throw 50 innings last season had a lower than league-average called strike rate on pitches on the edge and inside the legal strike zone. Ryan Pressly and Jose Berrios appear to be the most impacted, with called strike rates of significantly less than the league average of 64.9%, at 52.8% and 57.5% respectively.

But what about just off the edge?

Twins Out Zone Edge cStrike%

When we focus on the segments just off the strike zone, we see this same trend play out, but even more significantly. The visual above shows that eight of the 10 Twins hurlers had lower than league-average called strike rates on pitches just off the strike zone. This indicates that they were not getting many strikes stolen in their favor. In most cases for the Twins, the difference from league average is quite significant. Berrios, Michael Tonkin, Pressly, Taylor Rogers, and Santiago each have rates right around half the league average of 10.4%. The net result, when we add up the In-Zone and Out-Zone Edge cStrike% for Total Edge cStrike%, is that seven of the 10 Twins pitchers studied had called strikes rates around the edges of the strike zone that were decidedly less than league average.

Now, this probably isn’t all that surprising intuitively. We know the Twins as a whole did not pitch well last year (29th in ERA, 27th in FIP, per FanGraphs), and we know the Twins catchers did not rate well as pitch-framers. Kurt Suzuki and Juan Centeno combined to catch nearly 86% of the Twins’ defensive innings last season. But for as bad as the team pitched, it is also clear the pitchers were not getting much help from their catchers.

But how many pitches are we talking about here? If we assume a league average called strike rate on the edges of the strike zone (which was 36.1% in 2016) for the Twins, we can estimate an additional number of pitches that would be called strikes. This is what we find:

Table 3 Estimated Called Strike delta

By this analysis, it seems that Jose Berrios, Ryan Pressly, and Ervin Santana would benefit the most from better pitch-framing, with each gaining roughly 20 additional called strikes over the course of the season.

But how much does a pitch being called a ball, instead of a strike, matter?

Let’s look at the major-league batting average by count in a plate appearance. The data in the table below is from a 2014 Grantland article written by Joe Lemire, and calculates the batting average for plate appearances ending on specific counts. For example, the batting average on plate appearances ending on the 0-1 pitch is .321. The data fluctuates slightly year to year, but in any given season, you’ll find a table that generally looks like this:

Table 4 Batting Average By count

By this measure, the value of a strike, depending on the count is quite significant. In a 1-1 count, for example, if the next pitch is called a strike, making the count 1-2, the batter’s expected batting average drops from .319 to .164. Similarly, if the pitch is a ball, making the count 2-1, the batter’s expected average increases to .327. That’s a .163 swing in expected batting average.

Others have approached this differently by trying to calculating the expected outcomes by the result of the at bat that reaches each count. So for example, what is the expected outcome for all plate appearances that reached an 0-1 count, regardless of whether it was the 0-1 pitch that the outcome of the plate appearance was created. Nonetheless, we find a similar result. This is a revisit of the idea by Matt Hartzell published on RO Baseball in 2016:

Chart 1 Batting Average By count

Chart 2 OBP By count


While the differences here are not quite as steep as before, we still see the swings matter. Batting average after a 1-2 count is .178, where after a 2-1 count it is .247. That’s still a .069 swing in batting average. We also have added on-base percentage, and the trend holds. OBP after a 2-1 count in 2016 was .383, versus just .229 after a 1-2 count.

So, all of this helps us show the Twins have a pitch-framing problem and pitch-framing matters because getting more pitches called strikes leads to fewer runners on base.

But can Jason Castro fix it?

To try to find out, let’s look at the Houston Astros, Castro’s former employer. Using the same methodology as with the Twins pitchers, I again calculated the cStrike% on the edges of the strike zone for the all Astros pitchers that threw more than 50 IP in 2016.  What we find is pretty telling:

Astros Total Edge cStrike%


Of the 12 Astros to throw more than 50 IP, only one, Michael Feliz, had a lower than league-average called strike rate on the edge. But even he was roughly league average at 36.06%, compared to league average of 36.11%. The rest of the pitchers studied were above league average, and in most cases, quite comfortably so. Six of them are clustered close together right around 41.0%.

Now, to be fair, not all of this is directly attributable to Castro. These are different, and arguably, better pitchers. And Castro didn’t catch every pitch thrown (he caught 61.9% of the Astros’ defensive innings in 2016). But, the difference is stark and by this rough measure, it seems Jason Castro will make a positive impact for the Twins pitchers.

To the Twins’ credit, they recognized they had a weakness, and they used the free-agent market to acquire a player they hope can help address it.


dSCORE: Pitcher Evaluation by Stuff

Confession: fantasy baseball is life.

Second confession: the chance that I actually turn out to be a sabermetrician is <1%.

That being said, driven purely by competition and a need to have a leg up on the established vets in a 20-team, hyper-deep fantasy league, I had an idea to see if I could build a set of formulas that attempted to quantify a pitcher’s “true-talent level” by the performance of each pitch in his arsenal. Along with one of my buddies in the league who happens to be (much) better at numbers than yours truly, dSCORE was born.

dSCORE (“Dominance Score”) is designed as a luck-independent analysis (similar to FIP) — showing a pitcher might be overperforming/underperforming based on the quality of the pitches he throws. It analyzes each pitch at a pitcher’s disposal using outcome metrics (K-BB%, Hard/Soft%, contact metrics, swinging strikes, weighted pitch values), with each metric weighted by importance to success. For relievers, missing bats, limiting hard contact, and one to two premium pitches are better indicators of success; starting pitchers with a better overall arsenal plus contact and baserunner management tend to have more success. We designed dSCORE as a way to make early identification of possible high-leverage relievers or closers, as well as stripping out as much luck as possible to view a pitcher from as pure a talent point of view as possible.

We’ve finalized our evaluations of MLB relievers, so I’ll be going over those below. I’ll post our findings on starting pitchers as soon as we finish up that part — but you’ll be able to see the work in process in this Google Sheets link that also shows the finalized rankings for relievers.

Top Performing RP by Arsenal, 2016
Rank Name Team dSCORE
1 Aroldis Chapman Yankees 87
2 Andrew Miller Indians 86
3 Edwin Diaz Mariners 82
4 Carl Edwards Jr. Cubs 78
5 Dellin Betances Yankees 63
6 Ken Giles Astros 63
7 Zach Britton Orioles 61
8 Danny Duffy Royals 61
9 Kenley Jansen Dodgers 61
10 Seung Hwan Oh Cardinals 58
11 Luis Avilan Dodgers 57
12 Kelvin Herrera Royals 57
13 Pedro Strop Cubs 57
14 Grant Dayton Dodgers 52
15 Kyle Barraclough Marlins 50
16 Hector Neris Phillies 49
17 Christopher Devenski Astros 48
18 Boone Logan White Sox 46
19 Matt Bush Rangers 46
20 Luke Gregerson Astros 45
21 Roberto Osuna Blue Jays 44
22 Shawn Kelley Mariners 44
22 Alex Colome Rays 44
24 Bruce Rondon Tigers 43
25 Nate Jones White Sox 43

Any reliever list that’s headed up by Chapman and Miller should be on the right track. Danny Duffy shows up, even though he spent most of the summer in the starting rotation. I guess that shows just how good he was even in a starting role!

We had built the alpha version of this algorithm right as guys like Edwin Diaz and Carl Edwards Jr. were starting to get national helium as breakout talents. Even in our alpha version, they made the top 10, which was about as much of a proof-of-concept as could be asked for. Other possible impact guys identified include Grant Dayton (#14), Matt Bush (#19), Josh Smoker (#26), Dario Alvarez (#28), Michael Feliz (#29) and Pedro Baez (#30).

Since I led with the results, here’s how we got them. For relievers, we took these stats:

Set 1: K-BB%

Set 2: Hard%, Soft%

Set 3: Contact%, O-Contact%, Z-Contact%, SwStk%

Set 4: vPitch,

Set 5: wPitch Set 6: Pitch-X and Pitch-Z (where “Pitch” includes FA, FT, SL, CU, CH, FS for all of the above)

…and threw them in a weighting blender. I’ve already touched on the fact that relievers operate on a different set of ideal success indicators than starters, so for relievers we resolved on weights of 25% for Set 1, 10% for Set 2, 25% for Set 3, 10% for Set 4, 20% for set 5 and 10% for Set 6. Sum up the final weighted values, and you get each pitcher’s dSCORE. Before we weighted each arsenal, though, we compared each metric to the league mean, and gave it a numerical value based on how it stacked up to that mean. The higher the value, the better that pitch performed.

What the algorithm rolls out is an interesting, somewhat top-heavy curve that would be nice to paste in here if I could get media to upload, but I seem to be rather poor at life, so that didn’t happen — BUT it’s on the Sum tab in the link above. Adjusting the weightings obviously skews the results and therefore introduces a touch of bias, but it also has some interesting side effects when searching for players that are heavily affected by certain outcomes (e.g. someone that misses bats but the rest of the package is iffy). One last oddity/weakness we noticed was that pitchers with multiple plus-to-elite pitches got a boost in our rating system. The reason that could be an issue is guys like Kenley Jansen, who rely on a single dominant pitch, can get buried more than they deserve.


James Paxton Primed to Dethrone King Felix as Mariners Ace

The Seattle Mariners finished second in the AL West with an 86-76 record. With a strong offense — they scored the sixth-most runs per game during 2016, led by Robinson Cano, Kyle Seager, and Nelson Cruz — the Mariners starting pitching lagged behind. With fans hoping for a bounce-back performance from Felix Hernandez, the King waned further, seeing an increase in ERA, FIP, and walk rate with decreasing number of strikeouts, first-pitch strikes, and swinging strikes. Hernandez was worth only 1 win above replacement, and at 30, it is unlikely the King will ever become the dominant pitcher he once was.

Despite logging only 121 innings, James Paxton pitched well, leading to a 3.5 fWAR, the highest among all Mariner pitchers. Paxton has always shown some upside, having strung along a 3.43 ERA and 3.32 FIP in 50 starts across four seasons. The 28-year-old has struggled to remain healthy, having only pitched 286 innings since 2013. Throughout the 2016 season, Paxton showed his best form.

Paxton averaged the highest fastball velocity for left-handed pitchers at 96.7 MPH. It was almost 3 MPH faster than the lefty ranked second, Robbie Ray. Among pitchers with 100 innings pitched, Paxton had the fifth-best FIP-, 17th-best SIERA, and 21st-best strikeout-minus-walk percentage. Furthermore, Paxton threw strikes. This was evident in his first-pitch-strike rate — 62.4% — and with the Mariners pitcher posting an elite 4.7% walk rate. Throughout the season, Paxton was unlucky, with a .347 BABIP and a strand rate hovering close to 66%. Paxton’s average exit velocity on line drives + fly balls was slightly above average. Couple that information in with a Deserved Run Average (DRA) of 3.09, and it is fair to say Paxton pitched fairly well and should have an impressive 2017 campaign.

One of the reasons for Paxton’s success? He changed his release points:

James Paxton Release Point Changes

In addition, Paxton’s cutter became one of his main pitches. Having reluctantly thrown it in years past, Paxton’s cutter was his second-most-used pitch and was quite effective. Among pitchers who threw 200 cutters, Paxton’s had the best whiffs per swing rate. Batters kept swinging, and they kept missing. It also boasted the lowest wOBA allowed in his arsenal.

James Paxton Cutter Vertical Movement

The big change in Paxton’s cutter, aside from the 1-mile increase in velocity: less rise (In 2014, Brooks Baseball classified the cutter as a slider). As the season wore on, Paxton also got more rise in his fastballs, leading to a greater induction of pop-ups. Paxton’s curveball was second in velocity among left-handed pitchers who threw at least 200. It featured an above-average ground-ball rate and swinging-strike rate.

Paxton showed significant growth during the 2016 season. With Felix Hernandez unlikely to return to his previous form, Paxton has the tools and ability to become the Mariners’ ace. The key for him will be to stay healthy in a pivotal season for both the Mariners and the 28-year-old pitcher.


The Case for No Starting Pitchers in the National League

I’ve watched many a baseball game over my lifetime (that’s 50+ years), and I’ve cringed every time I see a National League manager send his starting pitcher up to bat any time prior to the seventh inning. Especially with runners on base! Doesn’t he know that pitchers can’t hit? Doesn’t he know that if he would just pinch-hit for the lame-batting starter he’d improve his team’s chances of winning?

So, after years of pondering this problem for five seconds at a time every couple of days, I decided to see if I could build a solid quantitative case for never letting a pitcher come to the plate for a National League team (obviously this is not an issue for the American League with their designated hitters). How would this change the look of the team’s pitching staff? And more importantly, how many more games would a team expect to win in a season if they adopted a “pitchers never bat” strategy?

The answer to the first question is pretty easy. The staff would “look” different. There were would be no more “starting pitchers.” A team’s pitching staff would consist only of “relievers.” Sure, one of the “relievers” would throw the first pitch of the game and could technically be called a “starter,” but given that he’ll be taken out of the game as soon as his spot in the batting line-up comes up, he’s effectively a “reliever,” just like the other 10 or 11 guys on the staff.

Now, the conventional wisdom would say that the current starting pitchers, especially the “aces,” get in a groove, and can give you six or seven solid innings. Why would anyone take them out the game in the second or third inning? Well, let’s do a “cost-benefit” analysis and see if we can make a case for “The Pitchers Never Bat” strategy.


Key Components of the Case:

The two primary components of the analysis are 1) how many more runs would a team expect to score in a season by pinch-hitting for every pitcher, and 2) how many more runs would a team expect to give up in a season because their starting pitchers are no longer going six, seven, or more innings in an outing? Or, maybe the team adopting such a strategy would actually give up FEWER runs per year by giving up on the century-old strategy of planning for the starting pitcher to pitch deep into the game.

A third component of the analysis could include the benefit of being able to choose from any of the team’s entire staff (probably 11 or 12 pitchers) and use only the ones that look like they’ve got their “stuff” while warming up before the game, instead of sticking with the “starter” who is scheduled to pitch today because it’s his turn in the “rotation.”

A fourth component of the analysis could include the benefit a team could achieve because the other team can no longer stack their starting batting order with a lot of lefties (to face a right-handed starter), or with lot of righties (to face a left-handed starter), because the team with no “starters” will pinch-hit for their first pitcher after one, two, or three innings. So, in total, the “handedness battle” tilts slightly more in favor of the team implementing the new strategy.

A fifth component could include the cost (or benefit) of reducing the size of the pitching staff by one or two, and adding one or two more everyday players, who would be needed to pinch-hit in the early innings.

A sixth component could be an added benefit that batters will not be able to get “used to” a pitcher by seeing them multiple times in a single game. Under the new strategy batters will see each pitcher once, or, at most, twice in a game.

I’m going to focus on the two primary components above, and let the lessor components alone for now. Perhaps others can weigh in on how to quantify the potential impacts of these changes.


Component #1: How much more offense will the “Pitchers Never Bat” strategy create?

This is the easiest of the components to quantify. I will use the wOBA (weighted On Base Average) statistic as defined and measured by FanGraphs to evaluate this component. Let’s start with some basic information and rules-of-thumb.

Using data from the National League for the 2015 season I find that pinch-hitters have a wOBA of .275 across the entire league, while pitchers, when batting, had a wOBA of just .148 across the entire league. The difference in wOBA between pinch-hitters and pitchers is .127 (that’s .275 minus .148.) Note that all position players in the NL combined for an average wOBA of .318 in 2015. I’m assuming that our new pinch-hitters won’t get anywhere near that figure, but will be comparable to the 2015 pinch-hitters, who came in way lower, at .275.

Now, let’s assume we can replace every pitcher’s plate appearance (PA) with a pinch-hitter. This improvement of .127 in wOBA needs to be applied 336 times per season, because that was the average number of times that a National League team sent their pitchers up to the plate in 2015. And lastly, we need to know two rules of thumb from FanGraphs that are needed to complete the analysis of the first component: 1) every additional 20 points in wOBA is expected to result in an additional 10 runs per 600 plate appearances, and 2) every 10 additional runs a team expects to score in season translates into one additional win per year. OK – so, let’s do the math:

If 20 additional points of wOBA translates into 10 runs per 600 PA, then our new pinch-hitters who are now batting for pitchers will provide the team with 63.5 incremental runs per 600 PA (which equals 127/20 * 10.) And since these pinch-hitters will be coming to the plate 336 times, not 600 times, we need to reduce the 63.5 incremental runs per season down to 35.6 incremental runs per season (which is 336 / 600 * 63.5).

Finally, the last step is to take our 35.6 incremental runs per season and translate that into incremental wins per year using the rule-of-thumb that ten runs equates to one win. Therefore, our 35.6 extra runs results in an expected 3.6 incremental wins per year. That’s a decent-sized pick-up in expected wins.

OK, so now, what about the pitching staff? Will replacing the conventional pitching staff with a staff consisting of no starters and all relievers cause the runs allowed to increase, and if so, by how much? Enough to offset our 3.6 extra wins that we just picked up on offense?


Component #2: How many more runs will pitchers give up using the “Pitchers Never Bat” strategy?

Imagine, for the moment, that a GM is to build his pitching staff from scratch. (We’ll worry about how to transition from a conventional staff to an all-reliever staff later.) And let’s just assume he’ll pick just 11 pitchers. (Most NL teams use 12-man staffs while some use 13, so that will give the team one or two additional position players.) Currently, starting pitchers typically throw 160-200 innings per season, and relievers tend to throw 50-80 innings per season. But with the new all-reliever strategy, and using only 11 pitchers, each of our new guys will need to average around 130 innings each, with perhaps some pitching as much as 160, and some as low as 100 innings per year. So, the GM is looking for 11 guys who can each contribute 100-160 innings per season. Each outing will be for about one to three innings for each pitcher. How will they fare?

Let’s look at the National League’s pitchers for 2015. Starting pitchers had an aggregate WHIP (Walks Plus Hits per Inning Pitched) of 1.299, while relievers, in total, recorded an identical WHIP of 1.299. So my takeaway from this is that the average starter was equally as good (or bad) as the average reliever. From this, I am going to take a leap of faith, and assume that a staff of 11 new-style relievers could be expected to perform equivalently. (And that doesn’t even factor in some of the lesser elements of the new strategy, as mentioned above, such as Components 3 and 4 of the analysis.)

From this, albeit simplified, evaluation of Component #2, I estimate that a team moving to an all-reliever pitching staff will have an expected change in Runs Allowed of zero, and therefore the change will neither offset, nor supplement, the offensive benefit evaluated in Component #1.


Conclusion and Final Thoughts

In summary, using the two primary components of my analysis, I estimate that adopting a “Pitchers Never Bat” strategy in the National League (a.k.a. an “All Reliever Pitching Staff” strategy) will improve a team’s offense by an expected 36 runs per year, which will increase the team’s expected win total by 3.6 games. I estimate that the impact on runs allowed will be near zero. Some lesser elements, Components #3 through #6, could also add some additional value to the strategy.

Implementing the strategy does not necessarily need to be a complete, 100% adoption of the “pitchers never bat” rule. Modifications can be made. Perhaps a pitcher is doing well through two innings and comes to bat with two out and no one on base. In this case the manager could let the pitcher bat, so that he can stay in and pitch another two or three innings. This would change the name of the strategy to something like the “Pitchers Very, Very Rarely Bat” strategy.

As far as transitioning to an all-reliever staff from a conventional staff, it could be done over time, or only in part, such that a team could maintain, say, its two top aces, and complement them with eight or nine relievers. This way, the aces could pitch as they do now, going six-plus innings, every fifth day, while limiting the “Pitchers Never Bat” strategy to the three out of the five days when the two starters are resting.

Finally, let’s try to put a dollar value on this new strategy. The guys at FanGraphs, and other places, have tried to estimate how much teams are willing to pay for each additional win. Without going into all the various estimates and approaches at trying to answer that question, let’s just go with a simple $8 million per win. I’m sure it could be argued to be more or less, but let’s just put $8 million out there as a base case. If that’s true, a 3.6-win strategy, such as the “Pitchers Never Bat” strategy, is worth about $29 million per year. Go ahead and implement the strategy now, and, if it takes, say, three years before any of the other NL teams catch on, you’ve just picked up a cool $87 million (3 * 29 million).

And if the other components of the analysis (#3 through #6) are quantified and it can be determined that they add another 0.5 wins per year, which I think is quite doable, then we can get the total up to 4.1 wins per year, for a value of $33 million per year, or just around a cool $100 million over the first three years. And that’s how you make $100 million without really trying!


The Flame-Throwing Myth

Is pitch velocity an indicator of a good pitcher?

Over this past summer, the Twins struck a deal with the Boston Red Sox to send specialist Fernando Abad to Boston for prospect Pat Light. Light, 25, first pitched in the majors in 2016, where in two innings with the Red Sox, he had allowed 8 runs (7 earned). After the deal, he has spent the rest of the season with the Twinkies. His numbers do not look much better, with an ERA of 10.22 in 12.1 innings pitched. Over his minor-league career, he has posted a 4.35 ERA in five seasons. Why did the Twins want this guy? He was 25, fully established as a reliever, and has only dominated the minors in 2016.

One of my theories is that the Twins saw that Light is a flame-thrower. Recently, he hit 101 miles per hour on a pitch. Are the Twins fixated on his high velocity? Looking at the Twins’ bullpen, another below-average pitcher, Ryan Pressly, is also touted for his high velocity.

I am not saying definitively that the Twins are focusing on pitchers’ velocities to value prospects and players; previously I wrote about how teams have focused on batters’ exit velocities, so perhaps the Twins have tried to apply this mentality toward pitchers.

Either way, I decided to delve into this topic, seeing if a pitcher’s velocity indicates a lower ERA, FIP, and BABIP, or a higher strikeout rate and walk rate. Using MLB’s Statcast, I was able to parse their data to record a pitcher’s average velocity. Using these data, I tried to establish the skill set of a flame-thrower.

To do this, I performed linear regressions between these different factors, seeing if any of these values are highly related to or influenced by faster pitching.

First, I looked at FIP and velocity. Below are the results:

fipandvelocity

Not a strong relationship, yielding an R-squared of 0.09. This relationship does show that as velocity increases, FIP tends to decrease, but again, not a very convincing relationship.

Next, I looked at ERA and velocity:

velocitytoera

It yielded a similar result, a weak negative relationship, if any.

While the results for ERA and FIP were disappointing, I figured BABIP might look better. If a pitcher can throw faster, it would make sense that the batter would have a tougher time making contact, leading to weaker contact and a lower BABIP. Did the results agree? Have a look:

babiptovel

Disappointing. No relationship at all.

On to strikeout rate and walk rate.

I immediately thought of Aroldis Chapman. He has the fastest heater in the league, and his strikeout rate is above 40%, nearing the top of the league. I was much more optimistic for these metrics.

Here is velocity to strikeout rate:

velocitytok

Not a great relationship, yielding an r-squared of .13. It is a little stronger than anything else we have seen, but that is not saying much at all.

Finally, here is velocity and walk rate:

veloctytowalk

Not much going on here as well.

What does this all mean? Well, for starters, it shows that there are other factors that determine how effective a pitcher is. These data show that these metrics are not the end-all-be-all of a pitcher’s skill. Velocity is not a key indicator of an effective pitcher. Sure, the fastball probably needs to be upward of 85 miles an hour, but speed is not the most important factor. Rather, other skills, such as control, deception, and quality of breaking pitches might be just as important, if not more important, than velocity.

I don’t know if the Twins specifically targeted Light because of his velocity, but in his stint with the Twins, he’s averaged 10.9 walks per 9 innings. What good does his speedy fastball do if he cannot get it over the plate?

After my analysis, I’ll admit I’m a little surprised. I would think a higher velocity would mean a higher strikeout rate. But I am wrong. I guess for every flame-throwing Aroldis Chapman, there is an equally effective Andrew Miller, who does not posses the 105 mile-an-hour heater, but has a higher strikeout rate.


David Price Is About to Go Off

View post on imgur.com

On June 25, this was David Price’s tweet to family, friends and fans.  It was a clear signal that he knew the patience of the Boston fans and media was wearing thin.

Fast forward to the All-Star break and his “Made for TV” stats (those that casual fans know best) are underwhelming: a 9-6 record with a 4.34 ERA, which is worse than the MLB average of 4.23.  It’s not so much his ERA that’s the problem to fans, but more his inability to be consistent from start to start.  Price has three starts of six-plus innings allowing two or fewer runs, but also has four starts of allowing six or more runs.  With the rest of the rotation producing an atrocious 4.86 ERA, the Sox desperately needed Price to be the one to stop the bleeding, something he hasn’t been able to do.  But that doesn’t mean his underlying skills have deteriorated and all of a sudden he’s become a league-average pitcher.  In fact, the advanced metrics say he’s been extremely unlucky and that he’s due for a big second half. 

View post on imgur.com

* Rank is solely being used to establish a baseline for Price as a top 10 pitcher.

In 2014 and 2015 combined, Price was ranked in the top 10 of all pitchers in four of the skill-based statistics: K%, BB%, xFIP and SIERA (the latter two being ERA estimators with a weighting towards more pitcher-controlled outcomes).  Through the 2016 All-Star break, Price has maintained or improved his top-10 rank in K%, xFIP and SIERA but dropped a few spots in walk rate.  Despite the move from 9th to 10th in K% rank, his K rate is actually up from 26.2% to 27.1%.  The reason for the drop in rank is that 2016 newcomers to the list Jose Fernandez, Noah Syndergaard and Drew Pomeranz did not meet the minimum innings qualifier for the 2014/2015 combined list.  On the flip side, Price’s xFIP and SIERA are higher than they were the past two years, but he has improved his ranking versus his peers.  This is because xFIPs and SIERAs are both up 10% league-wide versus last year (due to all the home runs being hit) while Price’s increases are smaller.

So what is happening?  If his base skills are fine, why is his ERA so high and his performance so inconsistent?

View post on imgur.com

So everyone is familiar with ERA and can easily infer that 4.34 is no bueno for a $217-million pitcher.  But there is a reason these stats are labeled “Non Skill-Based” — that’s because these stats are influenced by factors outside of the pitcher’s direct control (defense, luck, sequencing, variance, etc…) and therefore have wide variability over small samples.  Three of these stats (HR/FB%, BABIP and LOB%) explain why David Price is a great rebound candidate for the second half.

HR/FB%

Price’s current HR/FB (home runs per fly ball) rate is 15.2% — which is good for being ranked 76th out of 97 qualified starting pitchers.  The past two years combined he ranked 19th.  To put this in context, Price’s career average is 9.4% while the 2016 league average is 12.9%.  Price has never recorded a full season (>150 IP) HR/FB rate higher than 10.5%.  Also, on balls hit into play against Price this year, 31.3% of them are fly balls, the second-lowest rate of his career.  The only season in which he allowed a lower fly ball rate was in 2012 when he won the AL Cy Young award.  Price is giving up fewer fly balls this year, but of the fly balls he is allowing, they are going over the fence at the highest rate of his career.  Those that remember Price giving up a HR in 10 consecutive starts this year are nodding violently right now.  His HR/FB% will regress towards his career norm (9.4%) and this should be the main reason for a big second half.

BABIP

Price is also suffering from an unsustainable BABIP (batting average on balls in play).  His current mark of .321 is well above his career rate (.289) and even above his highest full-season rate (.306).  Once a ball is put into play it is out of the pitcher’s control what happens from there.  This is why defense and luck influence this stat more than skill.  And with that said, statistical outliers here tend to regress towards career norms.  Even though Price is allowing ground balls at a higher rate than the past two years, his 2016 GB% is still lower than his career average.  BABIP can be influenced by the number of ground balls a pitcher allows, but he’s not allowing vastly more than his career average.  His BABIP should have some positive regression in it, which is another predictor of improved second-half performance.

LOB%

Price’s Left-On-Base% (percentage of runners a pitcher strands over the course of a season) is currently 70.9%, which is also below his career rate (74.7%) and would be his second worst full-season rate (70.0%) if the season ended today.  Similar to HR/FB%, he is ranked 73rd out of 97 qualified starting pitchers.  The past two years he ranked 22nd.  A pitcher with a higher than average strikeout rate should be able to sustain a slightly higher than average LOB%, but it’s playing out the exact opposite way for Price.  This is partly due to his inflated BABIP and HR/FB%; as these statistics continue to regress towards his career norms, the LOB% will creep up to expected levels.


Much has been made of Price’s velocity being down this year compared to any point in his career.  At the start of the season, his velocity was over 2.0 MPH lower than his career average (94.1).  He has since closed this gap almost entirely.  Here is his average fastball velocity by month (with number of starts):

April: 92.0 (5)

May: 92.5 (6)

June: 92.9 (6)

July: 94.0 (2)

If this upward trend in velocity stabilizes somewhere at or above 93.5, then nearly all the performance metrics within his control — velocity, K%, BB%, xFIP and SIERA — will be at or near his career norms.

Let’s dive a little deeper into that early-season velocity issue.  Below are two charts.  The first shows combined performance of 2014 and 2015 for ERA-qualifying starters while the second chart is the same data for the 2016 season through the All-Star break.  The orange circle is David Price.  The red circle (if shown) represents Price’s career average.  The blue circles are a hand selected peer group of the top 10 pitchers in the game (Kershaw, Sale, Arrieta, Scherzer, Bumgarner, Greinke, Strasburg, Syndergaard, Salazar and Fernandez).  Remember those rankings where Price was right around the top 10 — these are the guys usually outperforming him.  The gray circles represent everyone else.  Note: For these first two charts the top-right quadrant is Good, and the bottom-left quadrant is Bad (unless you’re a knuckleballer).

2014-2015 K/9 vs FBv

View post on imgur.com


2016 K/9 vs FBv

View post on imgur.com

The first graph shows David Price clustered where you would expect him — right at the middle-to-bottom of his top-10 peer group, with a healthy average fastball velocity and K/9.  The second graph (2016) shows Price in a similar relationship to his peers, but with slightly lower velocity and a higher K/9.  Note the gap between the orange (Price’s 2016) and red (Price’s career average) dots depicting his improved strikeout numbers this year despite the slightly lower velocity.  This graph also shows what freaks Noah Syndergaard, Jose Fernandez and (to a lesser degree) Jered Weaver are.

The final two graphs show the relationship between ERA and xFIP where xFIP is the more predictive estimator of a pitcher’s skill.  The bottom-left quadrant is Good (think Kershaw) and the upper-right quadrant is Bad (think Buchholz).  Anyone in the upper-left quadrant (Price in 2016) is a candidate for positive regression.

2014-2015 ERA vs xFIP

View post on imgur.com


2016 ERA vs xFIP

View post on imgur.com

The first graph again shows Price in his usual place — at the tail end of the top 10.  In 2014 and 2015 combined he had a very similar ERA (2.88) and xFIP (2.98).  The second graph (2016) shows the disparity between his ERA (4.34) and xFIP (3.16).  Pitchers with this large of a gap between ERA and xFIP are great candidates for regression.  The important takeaway is that his xFIP, relative to his peers, has stayed in that top-10 range.  This supports the point that some bad luck is the main element depressing his ERA.

David Price can easily be the best pitcher in the American League over the next two and a half months.  He already owns the lowest xFIP in the AL at 3.16 — the next-closest is Corey Kluber, at 3.34.  The skills above show he can sustain the xFIP level, but with some change in luck and maintaining his improved velocity, he doesn’t need to “pitch better”; he just needs to keep pitching — and the results will follow.


Tyler Wilson and His Five Plus Pitches

Let me preface this article by saying that I watch A LOT of baseball.  I also have an extensive analytical background and am always analyzing baseball stats looking for value in players.  Last week, I was watching an Orioles game and the starting pitcher was a player I have never heard of.  His name is Tyler Wilson.  While watching the game, I was very impressed with his overall make-up and the confidence he displayed in each one of his pitches.  Many times what separates a pitcher from being able to start at the big-league level versus being destined for the bullpen is the ability to throw multiple pitches.  The ability to throw each of those pitches effectively, however, can be what separates a good starting pitcher from a great starting pitcher.  The more I watched of Wilson, the more intrigued I became about his future outlook, and the more motivated I became to write this article.  (I went back and watched all of Wilson’s starts this year before writing this article.)

To give you a little background, Tyler Wilson has never been an elite prospect.  He attended college at the University of Virginia, where he was overlooked by fellow staff-mate, and future 1st round pick, Danny Hultzen.  Wilson was drafted by the Orioles in the 10th round of the 2011 MLB Draft.  Ever since being drafted, he has quietly excelled at every level.  He doesn’t have the dominant strikeout numbers that you look for in pitching prospects, which is a big reason he has gone overlooked for much of his career.

After climbing his way through the organizational ladder, Wilson made his major league debut with the Orioles last year and eventually made the team this year out of spring training.  Although he made the team in a bullpen role, early season injuries to the Orioles pitching staff opened up an opportunity and Wilson has really taken advantage of it.  Enough of the background though.  Let’s move on to what I saw while actually watching him pitch.

Tyler Wilson features a cutter and a two-seam fastball.  Each of these pitches sit in the 89-91 mph range and both show a great amount of movement.  The cutter is most effective against right-handed batters when thrown on the outside portion of the plate.  Check out the video below to watch him fool Kansas City Royals outfielder Lorenzo Cain with three straight cutters:

He essentially gave Cain, a very good hitter, three of the exact same pitches in a row…and Cain couldn’t touch them.  In every start this year, Wilson has pounded the outside corner with this cutter and has had fantastic results.  Don’t think by any means though that he is a one trick pony.  As soon as you start to expect that cutter on the outside corner, Wilson will come right back in on you with a two-seam fastball:

Look at the horizontal movement on that pitch!  Absolutely filthy!  Wilson has showed a ton of confidence in both of those pitches so far this season as he uses them to pound both sides of the strike zone and his command of them has been exceptional.  He is not afraid to throw them in any count and they are equally effective vs both left-handed and right-handed batters.

While his fastballs both seemed to be plus pitches upon first glance, I started to have thoughts that this guy might be for real as soon as he started throwing his curveball.  Wilson’s breaking ball sits in the 77-79 mph range.  I was astonished by how well he was able to locate his curve and the amount of movement on each and every one he threw.  Watch him send White Sox slugger Jose Abreu down swinging in the video below:

Abreu had no chance.  In his most recent start against the Twins, Wilson’s curve looked even better.  Check out the one he threw to Byung-Ho Park:

Both of those pitches came in a 2-2 count.  Many pitchers are scared to throw a breaking ball in a 2-2 count, especially to players with plus power such as Abreu and Park.  If you miss your target, two things can happen.  One — you leave the ball up in the zone and it gets hit out of the stadium.  Two — you throw it in the dirt; the hitter lays off; and now you have to pitch to this slugger with a full count.  Wilson isn’t scared to throw his curveball in any count and that is what makes him so dangerous.  You never know when to expect it, but at the same time you have to expect that he can throw it at any moment.

The last pitch in Wilson’s arsenal is his changeup.  This pitch has a ton of downward movement and produces a lot of groundballs.  While there were many better examples that I could have shown you of his change-up in action, I wanted to show one of his bad ones.  Even when he missed his target, the batter was still fooled by the amount of movement on this pitch.  Check out the following pitch to Royals SS Alcides Escobar:

The catcher set up down in the zone and Wilson clearly misses his target.  Luckily it didn’t seem to matter as the pitch had an insane amount of horizontal movement, running in on Escobar and jamming him.

Take a look at the chart below, showing the vertical and horizontal movement on each of Wilson’s pitches:

Tyler Wilson Movement

The middle portion of this chart is empty.  All five of his pitches have a tremendous amount of movement, and none of them move in the same direction.  The fact that he is able to command each of these pitches so well and keep hitters guessing with which one will come next is the reason why he has had so much success.  A big reason why hitters are having trouble guessing his pitches is because of how well Wilson is able to repeat his delivery.  The chart below shows Wilson’s release point for each type of pitch:

Tyler Wilson Release Point
As you can see, his release point is almost identical with all five of his pitches.  At this point, I have watched all of his starts from this season and was very impressed.   I then decided to do some research and was immediately impressed with stats such as his career BB rate and low WHIP, but wanted to dig further.  I began to look through the PITCHf/x data because I was curious to see how effective each of his pitches actually were.  Based on the PITCHf/x value metric, all of his pitches so far this year have graded as above average.  If you are not familiar with the PITCHf/x value scale, someone who has a fastball ranking of zero means that he possesses an average fastball.  Any value above zero means that pitch is above average.  Obviously the higher the number, the better the pitch.  The same goes for negative numbers and pitches being below average.  See the table below for the breakdown of Wilson’s arsenal:

Screen Shot 2016-05-15 at 1.19.17 AM

Based on the above values, the change-up has been Wilson’s most valuable pitch this season with his curveball close behind.  Obviously it is very early in the season and we are working with a small sample size…but that doesn’t mean we can’t have fun!  While doing this research, I set out the goal to find every starting pitcher who throws five or more above-average pitches.  Below is the list of players who fit that description:

Screen Shot 2016-05-15 at 1.41.09 AM
IP = Innings Pitched
FA = Fastball
FT = Two-Seam Fastball
FC = Cut Fastball
SI = Sinker
SL = Slider
CU = Curveball
CH = Change-up
KC = Knuckle Curveball
EP = Eephus

There are only five pitchers who have thrown five or more pitches above average so far this season!  Wilson is in great company, as the other four pitchers are all All-Star-caliber players and borderline household names.  Being that this is such a small sample size, I decided to look back at last year’s stats to see how many players fit this description over a full season.  Using the same parameters and setting the minimum IP to 100, the following table was produced:

Screen Shot 2016-05-15 at 2.05.17 AM

Once again, the names on this list are some of the top pitchers in baseball.  A few of these pitchers have a pitch that graded out as below average, but since they had five or more different pitches all individually grade as above average, they made the final cut.

As you can see, it is very rare to have a pitcher who has five legitimate plus pitches.  I am very interested to see if Tyler Wilson can maintain these results over the course of a full season, and I really hope he is given the opportunity to do so.  If he continues to pitch the way he has been, the Orioles will have no choice but to leave him in the rotation.  Although he has had limited success, Wilson has struggled in each of his starts when facing the lineup the third time around.  This could be due to the fact that he is still in the process of being stretched out from his bullpen role.  When in the bullpen, you don’t have to prepare to face the same hitter three times.  I am hopeful that once he is fully stretched out and back into his starter mentality, he will be able to make the necessary adjustments and continue to throw all of his pitches with confidence.  If he can continue to make quality pitches as he faces the lineup for a third time, I believe Tyler Wilson has the chance to become a very special pitcher.

Memorable quotes I heard during the TV broadcasts:

“Everyone thinks that I pitch with a chip on my shoulder but I really don’t.  I just go out and compete.  I don’t think of it that way.” – Tyler Wilson

“I think he understands himself.  He can maintain his game-plan throughout the game.  He’s going to keep us in the game and give us a chance to win.  What more can you ask for?” – Pitching Coach Dave Wallace

“I love that he can make the ball run in and then cut away.  He pitches to both sides of the plate.  Not a lot of young pitchers can do that.” – Manager Buck Showalter

…no Buck, not a lot of young pitchers can do that.

Twitter – @mtamburri922


What Is Wrong With Adam Wainwright?

Adam Wainwright is the star of the St. Louis Cardinals pitching staff and one of the best aces in the majors. The righty has 121 wins, a 3.04 career ERA, 1,335 strikeouts and four top-three Cy Young finishes under his belt. In 2015 he started as expected, cruising. In four starts he managed to post a 1.44 ERA and a 2.05 FIP in 25 innings with 18 strikeouts and just one walk, with eight extra-base hits (35% of the hits allowed). When everything was looking promising for another dominant season, he suffered a ruptured Achilles tendon during a plate appearance against the Milwaukee Brewers on April 25th. This injury sent him to the disabled list until late September where he just got the chance to pitch another three innings.

Before the start of this season his name was part of lots of baseball discussions: Which Adam Wainwright should we expect? The ace? Or will he show declining signs due to the long ride on the DL, his 34 years and 500+ innings in the last two seasons? The numbers speak by themselves: A 7.25 ERA, 4.87 FIP in 22.1 innings with just nine strikeouts and 10 walks, with 13 extra-base hits (45% of the hits allowed). A complete disaster if we compare this start with last April.

Those facts led us to the question: What is wrong with Adam Wainwright? Using the data sample of April 2015 and 2016 we will try to figure out the reasons behind this horrible start of the season and what should be the changes that could help Waino get back on track.

Pitch velocity and movement

The first reason that jumped to my mind was that he may be having trouble with the speed of the fastball or break of his nasty curveball. I went to Brook Baseball to check this values and compare April’15 with April’16.

Picture

​Using the four starts of last year, Waino’s fast pitches were the four-seamer, the sinker and the cutter, averaging 90.3 MPH, 90.4 MPH and 86.4 MPH respectively. Contrary to my first hypothesis, the speed chart on 2016’s April did not show any significant variance averaging 90.8 MPH, 90.3 MPH and 87.1 MPH. If anything, he is throwing faster. What about the breaking stuff? During 2015 the nasty curveball and the changeup average were 75.4 MPH and 83.7 MPH, values that are really similar to what we have seen this year: 75.4 MPH and 83.5 MPH.

We can conclude with this data that the speed is not an issue, but what do the numbers say about the ball’s movement? All his pitches were showing very similar vertical and horizontal movement compared to last year data and the career normal of Adam Wainwright. These means that the first hypothesis has to be dismissed, the power on his fast pitches and the break on the slow ones is still there.

Location and control

Other potential cause of the bad start of the season could be the location of Adam’s pitches and his control of them. A good way to visually understand the location of his pitches is using a heat map over the K-Zone. The darker the color, the biggest the frequency. To generate the great graphs that you can see below I used the PITCHf/x tool from Baseball Savant, posting side-by-side the career, 2015 and 2016 values.

Picture

The heat maps really help to get quick answers. Let’s start with the four-seamer. We can clearly see that during this season the dark cluster is located up in the zone. Compared to his career profile Wainwright is locating the fastball higher than his typical zone, something that is not a good sign for a pitcher that only throws it at 90 MPH and depends so much on control to minimize damage.

Picture

The case of the cutter is similar: low control of the pitch. 2016 graph shows a problem locating this pitch in the strike zone. The career profile indicates that he likes to throw this pitch down and outside for RHB and down and in for LHB, something that have been difficult this season when the cutter is also falling higher that normal.

Picture

Picture

In the case of the sinker I split the heat maps between lefties and righties since this specific pitch is used very differently by Waino depending on the batter handedness. Against lefties the heat maps show that he is following his typical profile, so there should not be a problem.  Meanwhile against righties Wainwright has been having troubles locating this pitch outside in the zone as he is used to. This year, lot of the sinkers against righties has been located in the center of the plate many times, low in the zone, but still in an area that MLB batters can crush easily.

Picture

Exactly the same thing happens when we see the curveball graphs. Career data showed that he has been really successful hitting the low part of the strike zone, especially last year when this pitch was falling in the ideal place, just below the K-zone frame. But this year the story have changed. The curveballs has been located higher than ever, in the hitter power zone.

There is no doubt that Wainwright in this season is having a hard time controlling his pitches, especially falling up in the zone with the fast ones and right in the middle with the breaking ones. He is showing significant differences with his career profile that could be a direct cause of the bad start of 2016.

Pitch mix

The speed and break are still there. The location not so much. So what about the approach to the at-bats? Is it similar or has he changed it due to the lack of control of his pitches? Let’s try to answer this question using data of his pitch mix and the results of balls in play comparing Wainwright’s career profile with the 2016 sample data.

As you can see in the table below, two things needs to be addressed: First, this season he largely ditched his sinker (-9%) in favor of more cutters (+8%) and curves (+4%). Second, the ground balls have dropped dramatically (-10%), leading to an increase in fly balls (+9%) and line drives (+1%). Why such a change in Waino’s approach to the plate?

Picture

There are quick conclusions. The sinker is an excellent groundball pitch, so obviously if you use less sinkers, you get less groundballs. But as we saw in the previous section of the article, Wainwright is having tons of problems with the location of his sinker: the majority of this pitches stay on the hitter-friendly zone, resulting in an increase of the line-drive percentage (+17%) and a .500 batting average on balls in play.

As if it were not enough with the sinker issues, the high location of his four-seamer is causing 18% more fly balls and 24% less ground balls. This critical situation left just one option of the fast-pitch arsenal of Wainwright: the cutter. As his last resource he increased the use of it 8% and some results have been good. It’s the only one that has an increase in ground-ball percentage (+4%) and a drop in fly-ball percentage (-12%). Nevertheless the resulting average of balls in play is .400, so please don’t take this as a silver bullet. Remember that we also pointed out previously that the control on the cutter has not been the best.

The other pitch that has been favored this season is the curveball. Although the rate of whiffs has dropped from a career average of 17% to only 9% and the fly balls (+11%) have increased significantly, the opponents only average .118 against the curve. This is really impressive especially after we analyzed the bad location of this pitch, but he keeps using it since it is the only pitch that is giving good results.

Conclusion

Even with a small sample of 2016 data we can derive some conclusions: The arm power and the movement on Adam Wainwright’s five pitches is still there. The long rest due the injury, the 500+ innings from 2013 to 2015 and his 34 years do not seem to be a problem right now. The problem seems to be in the location of his pitches. The four-seamer high in the zone and the sinker in the middle of the plate have been destroyed by the batters, reducing the ground balls in a dramatic way and increasing the line drives and fly balls.

Wainwright is clearly trying to make adjustments in order to reduce the damage. For now his nasty curve is saving the day being his only effective pitch even when it has been located in a dangerous zone. The cutter is not helping enough so his focus should be in taking back the control of the location of the pitches. In his last outing he showed some positive signs. Let’s see what happens in the next one against Arizona — if we get more of the ace or if he still struggles to get back to track.