The Dave Cameron Rules: A Manager’s Guide

A few days ago Dave Cameron published a post outlining some wild new rules for an alternative baseball. I missed it at the time, since I am on holiday in Sweden, but one Wi-Fi hotspot later, I was walking the streets of Stockholm thinking about the Dave Cameron Rules.

This post will make no sense to you unless you read the idea for “Daveball”, so go do that now. In it he asked a number of questions about what managers would do. This is my reply.

Overall Season Strategy

If every current game is divided by 3, the season schedule will be 486 games long. Playoff teams will lose 200 contests a year. The dramatically lower stakes make it easier to deliberately lose games.

Suppose you are facing Jose Fernandez. He will start Game 1 and probably continue to Game 2. Your own available pitchers are a mixed bag, so you save the best ones until the game(s) after Fernandez departs. As with bunts, every manager will need to calculate the risk and reward of trading unlikely wins for increased odds in another.

I also see a need for a new rule restricting roster moves to one time per day. (Not one move; one time.) This closes a new loophole wherein teams can call up a player for one three-inning game only. Not many teams have minor leaguers nearby to do this, but Texas, for example, could have an AA player report to Arlington instead of Frisco, call him up for Game 2, and have a spent pitcher hide in the clubhouse being “demoted”. This would give an unfair advantage to the few teams for whom this possibility exists.

Pitching

I see options for a manager under these rules. Broadly speaking, there are three. The first is only modest changes to status quo, such as bringing high quality relievers in at the sixth inning as well as the ninth.

The second option is to convert current mediocre starters into one-game pitchers. Consider the Washington Nationals, who have four pitchers capable of throwing two games in a day, and five pitchers, either borderline starters or long relievers, who could pitch one game a day well (Tanner Roark, Ross Detwiler, Taylor Jordan, Craig Stammen, Blake Treinen). Especially if you believe the weakness of a borderline starter is getting through a lineup the second time, they can suddenly become very valuable.

Here’s how to do it. (Listen up, Astros.) Convert a few of your guys and trade for some more. You could have around seven or even eight of these starters, plus relievers for the other innings and for getting out of trouble. The shorter starts will make these pitchers more effective. Today’s market for mediocre one-inning relief will transform into high demand for mediocre five-inning guys who can pitch effectively for three.

The third option is extreme: all short-outing guys, all the time. Every day, every pitcher only goes four or five outs. This would lengthen the games considerably, but on the other hand, fans could see a barrage of 98 mph high heat.

The major change to mound strategy will be an increased reliance on strikeouts and the near death of the intentional walk. I will explain this shortly.

Batting

Dave Cameron already pointed out several key changes to batting strategy: put all the best hitters at the top of the order, and pinch-hit early and often. (The pinch-hitter would actually function like a movable DH.) Sometimes it will be advantageous to work counts, but sometimes the short games will call for aggressiveness. Either way, the run-scoring environment will be very different. With a sudden surplus of decent pitching, and probably a slight increase in average velocity, batting will become harder.

Scoring, however, could be easier.

Baserunning

Under Dave Cameron’s rules, Billy Hamilton would become the most valuable player in baseball.

Here’s how it works. The logic of pinch-hitting for weak defenders, then returning them to the next game, applies to pinch-runners, too. If your slugger draws a walk, put in Billy Hamilton. Every time.

Let’s assume your team is fairly good, and has at least one baserunner in 95% of games. Billy Hamilton has scored about 62% of the time he reaches base, with an 83% steal success rate. To compare, Mike Trout has scored about 42% of the time he reaches. There are other factors at work, but I’m on holiday, so ignore them. Hamilton should be running for any player, if the situation demands it, but for sale of argument (and of me writing this on a phone) assume that in 95% of 486 games, Billy Hamilton increases your odds of scoring by 20%. That’s 92 additional runs per year, and not over replacement level, either. Suddenly an elite runner becomes the most valuable weapon in the game.

Three factors could limit the damage. First, managers could be dumb or unlucky and use runners at the wrong times. Second, defenses could invent some kind of wild new “no steals defense”. I have no idea what this would look like, but teams would be forced to try.

Finally, every team will acquire their own super-runner. (Currently a running-only player is a waste of bench space, but the opportunity to use him or her three times per game without penalty would change the math.) Oakland would call up Billy Burns. Some teams would sign actual Olympic sprinters, train them in fundamentals like pitch recognition and sliding safely, and set them loose. (This is how we would acquire the first female player.) If Usain Bolt breaks for second base, a catcher will throw to third to limit the damage.

More than anything else, the runners will change baseball. Intentional walks will never be used with one or zero men on base. Unintentional walks will force wild pitchers out of the league. Strikeouts will be a priority as the third-inning hitting strategy is simply to get on first base.

Fielding

I couldn’t think of much here, except for almost universal use of the no-doubles defense (especially once the enemy has used his runner). Probably shifts would be more common.

Conclusion

Dave Cameron’s rules would accelerate some trends we already see in baseball: more strikeouts, more speed, more reliance on defense. But it would also inspire madness, like nine-man starting rotations comprised of suddenly valuable borderline starting pitchers, and female sprinters charging toward home plate on squeeze plays. The game would be unrecognizable and loony, but also a lot of fun. And Billy Hamilton would punch a ticket to the Hall of Fame.


Run, Don’t Walk, to Buy Pedro Alvarez Stock

At first glance, it looks like Pedro Alvarez is doing exactly what we thought he would this year. He’s hit 8 long balls and is sporting a Mendozian .210 average, which somehow falls below his pre-season expectations of being in the .230 range. Most fantasy baseball outlets are sounding alarms and wondering aloud how much longer owners can live with his team killing average. In reality though, Pedro is producing a familiar stat line but is getting there in a very different way and mostly through bad luck.

It still feels early in the season but there are already some stats that have stabilized and are now significant for evaluating how players are performing. For when statistics stabilize I’m using this terrific post from 2011 (http://www.fangraphs.com/blogs/525600-minutes-how-do-you-measure-a-player-in-a-year/) which is definitely worth a read on its own. The cliff notes needed for this article are that when statistics stabilize, they start to tell us more about a hitter’s current season than league averages do. Statistics regress to the mean but when a statistic stabilizes we equally weight an individual’s performance with the league average when creating future projections.

Pedro is at the 150 plate appearances plateau and three key statistics have already stabilized and are now telling us more about his performance this year than league averages or his career stats, they are swing percentage (swing%), contact rate (contact%), and strikeout rate (K%).

2014 Pedro is swinging at 44.4% of pitches. This is down from swinging at 50% of pitches last year and is close to being a career low (in his call up season his swing% was 43.7%). This doesn’t tell us all that much by itself. You can get yourself in bad counts by watching strikes go by just as much as you can by swinging at balls. But, Pedro is making contact with 73% of pitches, four points above his career 69.3% average and almost a full 7% higher than last season. A hitter’s swing% first stabilizes at 50 PAs and contact% stabilizes at about 70-75 PAs, and this shows Pedro turning into a more patient and more selective hitter. He’s actually swinging less often than the league average and while the league average contact rate is 79% this year, Pedro has much more power than your average hitter.

The third stat I want to look at is the big one, strikeout rate. In each of Pedro’s first four seasons in the majors he has posted a K% north of 30%. The league average K% ranged from 18.5% to 19.9% during that time, so Pedro really excelled at striking out. Pedro’s K% through 150 PAs this season is only 21% though. Now it just stabilized, so there will probably be some regression towards his career norm but this is 9% lower than his career rate and is only .4% higher than the league average this year. I’m expecting this to regress, at least somewhat, because a 9% drop in K% is too good to be true but Pedro has definitely improved in this area and even regressing to a 25% or 26% strikeout rate would be a significant improvement.

All of these stats might look good but Pedro is still batting an abysmal .210, what’s up with that. The biggest culprit is his .209 BABIP. BABIP doesn’t every stabilize, if Pedro’s reverted to his career average (.292) he’d have a batting average of .267, if it reverted to last year’s rate (.276) he’d be batting .256. Home runs are BABIP-proof, there’s nobody to field them, and Pedro’s is off to a great start with 8 already. More of the non-homers are going to start falling for hits and barring injury, Pedro looks to be good for 35+ HRs and closer to a .250 average. Every fantasy team can use that guy. So before his bad luck starts to end, run out and buy low on Pedro.


Ottoneu Tools: Advanced League Standings

Ottoneu Tools: Advanced Standings (Part One)

Whether you’re brand new to Ottoneu or a “seasoned” veteran in your fourth year, your league’s Standings page is likely to become your best (or worst) friend over the course of a given baseball season. However, if you often find yourself cheering or panicking based on just a few days’ worth of small but evolving linear weights data without the proper, broader context with which to make meaningful decisions about your team, you are not alone. Welcome to the Ottoneu “Advanced Standings” dashboard. The brainchild and early creation of Bill Porter (@wfporter1972), the Advanced Standings dashboard will provide you with the sabermetric performance data you want with the detail you need.

How It Works:

Before you get started you will need to download the current version of the Advanced Standings dashboard here (http://goo.gl/Tozhy4). Note: You will need the most up to date version of Excel to take full advantage of the dashboard features. Also, this Advanced Standings dashboard only works with FGPoints Ottoneu format leagues (for now).

While it may look overwhelming at first, the dashboard is designed to be easy to use. In fact, it’s designed to be updated quickly and often without requiring a lot of Excelmanship. With as little as two easy steps you will be able to see “inside” your league standings in a way not available on the website.

First, go to your league’s traditional STANDINGS page within Ottoneu. From the bottom right of the standings stats (begin just to the right of the last P/IP on the right hand bottom corner), highlight all standings data with your cursor (including team names). Do not export the standings to Excel. Also, do not highlight the headings bar that includes the column titles (AB, H, 2B, etc.). COPY this information and then go to the first tab (“Advanced Standings”) of the Excel dashboard. In cell A4 (1st team name in column), PASTE SPECIAL and select TEXT. When pasted, your league’s standings will populate this tab and you will have visibility of many advanced statistics tailored exactly to your league.

Second, to have more accurate league standings information, go to your league’s REPORT page within Ottoneu and at the bottom of the page highlight all the information (excluding the column headings) in the “Projected Games Played and Innings Pitched” section. Once selected, COPY this information (including team names), and PASTE SPECIAL – TEXT this data into Tab 2 (“Reports”) of the dashboard spreadsheet, in cell A2.

Yeah, it’s that easy.

In Part Two I will revisit some of the key features of the Advanced Standings Dashboard and how it can be best used to analyze your league  You can also learn how to go much deeper into these advanced standings from reading Bill’s recent post on this subject here (http://goo.gl/XkDzXV). Until then, enjoy playing with the dashboard tool. If you have questions or want access to some additional Ottoneu tools, feel free to DM me on Twitter @Fazeorange and I will send you a link to the Ottoneu Dropbox folder.

Enjoy


Beating the Shift (& Physics)

After reading some questions in Dave’s chat today (May 7), and in response to never-ending questioning from un-informed commentators across baseball, I wanted to provide what I think is a very simple explanation for why groundballs are so often pulled. Here goes:

In terms of the direction a ball travels after hitting a bat, there are three factors:

  1. Vertical contact point on the barrel – below the sweetspot of the barrel is a groundball, above the sweetspot is more of a flyball
  2. Horizontal plane at contact – is the bat pointed directly perpendicular to the angle of the pitch and batter’s body, is the batter’s swing out in front, or is he behind?
  3. Vertical plane at contact – is the bat plane directly parallel to the ground, pointing slightly up towards the sky, or pointing slightly down towards the ground?

To start, let’s fix two of the three factors above and leave the third factor as the variable. Let’s assume that since we’re talking about groundballs, factor 1 will be set so that the contact point is slightly below the sweetspot of the barrel, resulting in a groundball. Let’s also set factor 2 and assume the batter squares up the pitch, so that in the horizontal plane his bat makes contact with the ball when it is directly perpendicular to his body. And now let’s focus on factor 3, the vertical plane.

In practice, the vertical plane is already set. Batters (almost*) always make contact with their hands above the head of the bat, so that it is vertically pointing downwards. So given that we’ve set factor 1 to be below the sweetspot on the bat and factor 2 to be square horizontally, we know that the groundball WILL be pulled. Why? Let’s look at it at the extreme to illustrate the point.

Visualize the vertical plane being taken to its extreme, so that the bat is pointing directly downwards. Now, since we’ve set the other two factors in place, we know that the ball will make contact with the bat slightly towards the batters side (which would be below the sweetspot were the bat at a more normal vertical angle). Which way will the ball deflect? Always towards the pull side, and it may actually hit the batter. Now clearly, this is an exaggerated example, because a batter wouldn’t make contact with a ball while his bat is completely vertical. However, the same physics apply when the bat is pointed only slightly downwards vertically, just to a lesser degree. So the point that we’ve established is that there is a structural, physics-based reason that groundballs tend to be pulled, because the bat is (almost*) always pointed slightly downwards at contact.

With that established, let’s take a step back to factor 2. This is the factor which most heavily influences whether or not the groundball will actually be pulled. If the batter is late or behind on the pitch, than in the horizontal plane (factor 2) the bat will be pointed more backwards toward the catcher than if it were exactly perpendicular. In this case, the ball would be pushed the opposite way. On the opposite end of that spectrum, if the batter is early on the pitch and his bat is pointing more forwards towards the pitcher than backwards towards the catcher, the groundball will be pulled more extremely.

So how early or late the batter is on the pitch is clearly an important determinant in whether the groundball will be pulled, pushed, or hit right back at the mound. But remember what we’ve already established – there is a natural tendency for groundballs to be pulled because of factor 3. So if a batter is to take a groundball the opposite way, he must not only be late on the pitch (factor 2), but he must be late enough to overcome the natural pulling force caused by factor 3.  And the more his bat is pointed downwards, the larger that natural pulling force is. The lower and more inside the pitch is, the more the bat will likely be pointed downwards, meaning that the batter must be that much later on the pitch to push it the opposite way.

I’m sure a lot of you will read this and say “duh”, because it is all pretty intuitive and this is FanGraphs after all. But for those of you who have just learned something, any time you ask why a batter can’t just push his groundball away from the shift, remember that he’s having to overcome the natural laws of physics, and, per Dave at 12:58 this afternoon, “it’s not easy to do.”

* All analyses exclude the superhuman skills of Evan Gattis


A Smarter Alternative to Signing Max Scherzer

Max Scherzer has gotten off to a great start in his defense of the 2013 Cy Young Award, but after rejecting a likely substantial contract extension a month ago every time he walks out to the hill is perhaps one less time fans have to see him pitch in a Tigers uniform. It seems more and more likely with each passing day that Mike Illitch, Dave Dombrowski and Co. will not extend Scherzer and will instead let  him test free agency.

After inking Miguel Cabrera to an eight-year extension worth $240 million through 2023 earlier this month, it would seem foolish for the Tigers ownership to try and squeeze another enormous contract onto the roster. If Scherzer were to hit free agency we could expect his contract to fall somewhere around Cole Hamels’ $144 million or Zack Greinke’s $147 million deal, somewhere around $24 million/year. Scherzer could get more, depending on the strength of other free-agent pitchers, amount of years a team wants to give him, and how much Scott Boras whines. That would mean Detroit is committing close to $75 million for three players, a burden for any team. Could there be an alternative, from the Tigers’ perspective, to signing another pitcher about to hit his 30’s to a $24+ million deal?

We know the Detroit organization has been in win-now-at-all-costs mode for years, but they just finished an off-season in which they made a very real effort to get younger and more flexible. We’ve seen a number of teams, the Braves and Rays among them, extend their young players to relatively team friendly deals a few years before they hit free agency. It just so happens that the Tigers have two perfect extension candidates on their roster.

Austin Jackson is perhaps one of the more underrated players in the Major Leagues. He’s been an above average center fielder by both DRS and UZR, an above-average base runner, has slashed .279/.345/.420 in his career good for a .336 wOBA, and been worth 15.0 WAR in just over four seasons with Detroit. He’s in his age-27 season and by all looks is just entering his prime years. Currently, Jackson is playing on a $6 million dollar deal and is due to hit free agency in 2016. If Detroit’s ownership believes he’ll continue to improve his plate discipline — Jackson struck out in 21% of his plate appearances last year although his .77 BB/K ratio is a significant improvement over the .28 mark he put up in his rookie year — and his power (.140 career ISO), then they should seriously think about locking him up sooner rather than later. If new manager Brad Ausmus continues to be more aggressive on the base paths with this team than his predecessor, Jackson could have the 20/20 season a lot of fans were hoping for, which would send his price through the roof if he’s left to test free agency.

When you remember Rick Porcello was a first-round pick in 2007 and the hype around him was such that he was expected to be Justin Verlander 2.0 in the Tigers rotation it’s hard not to be a little disappointed with the outcome of his career so far. When you also remember that he only pitched 125 innings in the low minors, came up at age 20, and has seen his ERA and FIP improve yearly as well as a surge in his strikeout rate and a decline in his walk rate it’s easy to see how he could eventually reach his mid-rotation ceiling. Porcello is still only 25 years old, playing on an $8.5 million deal and, like Jackson, is a free agent after the 2015 season.

An extension for Porcello would give the Tigers a rotation of Justin Verlander, Anibal Sanchez, Porcello, and Drew Smyly for at least three years after 2014. Jackson contributes a middle of the order bat along with premium defense in center field. If Scherzer were to sign with another team, the Tigers could extend both players for at most a few million over what Scherzer would make per year and that would be made up by the $14 million coming off the books from the Torii Hunter contract who is unlikely to re-sign. Instead of committing $75 million to three players, Detroit can commit that to two superstars, two above-average players with the potential to put up some star seasons in their prime, and perhaps another outfielder to cover for Hunter. If the Tigers are really committed to roster and payroll flexibility they will let the reigning Cy Young winner walk and lock up two young talented players entering the prime years of their career.


Would Charlie Root Really have Beaned Babe Ruth?

I’m speaking about one instance in general, the famous or infamous alleged “called shot” by Babe Ruth at Game 3 of the 1932 World Series.

Stimulated by ESPN Chicago NOT calling that the No. 1 moment in Wrigley Field’s 100-year history (more on that later), I got curious.

The “called shot” game from the 1932 World Series has the mythos of whether or not Ruth did point at center field while at bat in the fifth inning, after making some sort of gesture before that, it seems, at Cubs pitcher Charlie Root (sic, per Baseball-Reference, Wikipedia and elsewhere; FanGraphs’ “Charley” is much less attested) after he got 2 strikes on him.

To me, this is the No. 1 event not just because of gray-area questions about what Ruth did and did not do, but also from Root’s vociferous denial that Ruth was calling anything, claiming he would have beaned him if he was.

Really? Let’s first look at quotes from the Wikipedia link above on the “called shot.”

  • “Don’t let anybody tell you differently. Babe definitely pointed.” — Cubs public address announcer Pat Pieper (As public address announcer Pieper sat next to the wall separating the field from the stands, between home plate and third base. In 1966 he spoke with the Chicago Tribune “In the Wake of the News” sports columnist David Condon: “Pat remembers sitting on the third base side and hearing [Cubs’ pitcher] Guy Bush chide Ruth, who had taken two strikes. According to Pat, Ruth told Bush: ‘That’s strike two, all right. But watch this.’ ‘Then Ruth pointed to center field, and hit his homer,’ Pat continues. ‘You bet your life Babe Ruth called it.'”)
  • “My dad took me to see the World Series, and we were sitting behind third base, not too far back…. Ruth did point to the center-field scoreboard. And he did hit the ball out of the park after he pointed with his bat. So it really happened.” Associate Justice John Paul Stevens, United States Supreme Court
  • “What do you think of the nerve of that big monkey. Imagine the guy calling his shot and getting away with it.” – Lou Gehrig
  • The Commissioner of Baseball, Kenesaw Mountain Landis, attended the game with his young nephew, and both had a clear view of the action at home plate. Landis himself never commented on whether he believed Ruth called the shot, but his nephew believes that Ruth did not call it
  • Washington Post legendary columnist Shirley Povich, detailed in an interview with Hall of Fame catcher Bill Dickey. “Ruth was just mad about that quick pitch, Dickey explained. He was pointing at Root, not at the centerfield stands. He called him a couple of names and said, “Don’t do that to me anymore, you blankety-blank.”

So, hard to say, but it adds to the mystique, right? And, of the collected quotes, three say he called the shot, and the others are kind of ambivalent.

So, can we explore further?

Relatively recently discovered footage leans more toward the idea of Ruth pointing his bat at the Cubs dugout, Wikipedia claims. That said, even that and him reportedly holding two fingers up to Root, or pointing at him, would have been something halfway like saying “here it comes.” In other words, short of Ruth pointing to the centerfield scoreboard, Root arguably had reason to bean him anyway. Beyond the above, Ruth had already homered off him earlier in the game.

And speaking of …

Let’s look at Baseball-Reference’s play index for that game, to further question Root’s claim.

First, the game was tied 4-4 entering the top of the fifth. Root wouldn’t want to jeopardize that lead. And, beaning Ruth with 1 out would have brought up Lou Gehrig who, like Ruth, had already hit one homer in the game and by this point was a more dangerous batter than Ruth.

So, especially with two strikes on Ruth, from quick-pitching or whatever, no Root wouldn’t have beaned him. He would have tried to strike him out. Beaning him with a two-strike count to know he would face Gehrig next in a tie game would have been stupid. Root needed the out. The Cubs needed the win. A strikeout of Ruth would have given the bench-jockeying Cubs dugout more ammunition, too.

In actuality, Root didn’t and couldn’t strike out Ruth. Gehrig then hit another homer too, at which point Root got yanked.

So, Root may be right, but I kind of doubted it. He had reasons for his statement, of course. Root’s not a HOFer, but he is arguably a member of the Hall of Very Good, winning more than 200 games and posting nearly 40 career WAR. And he’d like to be remembered for that rather than for getting shown up, getting “faced,” by Babe Ruth. Who wouldn’t?

Beyond that, as I talk about in more detail at my blog, about the history of Wrigley, besides the “called shot” dethroning the Bartman game from the top spot, I’m not even sure I’d rank that game at No. 2 on Wrigley’s Top 100. That’s in large part because I’m not a Cubs fan, I know.


It’s Time to Lower the Mound…Again

We have seen an incredibly high number of Tommy John (TJ)[1] surgeries undergone already this season. The surgery is on pace to surpass any single-season total in history. This signifies that an unusually high number of pitchers have already gone under the knife and it is still just the first month of the season. Even with so many talented pitchers being sidelined for a season because of TJ, we have also seen league-wide offense falloff quite a bit. There are many reasons for each of these trends, and also many potential solutions, but I feel that the best solution to each problem is to lower the pitcher’s mound. I do not believe pitchers should pitch from a flat surface, which is even with the batter’s level. However, I do believe the mound should be lowered to just 6 inches above the plate. It may seem extreme or irrational, but it has been done before and it would help both issues that professional baseball is facing. One obstacle to finding a way to slow or prevent TJ is the procedure’s high success rate. It is also a difficult problem to solve because it is unclear what causes the injury and when exactly the injury begins. Nevertheless, these should not prevent the MLB from attempting to limit the growing number of pitchers requiring TJ surgery, especially when it can also increase the league’s offensive production.

24 pitchers have needed TJ surgery already in 2014, which has yet to complete its first month of regular season games. For reference, 28 pitchers received the procedure in all of 2013, and only 7 had undergone the surgery at this point last year. It is not surprising to see an increase upon last year’s total, as 2013 was actually a decrease upon 2012’s total of 55 TJ’s for pitchers. However, even in 2012, there were only 15 TJ surgeries by this point in the season. The procedure has been widespread in baseball for some time now, and it has saved many careers, which has made finding a solution unnecessary. Even with the surgery’s outstanding success rate, the time has come for the MLB to step in to protect its players.

Among the many factors that have influenced the increase in TJ surgeries of late is the procedure’s success rate. One study, completed in 2013, found that 83% of pitchers to undergo TJ return to the Majors and 97% return to pitch, at least in the Minor Leagues.[2] This success rate would not necessarily impact players that have a completely torn Ulnar Collateral Ligament (UCL), as they would have no other options to return to the mound, but it may influence pitchers with a partial tear of the UCL. In the past, many of these pitchers would turn to rehab instead of undergoing TJ. Adam Wainwright is a great example of this, as he rehabbed from a partial tear of his UCL, before undergoing TJ surgery 6 years later when he completely tore his ligament. However, because of the success of the procedure, there is little motive to attempt a rehab that may not work, and only delay the surgery, which pushes back the return date. As the Cardinals former team physician and orthopedic surgeon, George Paletta, said, “It’s become an accepted side effect of the job”.[3]

Another reason that is often cited is pitchers are initially beginning to injure their arms in youth baseball. High School pitchers are often pitching in showcases or in front of scouts, which puts extra pressure on them to throw as hard as they can and often pitch even when their arm in not entirely recovered from their previous outing. This was not the case as recently as 15 years ago, as High School showcases did not become common until the early 2000’s. This is one of the early waves of young pitchers that are reaching the Majors after going through the showcase process. From now on, the most, if not all, of the pitchers that reach the Majors will have been through this rigorous process.

Another issue facing young pitchers is that many of them are pitching in competitive games nearly year-round. Overuse is one of the many reasons pitchers experience arm injuries and pitching throughout the year has greatly increased the amount of use on pitcher’s arms. Once, many high school baseball players played multiple sports and were able to take time off from throwing; however, many pitchers now throw year-round without many breaks from throwing. Youth pitchers are also putting more stress than before on their arms because they are throwing harder than ever. This may seem to be a good thing, and it is for performance, but it puts extra stress on their ligament that is not fully developed. Dr. James Andrews says that High School pitchers throwing between 80-85 mph are in particular risk of arm injuries because they are putting too much stress on a ligament that has not developed enough. As Lindsay Berra explains, a pitcher does not rupture his UCL on one pitch:

Strasburg was probably in trouble from the get-go. He didn’t rupture his UCL on one pitch with the Nationals — even if a pitcher feels a pop on a particular pitch, his UCL was anything but pristine before the incident. Like a rope, Strasburg’s UCL probably started to fray the moment he began pitching off a mound, the extra height of which can compound the stress of each pitch. It likely got worse not only because of his mechanics. Kids who throw the hardest pitch the most: they get hitters out.[4]

While it is clear that TJ procedures are increasing, the exact cause of TJ is not clear, as many factors impact whether people require TJ. However, it is evident that pitching off a mound increases the stress put on the pitcher’s arm. Comparing just the number of TJ procedures for pitchers and for position players, it is clear there is a substantial difference. Since the first TJ surgery in 1974, 622 pitchers have undergone the procedure, while only 41 position players have received the surgery. There are more differences than merely the mound, but none of them account for such a large discrepancy between the two types of players.

Another common comparison for anecdotal evidence is pitchers compared to quarterbacks in football. According to a study in 2010, there had been 10 reported instances of NFL quarterbacks with damage to their UCLs, yet only one of these players underwent surgery. The other nine quarterbacks chose to use therapy to repair their injury and their mean number of days until their return was 26.4 days.[5] As with the differences between pitchers and position players, there are numerous differences between quarterbacks and pitchers. However, these differences do not account for such a significant gap between both UCL injuries and TJ surgeries.

Both of these examples contain too many confounding variables to draw any significant conclusions. However, a study completed in 2008 examined the effects that the 10-inch mound has on a pitcher’s mechanics and the stress that it puts on the pitcher’s arm in comparison to a mound at 8 inches, 6 inches and flat ground. The study, led by William Raasch, selected 20 from MLB organizations and Milwaukee-area NCAA Division-1 pitchers. The study found that pitchers throwing from a 10-inch mound compared to pitchers throwing from flat ground experienced extra stress on both their pitching shoulder and elbow.[6] They found that the greatest difference was at foot strike, as the mound changes the timing of the foot strike compared to the position of the pitcher’s arm. This study found that pitchers definitely experience more stress on their arm when throwing from an elevated surface than from a flat surface.

While the majority of this post has been dedicated to the effects the mound has on a pitcher’s health, lowering the mound will also improve the offensive production in the MLB. Of course, when the mound was first lowered to 10 inches in 1969, it was done in order to improve offense. After “The Year of the Pitcher” in 1968, the MLB saw the average runs scored per game increase by .65 in just one season. It is clear that lowering the mound had a significant impact on the league’s offensive output. Once again, we are in need of the mound to be lowered in order to improve the league’s offense. With better pitchers, defensive shifts and, most significantly, more stringent testing for Performance Enhancing Drugs (PEDs), we have seen a sharp drop off in offensive performance.  In 2013, the MLB R/G (4.17) was the lowest it has been since 1992 (4.12). This is not just a single-season aberration, as it has been experiencing a steady decline since 2006, when it was at 4.86. HR/G are also down quite significantly since 2006, when it was 1.11, and were just .96 in 2013. Easily the largest difference between 2006 and 2013 is the increase in strikeouts per game, as they have skyrocketed from 6.52 to 7.55 in 2013. By lowering the mounds, the MLB will be able to improve upon these numbers and return offense back into baseball.

Lowering the mound may seem to be a radical step to solve two things that some people may not seem like problems; however, it is the best of the few options the MLB has. While some will argue that this will not limit TJ procedures because many pitchers are already damaged goods by the time they reach the Majors, this is a change that will soon reach the NCAA, High School and youth baseball leagues if the MLB does it. This will have a profound impact on the number of TJ procedures once these pitchers reach the Majors, as they will have reduced the stress on their arm over a long period of time. The impact will not be immediate in the MLB, but when the next wave of young, talented pitchers reaches the Majors, there will be fewer TJ procedures.

The immediate impact will come from the increase in offensive production, as the lower mound will take away some of the advantage from the pitchers. As I have mentioned above, there are not many appealing alternatives. The most common solutions to the low offensive numbers is to juice the baseballs, similar to what Japan did this past season. While this would certainly improve offensive production and be less costly than changing the mounds, it would not help decrease the number of TJ procedures. A bit more radical of an alternative, that I do not believe could ever happen, is the MLB allowing the use of PEDs. While this would likely increase offense, it would almost force players to take PEDs or else they would be at a disadvantage to the rest of the players that do take PEDs. It is not fair to put athletes in this position, especially when we know how detrimental steroids can be to a person’s health.

Another option is to add a DH to the National League, which has been discussed and is quite possible. However, this also fails to help pitchers avoid TJ. Also, in 2013, the NL averaged just 4.00 R/G compared to the AL’s average of 4.33 R/G. Assuming the NL’s production would match the AL’s, the addition of the DH would add just 802 runs to an MLB season. When the MLB first lowered the mound in 1969, the league scored 2,527 more runs than the previous season and that was with only 24 total teams. By lowering the mounds again, the increase in offensive production would substantially increase beyond where it would with the addition of a DH in the NL. Among these options, I believe the best is to lower the mound to 6 inches above home plate.

The number of TJ surgeries continues to rise and it is time to make an attempt to limit this procedure. The best way to do this is to lower the height of the mounds in the MLB, as this will decrease the stress that pitchers suffer when they pitch. Once the MLB does this, all other levels of baseball will follow suit, just as they did in 1969. The purpose this time; however, will be two-fold, as the lower mound will also serve to take away some of the pitcher’s advantage, and therefore, improve the MLB’s offensive numbers. Knowing what we know about the mound’s impact on a pitcher’s mechanics and the extra stress that it exerts on the pitcher’s arm, we cannot idly watch as more and more pitchers suffer through a year of rehab from a surgery that can be limited.


[1] http://www.baseballheatmaps.com/disabled-list-data/

[2] http://www.newsday.com/sports/baseball/study-shows-pitchers-who-get-tommy-john-surgery-almost-all-pitch-again-1.7621000

[3] http://espn.go.com/mlb/story/_/id/7712916/tommy-john-surgery-keeps-pitchers-game-address-underlying-biomechanical-flaw-espn-magazine

[4] http://espn.go.com/mlb/story/_/id/7712916/tommy-john-surgery-keeps-pitchers-game-address-underlying-biomechanical-flaw-espn-magazine

[5] http://www.ncbi.nlm.nih.gov/pubmed/20609599

[6] http://www.sciencedaily.com/releases/2008/03/080323210203.htm


The Fielding Edge: Why Pujols is No Cabrera

When Miguel Cabrera signed his big new contract with Detroit earlier this year, the response of this blogger and many other fans was — No! Specifically, the seeming albatross of Albert Pujols’ contract, and somewhat lesser ones of Prince Fielder and Ryan Howard, were cited as warning signs.

However, Pujols’ injury-hastened offseason, with extra rest, seems to have put a bit of a new spring in his step through taking the fasciitis out. His quick start en route to passing the 500-homer mark would seem to be good evidence of that. Even if a start this hot doesn’t hold, if he finishes the year at somewhere between his 2011 and 2012 levels, it’s a major turnaround and one the Angels will gladly take.

Fielding has been known to set Pujols at least somewhat apart from the other three. But, how much? More than one might expect. Indeed, Pujols overall might come off better than one might expect.

Here’s a check of all four, on total zone runs and ultimate zone rating per 150 defensive games.

Pujols: 96/6.2

Cabrera: -7/-2.0

Fielder: -38/-5.5

Howard: 14/-3.4 (really)

All numbers are for first base only for each player. Howard’s numbers make me raise my eyebrows a bit. They also make me think that we still haven’t “nailed down” defensive sabermetric calculations as tightly as offensive ones. Not just this, but differences between FanGraphs and Baseball-Reference make me say that.

But, before I go down that road, I’ll present one other first baseman’s figures. He’s a bit older, so we don’t have UZR or UZR/150 numbers for him, just total zone runs. You’ve “probably” heard his name among defensive first basemen a few times. I present Keith Hernandez.

Hernandez: 121

And so, Albert Pujols’ fielding neighborhood looks a lot better than one might think.

So, let’s go to Baseball-Reference next. Here, I’ll have all games, not just at 1B, included, for two stats over there: fielding runs and dWAR.

Again, the differences are notable.

Pujols: 134/1.9

Cabrera: -77/-12.0

Fielder: -93/-17.8

Howard: -46/-12.4.

A couple of notes. With B-R, Howard falls a lot closer to Cabrera and Fielder. On both, the idea mentioned by some bloggers and sportswriters, that teams and managers would have to some day worry about Fielder losing his range, is shown to be wrong. He never had it to lose, claims about his prowess at first aside.

Let’s also see what B-R tells us about the Merry Mex.

Hernandez: 117/0.6

Whoa; Pujols actually ranks better than him. Really?

Yes. Another statistic has further proof.

Hernandez was famed for his ability to start 3-6-3 double plays. B-R says he initiated 127 ground ball DPs of all types.

Guess what? Pujols is close behind with 121. After he recently turned his first one this season, I decided, just out of curiosity, to check these numbers.

The others? Not even close. Howard has about 80 fewer and Fielder about 75 fewer. Cabrera, with much less time at 1B, is more than 80 such double plays behind Hernandez.

This is about more than illustrating Pujols’ individual value as a fielder. It’s about team issues.

Cabrera could well be moved to DHing more than 1B already next year, if the Tigers don’t resign Victor Martinez. Fielder, instead of Mitch Moreland, should already be the Rangers’ primary DH. Howard is in the National League, and with a GM who still believes he has a serious shot at the postseason, which is preventing him from being traded into the  AL.

But, Pujols, still playing league average or a touch above at 1B, and likely to do so for a few more years, gives the Angels and Mike Scioscia more flexibility on making out lineup cards. For more details about all this, visit my blog post, please.


The Unlikeliest Way to Score from First Base

You, being an internet-reading baseball fan who even occasionally ventures into FanGraphs’s Community Research articles, have almost certainly heard of Enos Slaughter, and not just because of his multiple appearances in crosswords. You also may know that he is probably best-known for his Mad Dash, in which he raced home from first base in a World Series game on what was charitably ruled a double, but what many observers believe should have been ruled a single[citation needed]. Scoring from first on a single — I bet that’s pretty rare, right? After all, one such case of it got its own Wikipedia page!

Well, according to Retrosheet, a runner scored from first on a single 16 times last year (not counting plays on which an error was charged). It’s already happened at least once this year. So if we’re talking about unlikely ways to score from first base, this doesn’t really qualify as “rare.”

You know what is rare? This is rare.

Read the rest of this entry »


All Hail the New Bunt King?

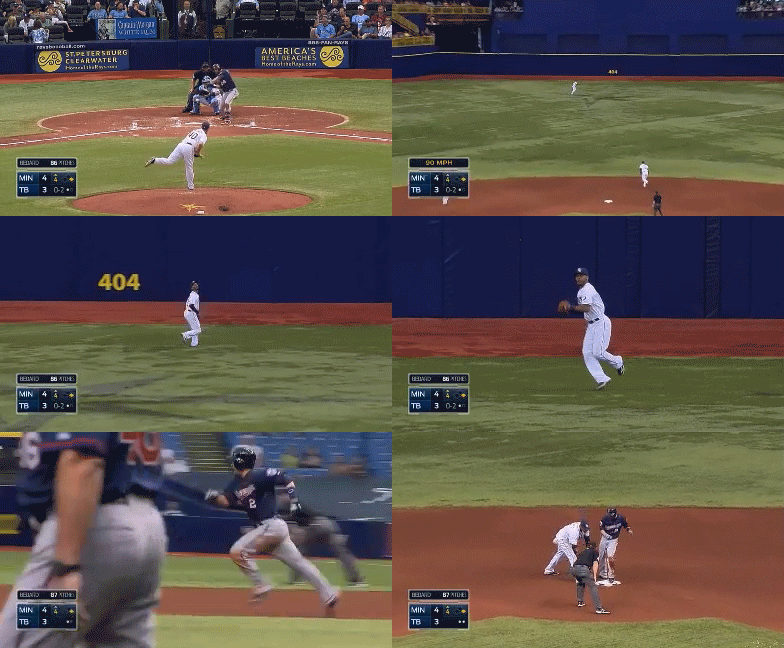
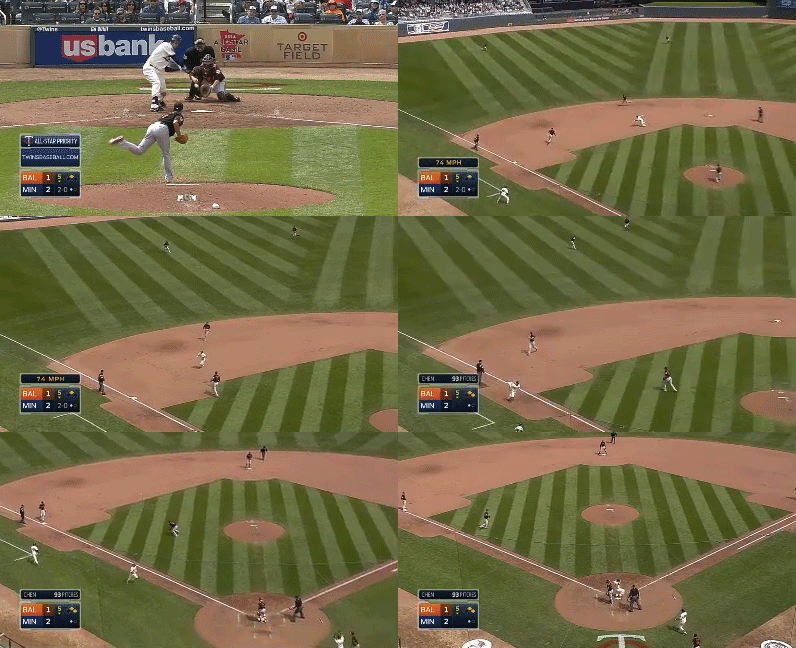
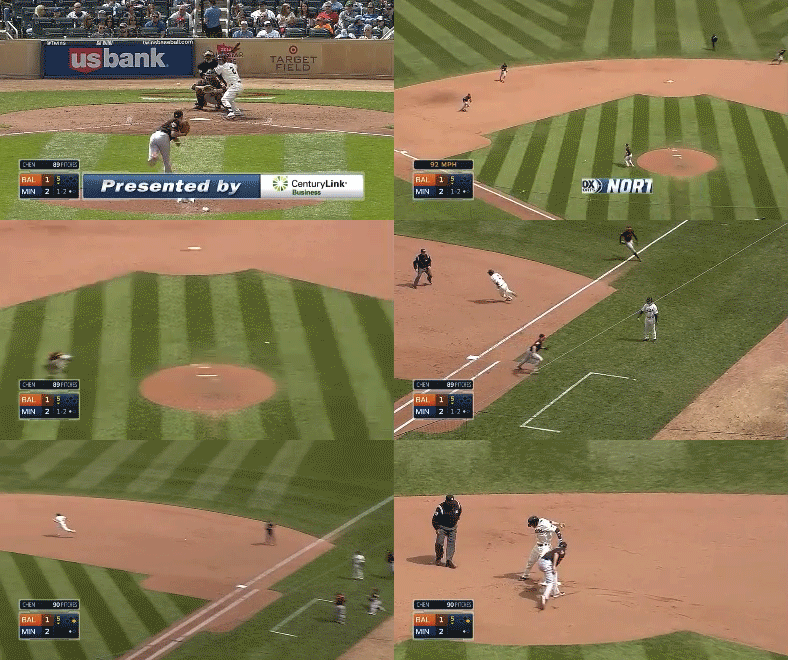
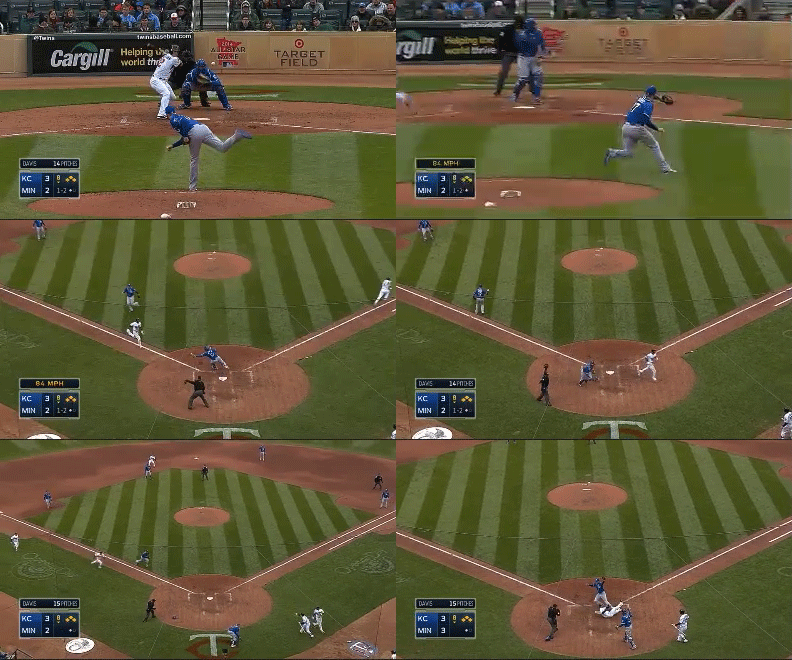
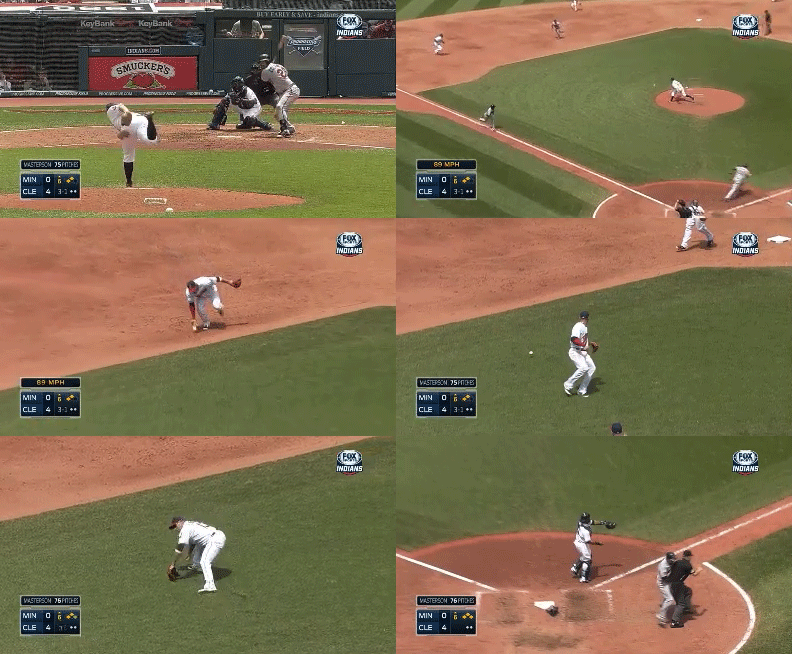
On April 24, Danny Espinosa had a remarkable game. He bunted for a hit and had a solo home run to the left-field corner. The bunt was the remarkable part.

Danny Espinosa has seven (7) bunt hits so far in 2014. That’s more bunt hits than 28 MLB teams, in a tie for first place with the Marlins and Danny’s D.C. teammates. In fact, Espinosa’s bunts account for 35% of his total hits (7/20), and he’s only failed once.

This is so unprecedented that a better word would be “outrageous”. In 2013, Leonys Martin led the MLB in bunt hits with just 12. And Martin only succeeded 40% of the time that he tried getting on base with the bunt. I had to go back to 2011 to find a guy who pulled off the base-on-bunts 20+ times in a season: Juan Pierre attempted 62 and succeeded with 23.

Only one qualified hitter in recent (batted-ball data) history has done anything even slightly similar to what Espinosa is doing so far. Fully 20% of Willy Taveras‘ career hits were bunts; he succeeded nearly half (46%) of the time, racking up a total of 130 bunt hits, including 38 in the year 2007, which is the single-season record, even though he only played in 97 games (!!). Only Juan Pierre has more bunt hits in the batted-ball-data era, but he’s much less successful on a percentage basis.

There are many reasons to think Espinosa won’t follow in their footsteps. For one thing, he’s a very different hitter: not a powerless center fielder who relies solely on speed, but a homer-happy middle infielder with a dangerous strikeout tendency.

In fact, therein might lie an explanation. Last year, Danny Espinosa hit rock-bottom, plagued both by injuries and the stupid belief that he could play through his injuries. His collapse was uglier than Ron Burgundy’s, and he put up a .280 OBP in the minors. Now he’s on the comeback trail. The power is back. The strikeouts are back. The batted-ball profile in general is back to pre-2013 numbers.

With one big exception: the bunts.

I believe this is deliberate. Espinosa is trying to get on base, he’s trying to cure a predilection for infield pop-ups, he’s trying to re-establish himself against major-league pitching, and he’s trying to re-establish himself in a lineup where he’s currently filling in for an injury. He likes unorthodox approaches to reaching base, leading the NL in hit-by-pitches in 2011.

Given Jeff Sullivan’s recent series of posts about bunts, bunting is a tougher skill than we’d think. Danny Espinosa was always good at bunts. (Maybe we can convince Jeff to make GIFs of all seven bunt hits so far.) In 2011 and 2012 his bunt hit attempts succeeded about 43% of the time, nearly as good as Willy Taveras. He chipped in a few sacrifices, though not too many. He might commit to this stratagem until teams start expecting the bunt every time he steps in.

If Danny Espinosa wants to set records, the records are there for him to take. If he succeeds on even half his attempts, that’s a season record. If he succeeds 32 more times, that’s a season record. You’d be crazy to believe he will break those records. But you’d have been crazy to believe, a month ago, that he would have even had a chance.