Archive for Strategy

Second Half Fly Ball Escalators – Part 1

The fly-ball revolution is upon us.  We all know this; it’s been happening since the second half of 2015 and has continued through 2017.  This doesn’t seem to be a fluke or blip on the radar.  Until MLB changes the ball or does something to shift favor to the pitchers, fly balls aren’t going away.  The ratings are up and there’s a great young crop of major league players who play with a ton of passion and they are embracing this revolution.

First, let’s start with the parameters I set for this statistical analysis.  It’s easier to see which hitters change their approach year to year but I wanted to focus on players who have increased their fly balls in the 2nd half of 2017.  I split the data between the 1st half and the 2nd half of 2017 with a minimum of 200 PA in each half.  I was only going to include hitters who increased their fly-ball rates by 4% of more between the 1st half and 2nd half but it would have excluded Byron Buxton (2.4% increase) and Giancarlo Stanton (3.4%).  I want to talk about both of them, so I went a little lenient to include those two.

Now that I have my crop of fly-ball escalators, I also included Infield Fly%, BABIP, HR/FB, and Hard Hit%.  I wanted to see the increase in fly balls affected these statistics and see whether of not they make sense or if luck played a role (I mean, it’s baseball, luck is always involved).  Keep in mind, not everyone is benefiting from hitting more fly balls.  Here’s the table of players I believe should benefit in 2018 with the increase fly balls if their approach remains the same, via Google Docs.

Eugenio Suarez

Suarez had a nice little breakout year in 2017 with a wRC+ of 117.  In the 2nd half of 2017 he significantly increased his FB% while decreasing his IFFB%.  That’s huge because of course infield fly balls are essentially an automatic out.  He did all that while increasing his LD% and hard hit%!  This to me looks like a conscious change for Suarez coming into 2018.  His overall numbers look pretty good in 2017 with a triple slash of .260/.367/.434 with 26 HRs (career high), and he’ll be entering his age-26 season.  All that being said, I think there’s still upside there.  Here is his slash for the 2nd half of 2017: .268/.378/.490 with a wRC+ of 126!  For reference, here are few players with similar wRC+ in 2017: Gary Sanchez (130), Nolan Arenado (129), Domingo Santana (126), and Chris Taylor! (126) (more on him later), and Brian Dozier (124).  You get the idea.  But can Suarez do it for a full season?  If he does, we are looking at a 30-100 player in 2018 hitting 4th or 5th behind Joey Votto and Adam Duvall.  In my opinion, he’s a better hitter than Duvall and should be slotted behind Votto.

Of this group of 2nd half fly-ball surgers, Suarez is one of the more intriguing for fantasy purposes.  Suarez is and has been the starting 3rd baseman for the Reds, but he’s also one of only two players on the roster who have logged significant time at SS within the last three seasons (the other being Jose Peraza) now that Zack Cozart is gone.  Nick Senzel, who finished the season in AAA, is knocking on the door and 3rd base is his main position, but they are giving him reps at 2nd (which should tell you they like Suarez at 3rd).  This creates a logjam at 2nd with Scooter Gennett but still doesn’t solve the shallow SS position.  Maybe the Reds address it or maybe Suarez plays some shortstop and on those days, Senzel moves to 3rd.  If this happens and Suarez gains SS eligibility, he could be at top 8-10 shortstop right behind Corey Seager.

Manuel Margot

Coming into 2017, Margot was a consensus top 50 prospect and was ranked 24th overall by Baseball America.  Eric Longenhagen of FanGraphs graded him at a 70 speed score out of a possible 80. So far, it checks out per Baseball Savant, as he ranks 8th in average sprint speed in all of baseball.  Something else you may notice on Margot’s FanGraphs page is the potential for a 55 raw power grade.  You can’t totally ignore the 40 game power grade, but these are the types of guys who have proved to benefit the most from the “juiced ball.”  Keep in mind that Margot played all of 2017 at age 22.  This kid is still learning the game and developing power.

That being said, his batted-ball profile leaves a lot to be desired.  He made a lot of soft contact and, of course, not a whole lot of hard contact.  However, based on the 1st half / 2nd half splits, he made adjustments with not only more fly balls and line drives but harder contact.  That’s a good sign, but yet his BABIP dropped in the 2nd half.  Sure, a speedster like Margot can benefit from weakly-hit ground balls (part of the reason Billy Hamilton doesn’t hit below the Mendoza line), but the increase in line drives should have certainly increased his BABIP.  The point is, even with the slight improvement in wRC+ between the 1st and 2nd halves, he was still unlucky.

I expect Margot to continue to make improvements with the bat in 2018.  I don’t expect him to reach the 55 raw power grade, but he’s moving in the right direction.  I also expect him to improve on the bases and utilize his speed a little more while he’s still at his peak (as far as speed in concerned).  There’s an intriguing window with young players who possess speed and untapped raw power where the speed is still at (or near) its peak and the raw power begins to materialize.  Margot will be approaching that window in 2018 at age 23, so you need to jump in now before he’s fully reached that window and becomes a premier power/speed threat that is so rare in fantasy baseball these days.  Jump in now while his ADP is around 200 and you could be rewarded with around 15-18 HRs and 20+ steals in 2018.  His upside could be somewhere around Mookie Betts’ 2017 without the runs and RBI numbers.  Will he ever reach those heights?  I can’t say for sure, but it’s intriguing.  In keeper/dynasty leagues, he’s a great asset to have at his current value.

Logan Forsythe

Forsythe was hampered by injuries in 2017; he broke his toe in April of 2017 and only appeared in 119 games.  In those games he had 439 PA, and hit .224 with six HRs and three steals.  Woof.  Why is he a thing for fantasy baseball in 2018 at age 31?  Well, first the Dodgers traded Jose De Leon to the Rays for him last off-season and exercised his option for 2018. With Utley now gone, second base is his to keep or lose.  So playing time is there unless they sign another 2nd baseman this off-season.  On the plus side, he walked at a career high 15.7% clip and had some big at-bats in the post-season, carrying at least some momentum into 2018.

You would expect Forsythe’s numbers to improve in the second half due to the toe injury in April, and the numbers in the 2nd half look awfully good.  Yes, his line drive rate did drop by 2.8%, but the net positive on FB% + LD% is 12.6% and his hard-hit rate increased by 10.9% in the 2nd half!  That massive BABIP drop of 0.082 seems way out of whack to me.  That’s the reason he hit .201 in the 2nd half.  Now, I’m not saying he’s going to go nuts, but he also cut his SwStr% to 6.6% and his O-Swing% to a career-low 18.7%.  So there are a lot of potential positives with Forsythe in both the average and power departments, based on my research.  I expect the K% to go back down to about 20%, the BABIP to go up about .020 points, and the HR/FB% to be back in the double digits.  His value is going to depend on playing time.  If he platoons, he’s an NL-only bat.  If he doesn’t and gets, say, 550 PA, he could go something like .258/.339 with 14 HRs and seven steals, becoming a solid deep-league MI.

Jacoby Ellsbury

Over the last year or so I had left Jacoby Ellsbury for dead until this research piece.  All of his batted-ball data in the second half of 2017 point to improved results. While his 2nd half 107 wRC+ was an improvement on his 95 wRC+ in the 1st half, I’d argue he was extremely unlucky and it should have been much higher.

Let’s look at the positives: his K% dropped, BB% went up, FB% went up, IFFB% went down, and hard hit% went up.  So then why did his BABIP, HR/FB, and BA (albeit minimally) all go down?  I don’t know.  How’s that for an answer?  In my opinion, it can be chalked up to straight-up bad luck.

Since the Yankees are clearly moving in another direction, Ellsbury may not have a starting spot with Judge, Gardner, and now Hicks listed as starters, with Clint Frazier ready to be a full-time major-league starter when healthy.  The best chance for Ellsbury is to be traded where he can start.  Of course with his huge contract, that could prove to be difficult.  Hypothetically, though, if it happens, he’s good for 20+ steals; he was 22-for-25 last year so his speed is still there, and steals are becoming more and more infrequent.  For fantasy in 2018, he could be a solid 4th or 5th outfielder, going .270 and 10-20 next year.


The Problem With the Shift

The concept of “the shift” has become more widely used throughout major-league baseball. While some teams shift more than most, others are shifted against more than most. The Shift Era is still relatively new as teams dive deeper and deeper into the analytical realm to increase winning percentage. However, is using the shift actually effective?

I believe that there are certainly situations where the shift should be utilized. Players such as David Ortiz, Albert Pujols, Brian McCann, etc. generally are the style of players to shift against. Older players generally rely more on pulling the ball because they are able to generate more power. These styles of pull-only hitters are usually prime targets for shifting against. My question is, why haven’t these players adapted their swing against the shift?

When learning swing mechanics, you’re taught to square up the baseball and drive the ball where it’s pitched. When shifting, pitchers are forced to make very selective pitches to avoid batters driving the ball the other way through the shift. This is hard for pitchers because it takes away some of their effectiveness. Hitters are beginning to find ways to beat the shift and steal easy hits. If a batter is in a shift situation, they can essentially eliminate pitches towards the outside half of the plate. Knowing the pitcher’s pitch arsenal, the batter can then be selective in his approach. Depending on the count, the batter can determine the next pitch, whether it’s offspeed or a fastball. Obviously a tailing fastball in on the hands is hard not to roll over into the shift, but that’s just good pitching.

Batters are finally beginning to grasp that they can beat the shift by simply putting down a bunt down the line. Or, they can create longer bat lag from their hands letting the ball travel deeper in the zone and taking the ball to the opposite field. The best hitters in baseball are those who can hit to all areas of the field. Charlie Blackmon was shifted against 121 times this year; he hit .412 against the shift. Why in the world would teams shift against him 121 times? Kris Bryant was shifted against 210 times; he hit .364. Players like this who are able to adapt their swing progressions at the plate should not be shifted against this often. Teams are simply giving them easy hits, which lead to runs. The whole point of the shift is to avoid baserunners, right?

Again, there are some batters against whom shifting works. Brian McCann was shifted against 248 times and still hit .243 against the shift, which is still pretty good considering it’s towards the bottom of the league. Lucas Duda was shifted against 241 times, hitting .243; still not terrible. Again, there are situations you can get away with shifting. The only time teams should shift should be with no runners on, strict pull hitters, and with a pitcher who’s comfortable with pitching inside.

When teams shift with runners on, I believe it’s a terrible strategy. It’s considerably difficult turning a routine double play with players out of their positions. Also, it’s difficult to catch runners stealing when you have a third baseman trying to find the bag and make the tag. Players like Dustin Pedroia have taken advantage of teams using the shift with runners on to take the extra base with the third baseman out of position. Players are beginning to find holes in the shift and are taking advantage, leading to runs.

When shifting, I believe the best option is to leave the shortstop between 2nd and 3rd, the second baseman shaded up the middle towards the bag, and the third baseman moving into right field between 1st and 2nd. With the third baseman in this position, he can create the same angle to 1st as when he’s at 3rd. This way players are in more comfortable standard positions, keeping the double play a more viable option. Shifting works in certain situations, but teams need to be more careful as hitters begin to adapt their approaches and steal easy hits, using the shift against the enemy.


Cody Bellinger’s Ability to Be Great

Cody Bellinger was called up by the Dodgers to the big leagues on April 25th of this year. Coming in at only 21 years of age, Bellinger was looking to make a name for himself. Toward the beginning of the season he would split starts between left field and first base. Eventually Adrian Gonzalez would go down to injury, giving Bellinger the opportunity of being an everyday first baseman. Bellinger rose to the occasion, cementing himself in the history books, as he will be the National League Rookie of the Year. Not only will he achieve this award, but he helped bring his team to the World Series. Before Bellinger’s arrival to the team, the Dodgers were 9 for their first 20 games. The Dodgers would go on to win 104 of their 162 games.

During the course of the season, Bellinger put up incredible numbers. He played in 132 games throughout the year, driving in 97 runs, scoring 87 times, and belting an astonishing 39 home runs, finishing only behind the powerful Giancarlo Stanton (with 59). Bellinger had a respectable .267 batting average while maintaining a .352 on-base percentage and .581 slugging percentage. He was a force at the plate, putting fear into the eyes of many pitchers. Although he didn’t walk so much — only 11.7% of the time — he still managed to have a wOBA of .380, staying in the top 30 for the MLB. On average, he would draw a walk for about every two strikeouts; not the best, but still better than most players belting over 30 homers. His plate discipline was above average for power hitters throughout the season, but come postseason, this would all change.

Throughout much of the postseason, most people were reflecting on Aaron Judge’s struggles, after having himself a historic season at the plate. Judge would break the record for strikeouts in a postseason until Bellinger would then beat this unfavorable record with 29. Through Bellinger’s 15 postseason games, he would belt three home runs, driving in nine runs and scoring 10 times while walking only three times. Most of these statistics happened during the NLDS and NLCS. His wOBA would fall to .295, with a .219 batting average, walking 4.5% of the time, while striking out in an astounding 43.3% of his plate appearances. In fact, in the World Series alone, he would achieve 17 of his 29 strikeouts. Bellinger would struggle immensely at the plate throughout the World Series, with the exceptions of Games 4 and 5.

During the series, the Astros pitching staff would focus on beating Bellinger in on the hands with curveballs falling out of the zone, and with fastballs tailing up and away. Amazingly, Bellinger during the regular season only chased pitches out of the zone 29.7% of the time. This would change immensely as the Astros pitching staff’s effective deception would often pull Bellinger’s bat out of the zone.

In Game 4, Bellinger would face Astros pitcher Charlie Morton in the top of the 5th with no outs in a 1-2 count. Bellinger’s stance is in a more upright position with his bat also in a vertical position. This makes creating torque through his hands a little more awkward, as he rolls his hands into a hitting position. When this curveball begins to spin further in on his hands, it becomes too difficult to bring his hands in further, leading to this awful swing and follow-through shown. His approach on this pitch looks as if he’s trying to hit the ball 500 feet over the right-field wall; not an optimal mindset in a 1-2 count when you know the curveball is coming. His head was nowhere near the zone; he may as well have swung with his eyes closed. This is the position we often saw Bellinger in throughout the World Series when thrown an inside curveball. However, Bellinger would use this at-bat for his next plate appearance.

Now we see later in the game Bellinger is in a 1-1 count facing Morton in the top of the 7th. He knows he’s going to see a curveball in on his hands and adjusts accordingly. His body is in a lower position with his bat in a more angled approach, with his hands staying back, anticipating curveball, looking to stay in on the ball with his hands and drive it to right field. Bellinger manages to fight this pitch off, fouling it back, showing his adjustment helped. His follow-through is also in a significantly better position, with his head staying back looking at the ball, and his body stays in a more balanced stance. This approach, showing that he’s able to make even a small adjustment to making contact with the low and in curveball, led pitchers to start targeting the outside upper half of the zone with the fastball again.

Here we see in Game 4, Bellinger faces Astros pitcher Charlie Morton with a 1-1 count and 0 outs in the top of the 5th. Bellinger’s body is not in an effective hitting position for hitting this outside fastball. His body is falling out away from the zone, his pivot foot is not providing any power, and his hands reach out from his body too far. Bellinger would acknowledge this issue and had this to say before Game 4:

“I hit every ball in BP today to the left side of the infield,” Bellinger said. “I’ve never done that before in my life. Usually I try to lift. I needed to make an adjustment and saw some results today. I’m pulling off everything. Usually in BP I just try to lift, have fun in BP. But today I tried to make an adjustment. I needed to make an adjustment, and so I decided I’m hitting every ball to left field today.”

This is exactly what Bellinger would do.

In the top of the 9th in Game 4 with a 1-0 count and no outs, Bellinger faces Astros closer Ken Giles with runners on. Bellinger has his eyes locked in on the ball as he’s seen this pitch before. He’s using his approach from batting practice earlier to drill this ball into the gap. He keeps his body in an athletic hitting position, keeping his hands in and generating all his power through his lower half, creating torque through his strong hands. We see him drive this ball into the left-center gap, keeping his eyes on the ball the whole way and maintaining a strong follow-through. Bellinger did exactly what he said he would do and helped his team win this game. He would then carry on this adjustment into Game 5, showing people why he will be this year’s NL RoY.

Although Bellinger would fall into his old habits in Games 6 and 7, his ability to recognize where the problem is and the ability he has to adjust is what makes him an effective hitter. Through this, Bellinger will only continue to become better and will continue to become one of the most feared hitters in the league this next season. At only 22 years old now, Bellinger will become the next big star in this great sport we call Baseball.


What if a Team Bullpens an Entire Season?

We saw the Yankees basically bullpen the AL wild-card game. Sure, it was on accident, but their bullpen pitched 8.2 innings. And they did it well. This made me think about whether a team could put together a pitching staff that is almost completely used for bullpenning for the entire season.

To see if this would be possible, we will look at the Yankees since they are the team most closely equipped for it already. In the wild-card game, they essentially used four relief pitchers (let’s not count the one out Luis Severino had). Chad Green, David Robertson, Tommy Kahnle, and Aroldis Chapman combined for 8.2 innings and one earned run. Clearly, if a team could do this all the time, they would. In that game they did not use other relievers Dellin Betances and Adam Warren, as well as regular starting pitchers Jordan Montgomery and Jaime Garcia, who would have been available that night.

Since we now know what happened in that bullpen game, can we find out if it is possible to do it over a full season? First off, and MLB roster is comprised of 25 men for any given game and an additional 15 that can be called up if needed. An AL team can get by with 12 position players: one for every starting position (including DH) plus a fourth outfielder, utility infielder, and backup catcher.  Let’s say a team’s backups can field multiple positions, like many can. We can get rid of the everyday DH and use one of the backups or starters in that role for a needed day off. That leaves us with 11 position players and room for 14 pitchers.

Many of the Yankees’ own relievers can go multiple innings. Among those pitchers are Chad Green, David Robertson, Tommy Kahnle, Adam Warren, and occasionally Aroldis Chapman and Dellin Betances. Each are effective in their own right. The problem we have to face is the amount of rest needed for these pitchers. The four from the wild-card game each pitched with two days of rest, so we’ll set that as a bench mark. I also don’t want to assume a team needs five pitchers each game like they did in the wild card.

I don’t want to completely get rid of the starting pitcher. It would be dumb to just throw away what Luis Severino and other starters bring to that team. Instead, I want to put a hard limit on how much they pitch each game and how often they pitch. Theoretically, a team could go with a three-game cycle of pitchers. Games are played almost every day during the season, so the two days of rest benchmark will be used here. If we are using four pitchers per game every three games, we need 12 pitchers.

Game 1 Game 2 Game 3
L. Severino M. Tanaka S. Gray
C. Green A. Warren D. Robertson
T. Kahnle D. Betances C. Shreve
A. Chapman J. Holder G. Gallegos

I didn’t make this with any set reason, just the best options the Yankees would have in my view. There are many other options available for them and some may be even better. But, if this is the set of pitchers being used, that leaves two extra spots for our 14 available pitchers. Those two extra spots can be utilized for guys needed for extra innings that can pitch multiple innings, or a guy needed for an inning or two in case one of the above gets into trouble.

If a team were to go by this set of pitchers, the regular starting pitchers would be throwing 162 innings over a season. That would be seen as pretty normal for a starting pitcher over the course of a season and in some cases much less. Severino pitched 193 innings himself. The relievers, however, would see a pretty big bump in action. They would pitch 108 innings in a season, more than any of the pitchers above did last year. However, some of those pitchers were starters to begin their careers. Green, Warren, Betances, and Holder have each pitched more than 108 innings in a season. Now, that could be a reason for their increased effectiveness as relievers, but they would still only be pitching two innings in a game, not five or six.

It is possible to ask these relievers to stretch their arms out to be able to throw that many innings in a season. Relievers do transition to starting and this wouldn’t be quite the workload necessary. If a pitcher needs a break during a cycle through this set of pitchers, that could be what the additional two pitchers on the roster are for, or some of the 40-man pitchers could be called up to give a guy a break. They could also call up an actual starter from the minors to take over for four or five innings after the three-inning “starter” in this example. My point here is that if the relievers get tired over the course of a season, there are ways to give them breaks. Plus, the Yankees have so many resources and available pitchers that they have that capability to give breaks.

If the Yankees wanted to, they could keep Severino, Tanaka, Gray, Green, Warren, Robertson, Kahnle, Betances, and Chapman all on the roster for the whole season. That makes up 3/4 of the necessary pitchers. Shreve, Holder, and Gallegos could each be cycled up and down from AAA with other pitchers like Ben Heller, Domingo German, etc. in order to give breaks to the core nine pitchers. Another solution is to go out and get more relievers who can pitch multiple innings on a regular basis. They certainly have the prospects to do that. Pitchers like Brad Hand, Yusmeiro Petit, and Mike Minor each pitched over 77 innings and were very effective doing so.

Clearly there is much more that would be needed to make this a reality, and I don’t have the resources to know if it is even possible. Maybe these guys simply couldn’t pitch that many innings over a full season or they would lose too much velocity of break on their pitches from fatigue. But I saw David Robertson pitch 3.1 masterful innings in the wild-card game and pitch another 1.2 innings three days later. Obviously that is only two outings, but he was nevertheless effective in doing it, and I believe if any team could make this happen, it would be the Yankees.


Game 4: Stephen Strasburg and the Right-on-Right Changeup

In the NLDS, Stephen Strasburg was absolutely brilliant for the Nationals in his two starts. Due to an injury to Max Scherzer, Strasburg got the ball for Game 1 and was dominant. He threw 5.2 innings of no-hit ball before giving up back-to-back RBI singles to Kris Bryant and Anthony Rizzo that allowed two unearned runs to score thanks to a rare error by Anthony Rendon. Strasburg finished with an impressive line of 7 IP 3 H 2 R 0 ER 1 BB and 10 K in a losing effort. Although his outing was ruined by the unearned runs and Kyle Hendricks’ outstanding start which shut down the Nationals offense, Strasburg made the Cubs hitters look foolish all night long. Getting the ball once again with his team down 2-1 in the series, Strasburg turned in another absolute gem in Game 4. In a 5-0 victory, Strasburg threw seven shutout innings, scattering three hits while walking two and striking out 12. In his two starts combined, Strasburg threw 14 innings without allowing an earned run, while only giving up six hits with three walks to go along with 22 strikeouts.

The dominance on display by Strasburg is nothing new. Despite being the second-best pitcher on his team, Strasburg is an ace and finished second (behind Scherzer) among NL pitchers with 5.6 WAR. When Strasburg come to mind, the immediate thought goes to his power fastball. It’s one of the main reasons why the Nationals selected him with the first overall pick in the 2009 draft. He throws the pitch with an average velocity of 95.6 MPH good for fifth among qualified pitchers. Yet, Strasburg also loves to throw changeups, especially to right-handed hitters. Throughout the course of the regular season, Strasburg threw 16.3% changeups to right-handed hitters. This is an absurdly high amount for a power pitcher like Strasburg. Typically right-on-right changeups are primarily thrown by low-velocity sinkerballers, since changeups typically have the same movement as their sinker despite being thrown 5-10 MPH slower. Conventional wisdom has dictated for years that power pitchers should throw fastballs and curveballs (or sliders) to the same-handed hitters while throwing fastballs and changeups to opposite-handed hitters. The idea behind this is to throw a breaking pitch with movement that breaks away from the hitter, making it harder to hit. Right-on-right changeups were regarded as a dangerous pitch since a mistake almost always ended up with the pitch being barreled.

In 2013, Ben Lindbergh wrote an article for Baseball Prospectus about the Tampa Bay Rays (because who else besides Joe Maddon and Andrew Friedman) and their increased usage of same-sided changeups (this article includes left-on-left changeups as well). However, the team refused to recognize this increased same-sided changeup usage as an intentional move, but rather tried to classify it as an increase in the emphasis on throwing changeups to all hitters regardless of handedness. As a team in 2013, the Rays led the league in percent of same-sided changeups, as 15.9% of all pitches thrown to same-sided hitters were changeups. The league average was 5.4%. This league average has held relatively constant over the last four years. Using Statcast data from 2017 for all right-on-right pitches thrown by starting pitchers, 6.6% of all right-on-right pitches were changeups.

Back to Strasburg. Throwing his changeup 16.3% of the time to right-handed hitters, he generated a whiff rate of 27.2% while only allowing five hits and 13 other balls in play, on 213 changeups. Four of those five hits were singles, while the other was a home run hooked down the line by Josh Harrison (hit probability of 13%). He used his changeup primarily as an out pitch, as most were thrown down and in with two strikes. It totally makes sense for Strasburg to use his changeup so much, as it is one of the best pitches in baseball, and it really is its own animal. It’s unique because he throws it really hard. It was the second-hardest changeup among qualified starters, coming in at an average of 88.7 MPH. Despite throwing it so hard, it was 7 MPH slower than his average fastball, right in the ideal range of velocity differential. It also has a decent amount of arm-side run to go along with late and sharp drop (as can be seen here). According to the Pitch Values assigned by FanGraphs, Strasburg’s changeup was fifth best among qualified starters in total value, and 10th best on a per-pitch basis.

In his Game 1 start, Strasburg threw six right-on-right changeups out of 45 pitches (13.3%) and generated four whiffs with zero balls in play. This was right in line with his season averages, which would’ve been expected to continue in Game 4. But this was not the case. It was reported on Tuesday that Strasburg was sick and would not pitch on Wednesday despite being on regular rest after the rainout. Yet, on Wednesday morning, plans changed and he was announced as the Game 4 starter with the Nationals season on the line. As mentioned earlier, he did his job by turning in a spectacular start, and the Nationals’ season lived to see another day. However, in Game 4 Strasburg decided to get funky. He threw 16 right-on-right changeups out of 45 pitches, equal to a whopping 35.6% of the time, and generated eight whiffs with one ball in play hit at 27.7 MPH. His changeup and its increased usage was no doubt a huge factor in shutting down the Cubs once again (as can be seen here, here, and here). Who knows why he decided to go to it so much more often. Maybe he saw the success he had with it in Game 1, or maybe that pitch was the most comfortable for him to throw while supposedly not feeling well (his average fastball velocity of 95.4 MPH suggests he was feeling just fine). No matter what it was, it doesn’t matter. Strasburg has proved that the right-on-right changeup can not only be an effective pitch, but an absolutely devastating one. A pitch that can even be used over a third of the time. Let’s see if hitters will be able to adjust.


The Effect of Rest Days on Starting Pitcher Performance

Since the dawn of baseball, fans and coaches alike have debated whether or not pitch count and days of rest affect a pitcher’s health status and performance. This ongoing discussion has led to a close examination of how to best manage the health status of a pitcher. Should you give your starting pitcher that extra day of rest or can you pitch him in the big game today? The question of how to manage your starting pitcher can make or break a season, and, therefore, certainly merits the amount of attention and debate it has received.

Major League Baseball’s adjustment to the age of big data has reshaped the way in which we view these age-old debates. Nowadays, there are public databases that allow hobbyists and students of the game to query their own data and investigate their own theories. Baseball Savant and Baseball Reference are the two main public databases in use, and are the two databases that will be utilized for this study. The data being queried is rest days and runs scored per inning pitched for starting pitchers in Major League Baseball in the last five full seasons.

Problem Definition

In this study, I will look at the effect that the number of days of rest has on the performance and health of a starting pitcher in Major League Baseball. More specifically, I will investigate whether or not fewer rest days are correlated with poor performance and poor health status. Not only does this study have the potential to save millions of dollars for the baseball industry, but it could also provide starting pitchers with more knowledge on how rest days between starts affects their health and performance. The predictor “Runs Scored per Inning Pitched” will be evaluated to determine performance. Although there is a significant amount of noise (i.e. many factors contribute to the outcome) in the runs scored predictor, it seems like the best way to determine a pitcher’s performance on a game-by-game basis. Ultimately, the number of runs scored is the difference between winning and losing, and therefore should be the main criteria used to judge the performance of a starting pitcher.

Results

I determined that there is a significant difference between a pitcher’s performances on a specific number of rest days versus the others. However, there is no significant difference in starting a pitcher on “short rest” (1-3 days) versus “normal rest” (4-6 days) versus “extended rest” (7+ days).

This is an extremely important result considering that starting pitchers are usually employed on three, four, or five days of rest. Currently, starting pitchers are believed to perform at the highest level without the added possibility of injury with this amount of “normal rest.” However, this study shows that there is no significant difference in starting your pitcher on short rest vs. normal rest vs. extended rest. While there is a correlation in the specific number of rest days and performance of a pitcher, there is no significant difference in starting your pitcher on short rest vs. normal rest vs. extended rest.

This study shows that each of those extra off days could not only make a significant difference in pitching performance but also could make a difference in health status for pitchers. There is a fine line between getting the most out of your starting pitcher, and overusing him.

Data Analysis and Tests

In order to determine if there is a significant difference between runs scored per inning pitched and the number of rest days, a non-parametric ANOVA test is needed. The results are as follows:

Reject Ho at alpha=. 05, the Runs Scored per Inning Pitched rate is significantly different for at least one of the number of days of rest. The number of runs scored per inning pitched is significantly different for at least one of the numbers of rest days.

However, we want to know if having your starting pitcher pitch on “short rest” is significantly different than having your starting pitcher on “normal rest.” In order to do this, the data was split into number of days of rest 1-3 and days of rest 4-6. Zero days of rest was eliminated, as these numbers typically only apply to relief pitchers. Then, a non-parametric rank sum test was conducted to determine if performance on “short rest” is significantly different than performance on “normal rest.” The results are as follows:

Do not reject Ho at alpha=. 05, the Runs Scored per Inning Pitched rate is not significantly different for “short rest” and “normal rest.” There is no significant difference in performance between pitchers on “short rest” and “normal rest.”

Last, “extended rest” was looked at to determine if runs scored per inning pitched was significantly different than “short rest” and “normal rest.” “Extended rest” includes all rest days of 7 and over. The results are as follows:

Do not reject Ho at alpha=. 05, the Runs Scored per Inning Pitched rate is not significantly different for short rest, normal rest, and extended rest. Therefore, there is no significant difference in performance between short rest, normal rest, and extended rest.

Recommendations

The first recommendation I would make would be to look at pitchers coming off the disabled list and starting. Starting pitchers can definitely be skipped in a rotation when a team has an off day. This causes there to be much more time between starts.

If possible, data that tracks rest time between pitcher’s starts up to the hour as a continuous variable would be ideal. This could provide more insight into the effect of rest on performance of starting pitchers, and it would provide more of a continuous variable for analysis instead of treating all rest days equally.

Another recommendation for the study would be to use a different predictor for performance. Finding a public database that included days of rest data for each start was tough, and finding one that had days of rest data for each start along with the predictors that were sought after was even tougher. Ideally, an advanced statistic like FIP or weighted On-Base Average would be used, but these predictors are very difficult to calculate for over 1300 data points.

As long as there are starting rotations in baseball, the question of how off-days affect the performance and health of starting pitchers will be studied. Another potential study would be to look at the pitch count of starting pitchers. This could have a similar effect as rest days when looking at performance. With the recommendations made in this study, a future study to determine if performance is affected by pitch count and days of rest would be extremely beneficial.


dScore: End of August SP Evaluations

I went over the starters version of dScore here, so I’m not going to re-visit that here. I’ll just jump right in with the list!

Top Performing SP by Arsenal, 2017
Rank Name Team dScore +/-
1 Corey Kluber Indians 69.41 +2
2 Max Scherzer Nationals 62.97 -1
3 Chris Sale Red Sox 56.82 -1
4 Clayton Kershaw Dodgers 55.26 +1
5 Noah Syndergaard Mets 47.39 +2
6 Stephen Strasburg Nationals 47.24 +5
7 Danny Salazar Indians 43.46 +16
8 Randall Delgado Diamondbacks 42.00 +1
9 Luis Castillo Reds 37.99 +5
10 Alex Wood Dodgers 40.72 -8
11 Zack Godley Diamondbacks 39.55 -1
12 Luis Severino Yankees 39.24 +1
13 Jacob deGrom Mets 36.69 -1
14 Dallas Keuchel Astros 37.37 -8
15 James Paxton Mariners 35.81 +1
16 Carlos Carrasco Indians 34.23 +4
17 Sonny Gray Yankees 30.59 UR
18 Brad Peacock Astros 29.98 +6
19 Lance McCullers Astros 32.18 -11
20 Buck Farmer Tigers 31.31 UR
21 Nate Karns Royals 30.21 -2
22 Zack Greinke Diamondbacks 29.45 -4
23 Charlie Morton Astros 28.55 UR
24 Kenta Maeda Dodgers 27.40 -7
25 Masahiro Tanaka Yankees 26.83 -3


Risers/Fallers

Danny Salazar (+16) – dScore never gave up on him, despite him being absolute trash early on this year. He came back and dominated, launching him up the ranks even farther in the process. Current status: injured. Again.

Sonny Gray (newly ranked) – If there were any doubts about the Gray the Yankees dealt for, he’s actually surpassed his dScore from his fantastic 2015 season. He’s legit (again).

Alex Wood (-8) – Looks like the shoulder issues took a bit of a toll on his stuff, but dScore certainly isn’t out on him.

Dallas Keuchel (-8) – Keuchel’s stuff isn’t the issue. He’s still a buy for me.

Lance McCullers (-11) – Poor Astros. Maybe not too poor though; their aces have gotten hammered but haven’t fallen far at all. McCullers is going to bounce back.


The Studs

Some light flip-flopping at the top, with Kluber taking over at #1 from Scherzer. The Klubot’s been SO unconscious. Everyone else is pretty much the usual suspects.


The Young Breakouts (re-visited)

Zack Godley (11) – He’s keeping on keeping on. He barely moved since last month’s update, and I’m all-in on him being a stud going forward.

Luis Castillo (9) – He’s certainly done nothing to minimize the hype. In fact, he’s added a purely disgusting sinker to his arsenal and it’s raising the value of everything he throws. Also, from a quick glance at the Pitchf/x leaderboards, two things stand out to me. He seems to have two pitches that line up pretty closely to two top-end pitches: his four-seamer has a near clone in Luis Severino’s, and his changeup is incredibly similar to Danny Salazar’s. That’s a nasty combo.

James Paxton (15) 


The Test Case

Buck Farmer (20) – Okay, so to be honest when he showed up on this list, I absolutely thought it was a total whiff. By ERA he’s been a waste, but he’s really living on truly elite in-zone contact management, swinging strikes, K/BB, and hard-hit minimization. His pitch profile is middling (not bad, but not great either), so I really don’t think he’s going to stay this high much longer. He’s certainly doing enough to earn this spot right now, and I’d expect him to not run a 6+ ERA for much longer.


The Loaded Teams

Yankees – Luis Severino (12), Sonny Gray (17), Masahiro Tanaka (25) / Some teams have guys higher up, but the Yankees are loaded up and down.

Astros – Dallas Keuchel (14), Lance McCullers (19), Brad Peacock (18), Charlie Morton (23) / Similar to the Yankees. Morton and Peacock are having simply phenomenal years.


The Dropouts

Rich Hill (39)

Trevor Cahill (35)

Marcus Stroman (28)

Poor Rich Hill. Lost his perfect game, then lost the game, then lost his spot in the top 25. Cahill’s regressed to #DumpsterFireTrevor since his trade to the Royals. Stroman really didn’t fall that far…and his slider is still a work of art.


The Just Missed

Jordan Montgomery (26) – Too bad the Yankees couldn’t send down Sabathia instead. This kid is good.

Aaron Nola (27) – #Ace

Carlos Martinez (29) – Martinez simply teases ace upside, but frankly I think you can pretty much lump him and Chris Archer (30) in the same group — high strikeouts, too many baserunners and sub-ace starts to move into the top tier.

Dinelson Lamet (32) – He’s absolutely got the stuff. He could stand to work on his batted-ball control though.

Jimmy Nelson (34) – dScore buys his changes. He finished at #148 last year. I’ll call him a #2/3 going forward.


Notes from Farther Down

Jose Berrios is all the way down to 47. His last month cost him 19 spots, but frankly it could be much worse: Sean Manaea lost 39 spots, down to 87. Manaea really looks lost out there. I don’t want to point at the shoulder injury he had earlier this year since his performance really didn’t drop off after that…but I’m wondering if he’s suffering from some fatigue that’s not helped by that. He’s pretty much stopped throwing his toxic backfoot slider to righties, and that’s cost him his strikeouts. Michael Wacha is another Gray-like Phoenix: he’s up to 52 on the list, once again outperforming his 2015 year. I’m cautiously buying him as a #3 with upside. And finally, buzz round: Mike Clevinger (33)Alex Meyer (36)Robbie Ray (38)Rafael Montero (41), and Jacob Faria (43) are already ranked quite highly, and outside of Montero and maybe Meyer I could see all of them bumping up even higher. Clevinger’s really only consistency away from being a legitimate stud.


My next update will be the end-of-season update, so I think I’m going to do a larger ranking than just the top 25; maybe all the way down to 100. Enjoy the last month-plus!


Why the Mets Should Call Up Tim Tebow in September

As of August 21st, 2017 Tim Tebow was slashing .220/.304/.343 between the New York Mets’ High-A team, the Columbia Fireflies (South Atlantic League), and their Advanced-A squad, the St. Lucie Mets (Florida State League). In 442 minor-league plate appearances, he is the owner of a .304 wOBA, and is striking out at a 26% clip while walking in 8% of his plate appearances. For every one ball that Tebow elevates, he is hitting the ball on the ground three times over. Right off the bat (pun intended), it is evident that Tebow’s offensive game leaves something to be desired.

Let’s take a quick look at how Tebow stacks up with the average hitter, in each A-ball league, that has had a minimum of 200 plate appearances and has primarily played the same position(s) as Mr. Tebow (outfield & designated hitter):

*Data as of 8/21/2017
Player Age BB% K% AVG OBP SLG OPS wOBA wRC+
Tim Tebow 30 8.8% 26.5% 0.220 0.304 0.343 0.647 0.304 90
Avg. SAL OF/DH 21.5 7.7% 21.9% 0.253 0.322 0.378 0.700 0.322 104
Avg. FSL OF/DH 23 8.2% 21.4% 0.255 0.324 0.370 0.694 0.324 103

Only his walk rate appears to be on par with each respective league’s average. Additionally, Tebow has logged a .913 fielding percentage while playing (primarily) left field this year. It is widely understood that fielding percentage is a “far-from-perfect” measurement when objectifying defensive ability, but it can provide a high-level perspective on one’s aptitude as it relates to fielding the baseball. To put Tebow’s number into context, the lowest fielding percentage in the major leagues this year by an outfielder (minimum 100 innings played) is Mark Canha of the Oakland A’s, at .922.

Many words come to mind when attempting to summarize the 30-year-old’s all-around quality of play while in A-ball; ‘excellent’, ‘incredible’, or ‘promising’ would not be any of those words. However, despite the subpar statistical measuring points, the Mets should seriously consider calling up Tim Tebow to the big leagues come September.

No, that is not a typo. Yes, you read the last sentence of the above paragraph correctly. When rosters expand to include anyone on the 40-man roster on September 1st, the New York Mets should give sincere thought to adding Tim Tebow to their roster/big-league club. Now, why would the New York Mets, a team that owns a 55 – 71 win-loss record and trails the NL Wild Card race by 13.5 games and NL East Division title by 21 games, bother calling up a poorly-performing 30-year-old high-A-ball player? The answer, as it is with many things in life, is money.

Baseball clubs generate revenue in many ways: merchandise sales, concessions sales, corporate sponsorships, media deals, etc. One of the largest and most obvious ways in which income at the major-league club level is generated is through home-park ticket sales. Tim Tebow excels at putting fans in the stands:

YoY Average Home Game Attendance Figures

Year Columbia Fireflies St. Lucie Mets
2016 3,768 1,405
2017 4,783 1,996
YoY % Change 21% 30%

As you can see, both teams that Tebow has played for this year have experienced huge jumps in home attendance figures. This has occurred despite the fact that in 2016 the Columbia Fireflies were celebrating their inaugural season at a brand new stadium, and the St. Lucie Mets were 11 games over .500 in the thick of a playoff race (compared to 11 games under .500 in 2017 at the time of this publication).

As I alluded to above, a lot of circumstances can impact attendance figures: new stadium, weather, promotions, team quality, opponent, etc. However, I think that it’s pretty evident that Tim Tebow’s arrival on the Mets’ minor-league scene has driven a majority of the jump. To confirm this, let’s look at attendance figures from a different angle – specifically, 2017 home attendance numbers and how they vary for each team from when Tebow was actively rostered vs. when he was not:

*Data as of 8/19/2017
Team Tebow Rostered # of Home Games Avg. Home Game Attendance % Change
Columbia Fireflies No 20 3,757
Columbia Fireflies Yes 41 5,308 29%
St. Lucie Mets No 37 1,745
St. Lucie Mets Yes 24 2,419 28%

Again, it’s evident that Tim Tebow’s roster presence has enticed people to come to the home team’s ballpark at a clip nearly 30% greater than if he were not on the team.

So how do we translate these attendance figures into dollars and cents? Since I do not have access to either team’s ticketing database, this is where some assumptions about average per-cap and ticket value will have to come into play. Baseball America’s JJ Cooper & Josh Norris have recently written articles that similarly examine Tebow’s impact at the box office – however, their stories concentrate heavily on road attendance and overall league attendance impacts, rather than the home ballpark’s ticket sales (which are critical to driving a organization’s recognized revenue). In his article, Norris notes that most minor-league operators use a $21 per-cap estimate for fan spending. This figure is an estimate of what each fan that enters the ballpark will have paid in tickets, concessions, merchandise, and parking.

For the first 39 home game dates (41 games due to two doubleheaders) of their 2017 season, the Columbia Fireflies were able to showcase Tim Tebow in uniform. They attracted 207,031 fans. In the first 39 home game dates of their inaugural 2016 season, the Fireflies drew 155,132 fans. The difference between 2017 and 2016 for these first 39 home game dates is 51,899 fans. If we apply the $21 per-cap estimate referenced above, we are looking at about $1.1 million in additional revenue that can be largely attributed to Tebow being in uniform. Tebow’s last game for the Fireflies was on June 25th, his first game for the St. Lucie Mets was on June 28th. Through August 18th, Tebow has been a member of St. Lucie’s roster for 22 home game dates (24 games due to two doubleheaders) and has helped attract 53,207 fans. In 2016, the St. Lucie Mets were able to draw 21,097 during the same stretch. If we apply the $21 per-cap estimate, it will have amounted to $674,310 in additional revenue over the course of the 22 home game dates at this point in the season. Additionally, Tebow has undoubtedly drawn in an abundance of new consumers to each team’s ballparks and databases. This is information that can be leveraged for future sales and marketing initiatives. It would not be ludicrous to state that, combined, the Mets’ A-ball affiliates have increased home-park revenues by roughly $2 million due to Tim Tebow.

Let’s take a hypothetical look at these trends from the 2017 New York Mets point of view. Their current 40-man roster sits at 36 occupants – so there is no risk of having to DFA a player in order to bring on a newcomer. They are far removed from the playoffs, and already have their sights set on next year. Even by adding Tebow to the 40-man roster, they would have three additional spots to work with should they want to expose some of their MLB-ready prospects to low(er)-leverage big-league games in September. The Mets would have to pay Tebow a pro-rated MLB minimum salary, which would come to be about $65K for the final four weeks of the season, pennies compared to what he would bring back in return.

Here is a table of the historical attendance at Citi Field for the month of September since 2010:

Year Citi Field Sept. Attendance # of Games
2010 382,306 14
2011 433,251 16
2012 385,292 16
2013 340,799 15
2014 337,343 13
2015 353,005 11
2016 468,283 14
2017 ? 14

I’ve highlighted 2014 because it most closely resembles the environment that the 2017 Mets will be embarking upon, as you can see below:

*Through 122 games
Year Winning % GB – Division GB – Wild Card Weekday Home Games Weekend Home Games
2014 0.467 10.5 7.5 7 6
2017 0.443 20 12 8 6

You will notice, the 2014 and 2017 Mets were/are both clearly out of the playoff picture and had/have a similar distribution of home games throughout the month of September. Despite one more overall September game in 2017, the 2014 season should prove to be a good starting point for us; because of the extra game, let’s estimate that the Mets will bring in around 339,000 people to Citi Field in September of 2017.

Now, the fun part. How does that audience, and consequentially revenue, project to increase if Tim Tebow were added to the roster? It would be rather difficult to forecast how a marketplace like New York City would react to a move of that nature. There are infinite amounts of variables that could be considered: chilly September temperature and weather volatility, inability to purchase season packages so late in the year, the comparison of the NYC marketplace to that of Columbia, SC and St. Lucie, FL, the matter of the media, the beginning of football season, etc. the list could go on and on. For simplicity’s sake, let’s assume that New York’s market would react in a similar manner as that of Columbia & St. Lucie’s – home attendance gains of near 30%. That would push an additional 102,000 customers through the Citi Field turnstiles during the last four weeks of the season.

The average MLB ticket price in 2016 was $31.00, a 7% increase from the previous year. A 7% increase from the 2016 ticket price would put us just over $33.00 for 2017. This gives us a place to start with regards to estimating revenue impact. I don’t have access to the Mets’ ticketing database, so this barometer will do for the time being. My gut tells me that the $33.00 price point is low; typically season-ticket prices are used when calculating the league-wide annual average ticket price, and season tickets are sold at a discount compared to single-game ticket prices. Being that it is September, most fans that would turn out to see Tebow would be purchasing at the single-game ticket price point (or group-ticket price point, but that complicates things further) since season packages are likely no longer being sold for 2017.

Irrespectively, at this point the math becomes clear: 102,000 additional fans at $33.00/ticket would generate an estimated $3.4 million in surplus revenue. This doesn’t even include the additional revenue that would accrue via a multitude of other outlets. Concessions, merchandise, and parking – all revenue streams that the Mets split with their respective vendors – would experience huge jumps. Strategies to boost season-ticket-holder retention for 2018 (Tim Tebow meet and greet anyone?) would likely yield positive results. As stated before, entirely new ticket buyers would flood into the Mets’ ticketing database — which should boost returns in some form or fashion in future years.

Tim Tebow is not going to play baseball forever. He may choose to call it quits on his “pro-ball quest” after this year. Who’s to say he even wants to go through another year toiling away in the low minor leagues? A promising and young (albeit injury-prone) starting pitching staff should have the Mets within shouting distance of playoff contention for the next couple of years. If that is the case, they will not want to waste an NL roster spot on a subpar, 31-year-old, designated hitter. Roughly $3.5 million should allow the Mets to chase around 0.5 WAR on the open market. It could provide them additional wiggle room to take on extra salary in a deadline trade next year. It would allow the acquisition of players along the likes of Trevor Cahill, Logan Morrison, or Drew Storen…all of whom signed for under $3 million this past offseason. It could be put toward additional infrastructure, baseball analytics, or scouting staff.

Sure, there are certainly more deserving players in the Mets’ minor-league system that have ‘paid their dues’ to a greater extent than Tim Tebow — all in the hopes of getting a call-up to the Show. But baseball is a business, and at the end of the day, no one in the Mets’ system will be able to have an impact on fans the same way that Tim Tebow does/can. The Mets need to capitalize on their current situation before the former Heisman trophy winner tires of the long and uncomfortable bus rides, motel stops, and food spreads that dot the minor-league landscape. The Mets need to cash in on their investment before Tebow bids baseball adieu.


Giving Players the Bonds Treatment

There is no higher compliment that can be given to a ballplayer than to be given “The Bonds Treatment” — being intentionally walked with the bases empty, or even better, with the bases loaded. It’s called “The Bonds Treatment” because Barry Bonds recorded an astounding 41 IBBs with the bases empty, and is one of only two players to ever record a bases-loaded intentional walk. In other words, 28% of IBBs ever issued with the bases empty were given to Bonds — and 50% of IBBs with the bases loaded. Bonds was great, no denying that — but is there anyone out there today who is worthy of such treatment?

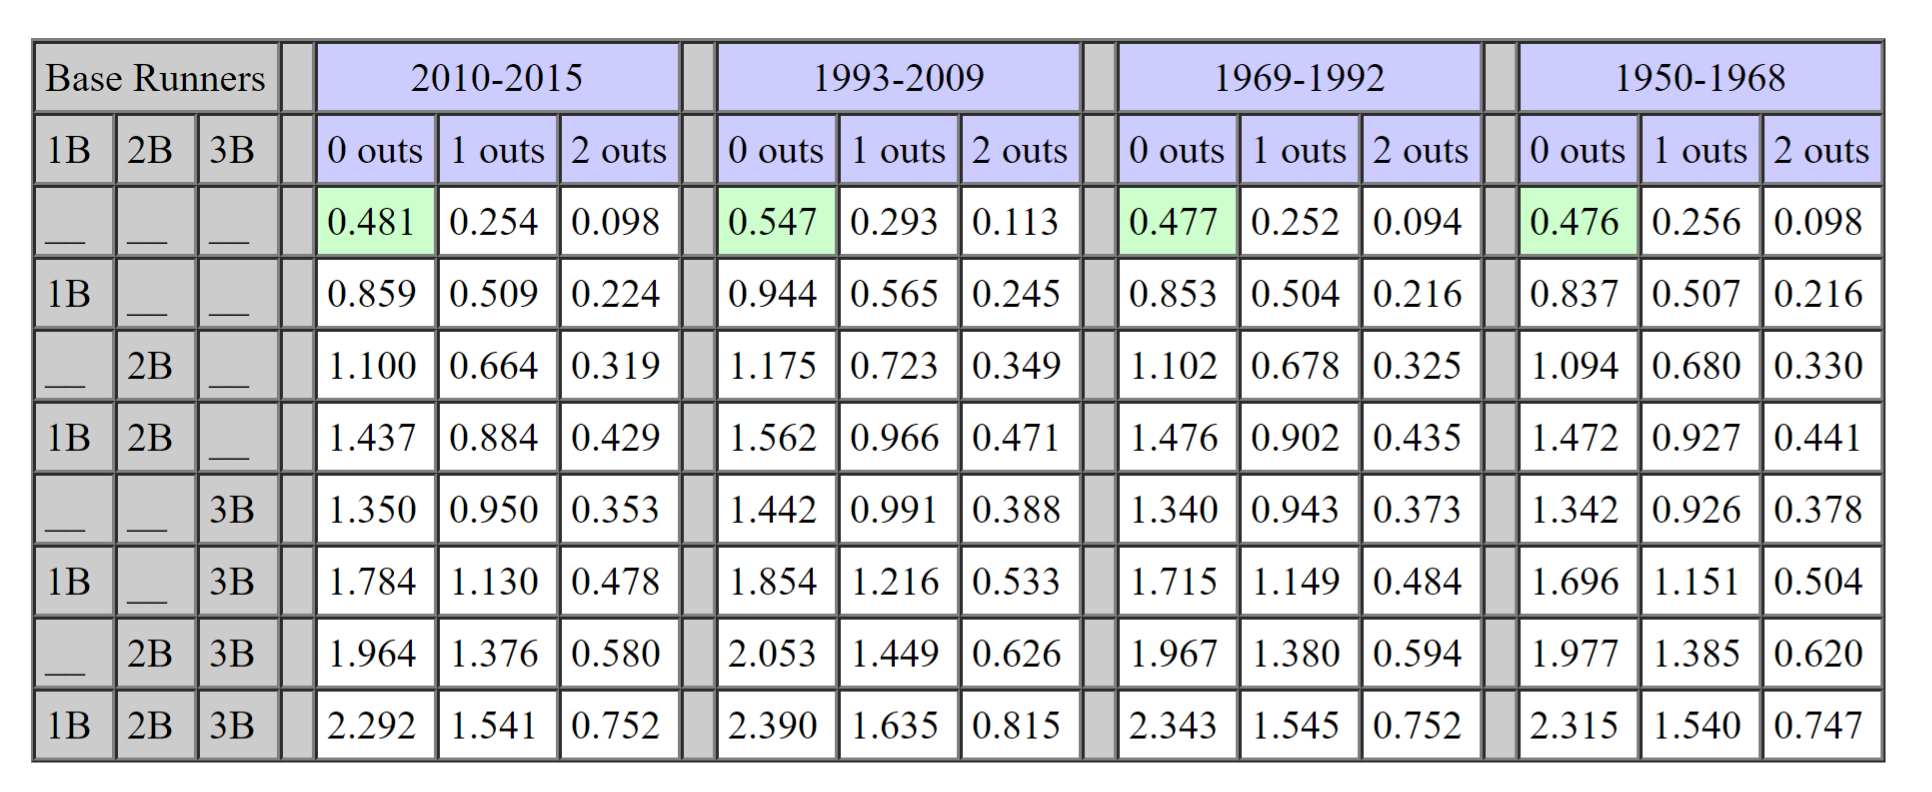
We can find out using a Run Expectancy matrix. An RE matrix is based on historical data, and it can tell you how many runs, on average, a team could expect to score in a given situation. A sample RE matrix, from Tom Tango’s site tangotiger.net, is shown below.

RE Matrix

The chart works as follows — given a base situation (runners on the corners, bases empty, etc.) move down to the corresponding row, then move to the corresponding column and year to find out how many runs a team could expect to score from that situation. In 2015, with a runner on 3rd and 1 out, teams could expect to score .950 runs on average (or, RE is .950). If the batter at the plate struck out, the new RE would be .353.

We can take this a step further. Sean Dolinar created a fantastic tool that allows us to (roughly) examine RE in terms of a batter’s skill. Having Mike Trout at the plate vastly improves your odds of scoring more than having Alcides Escobar, and the tool takes this into account. We can use this tool to look at who deserves the Bonds treatment in 2017 (or, to see if anyone deserves the Bonds treatment): defined as being walked with the bases empty, or the bases loaded.

First, we can look at a given player and their RE scores for having the bases empty or full. In this instance, we will use Michael Conforto, who batted leadoff for the Mets against the Texas Rangers on August 9. Conforto’s wOBA entering the game was .404, and the run environment for the league is 4.65 runs per game, so Conforto’s relevant run expectancy matrix looks like this:

Michael Conforto RE Matrix

Batting behind him was Jose Reyes, who, entering the game, had a wOBA of .283. Let’s assume that Conforto receives the Bonds Treatment, and is IBB’d in a given PA with bases empty or loaded. What would the run expectancy look like with Reyes up? In other words, what is Reyes’ run expectancy with a runner on first, or with the bases loaded after a run has been IBB’d in?

To do this, we can look at Reyes’ RE with a runner on first and with the bases loaded. Reyes’ RE with a man at 1B is indicative of what the RE would be like if Conforto had been given an intentional free pass. For a bases-loaded walk, we look at Reyes’ RE with the bases loaded, and then add a run onto it (to account for Conforto walking in a run).

Jose Reyes RE Matrix

Then, we can compare the corresponding cells of the matrices to see if the Texas Rangers would benefit any from walking Conforto. If RE with Conforto up and the bases empty is higher than RE with a runner on first and Reyes up, or RE with the bases loaded and Conforto up is higher than RE with Reyes up and a run already scored, then we can conclude that it makes sense to give Conforto that free pass.

In this instance, we can see that if the Rangers were to face Conforto with the bases empty and two out, it would make more sense for them to IBB Conforto and pitch to Reyes than it would for them to pitch to Conforto, because RE with Conforto up (.172) is higher than RE with Reyes up and Conforto on (.145). As a result, Conforto is a candidate for the Bonds treatment in this lineup configuration, if the right situation arises.

Who else could be subjected to the Bonds treatment? It would take me a few months of work to run through every single individual lineup for every team to figure out who should have been pitched to and who should have gotten a free pass, so to simplify things, I looked at hitters with 400+ PA, looked at when they most frequently batted, who batted behind them most frequently, and whether or not they should have received the Bonds treatment based on who was on deck. While no lineup remains constant throughout the season, looking at these figures gave me a good idea of who regularly batted behind whom.

Three candidates emerged to be IBB’d with the bases empty every time, regardless of outs— Yasiel Puig, Jordy Mercer, and Orlando Arcia. These players usually bat in the eighth slot on NL teams, and right behind them is the pitchers’ slot — considering how historically weak pitchers are with the bat, it makes sense that RE tells us to walk them with the bases empty every single time.

The same could be said of almost anyone batting ahead of a pitcher — according to our model, given an average-hitting pitcher, any hitter with a wOBA over .243 should be IBB’d with the pitcher on deck (only one qualified hitter — Alcides Escobar — has a lower wOBA than .243). The three names above stuck out in the analysis because they were the only players with 400+ PA that had spent most of their PAs batting eighth.

So, an odd takeaway of this exercise is that in the NL, unless a pinch-hitter is looming on deck, the eighth hitter should almost always be intentionally walked with the bases empty, because it lowers the run expectancy. Weird!

The model also identified two hitters who deserved similar treatment to Michael Conforto in the above example (IBB with 2 out and no one on) — Buster Posey and Chase Headley.

Posey has batted with almost alarming regularity ahead of Brandon Crawford, who is running an abysmal .273 wOBA on the season. Headley is a little more curious — Headley is usually a weak hitter, but earlier in the season, Headley batted ahead of Austin Romine frequently, who was even worse than Crawford.

Headley technically isn’t that much of a candidate for the Bonds Treatment since Romine hasn’t batted behind him since June 30, but Crawford has backed up Posey as recently as August 3 — if he’s batted behind Posey again, the situation could very well arise where it becomes beneficial for teams to simply IBB Posey with two out and bases empty.

But ultimately, no one, aside from NL hitters in the eighth slot, emerges as a candidate to be IBB’d every time with the bases empty. And no one, regardless of the situation, deserves a bases-loaded intentional walk. Which raises the question — was it appropriate to give the man himself, Barry Bonds, the Bonds Treatment?

Bonds received an incredible 19 bases-empty IBBs in 2004 (more than doubling the record he set in 2002), so we’ll use 2004 Bonds and his .537 wOBA as the center of our analysis.

In 2004, Bonds batted almost exclusively fouth, and the two men who shared the bulk of playing time batting fifth behind him (Edgardo Alfonzo and Pedro Feliz) had almost identical wOBAs that season (.333 and .334, respectively) — so we’ll assume that the average hitter behind Bonds in 2004 posted a wOBA of .333. This yields RE matrices that look like this:

Barry Bonds RE Matrix compared to 5th Hitter, 2004

Bonds proves himself worthy not only of a bases-empty IBB with two out, but he just barely misses with a bases-loaded IBB. While no one ended up giving Bonds a bases-loaded IBB in 2004, they did give him one in 1998.

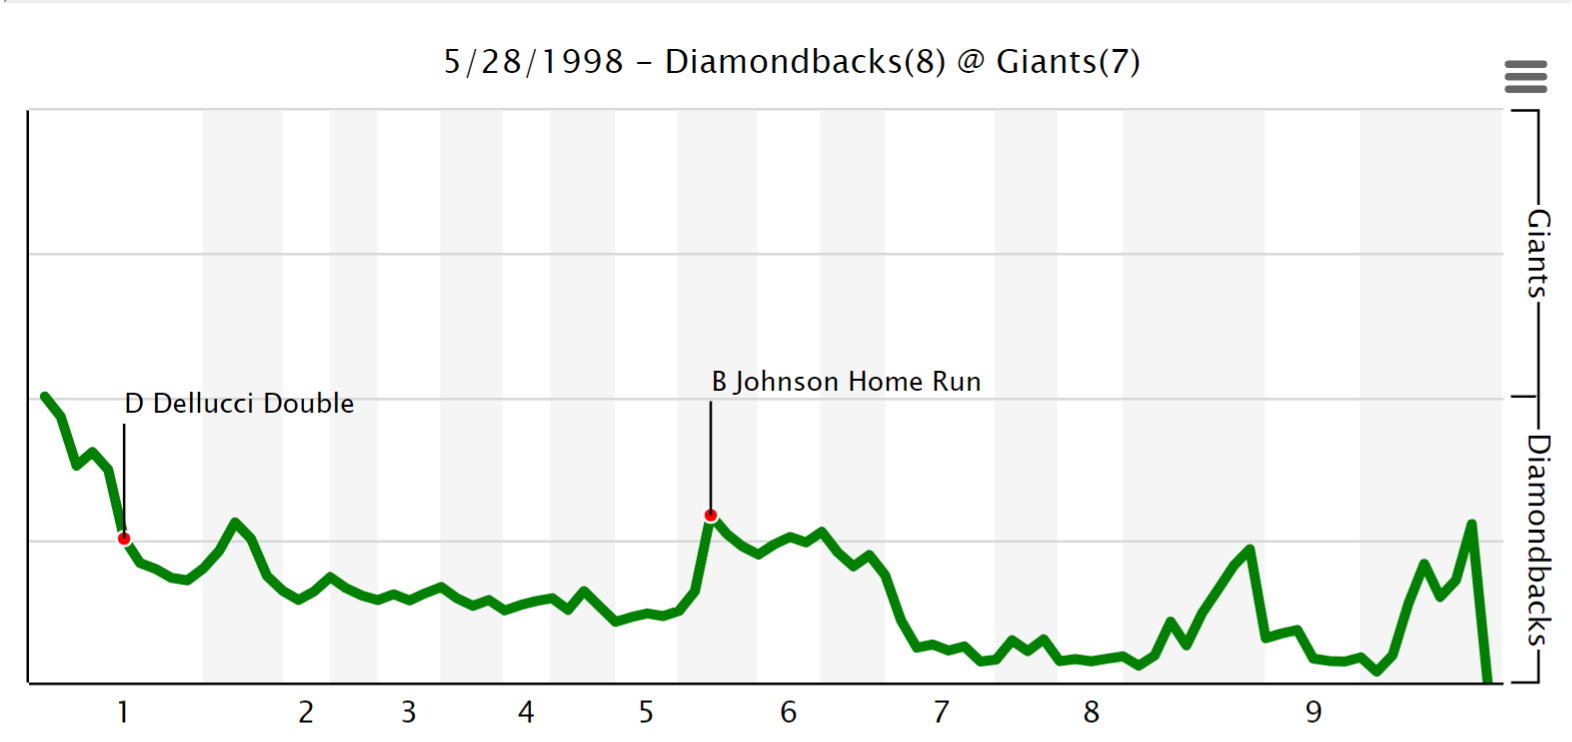
For perspective, Bonds was running a .434 wOBA in 1998, and Brent Mayne (who was on deck) was running a .324 wOBA — so this actually wasn’t a move that moved RE or win probability in the right direction.

Win probability, Diamondbacks @ Giants, 5/28/1998
The final spike in WPA is Bond’s IBB — it gave the Giants a better chance of winning. Ultimately, it was a bad idea that didn’t backfire in the Diamondback’s faces.

And of course, I would be remiss in not mentioning the other player to have ever received a bases-loaded IBB — Josh Hamilton.

With apologies to Hamilton, he wasn’t the right guy to get the Bonds treatment here, either — Hamilton ran a .384 wOBA in 2008, and Marlon Byrd, who was on deck, had a .369 wOBA, which means that an IBB in this instance was a really awful move. An awful move that, like Bonds’ IBB, was rewarded by Byrd striking out in the next AB.

Have there been other players deserving of bases-loaded IBBs? It’s possible, but the most likely candidates — Ted Williams and Babe Ruth — usually had good enough protection in the lineup. Of course, there are few hitters that could have protected Bonds from himself — hence why it’s almost a good idea to IBB him with the bases loaded.


Challenging Conventional Wisdom About the Trade Deadline

The MLB trade deadline has passed, and you may be happy or disappointed that your favorite team is going to be stuck with the players they now have until the end of season. Actually, that’s not true. Trades can be made until August 31, but any player swap after the deadline invokes the waiver-wire process, which allows any other team to block a trade or claim a waiver player for themselves. So, deals that will have any sort of impact will usually happen just before the deadline.

This year’s trade deadline involved the names of mostly pitchers — Sonny Gray, Yu Darvish, Jaime Garcia, David Robertson, Sean Doolittle, Addison Reed, Francisco Liriano, and others were all traded near or almost at the deadline.

The Dodgers, whose pitching staff so far has led the league in FIP, ERA, WHIP, and rank third in K/BB ratio, added Yu Darvish, a pitcher who hasn’t been his best this season, but who can certainly turn a great rotation into a nearly unbeatable one in a five-game or seven-game series. The Cubs, whose bullpen ranks 10th in fWAR, brought in left-handed reliever Justin Wilson from the Tigers, who presumably will fill the role as the set-up man for Wade Davis. The Yankees supplemented a bullpen that ranks fourth in ERA and WHIP, and second in K/9, with Sonny Gray and David Robertson. Sean Doolittle and Brandon Kintzler were sent to the Nationals to help solve their bullpen issues which have resulted in the second-worst ERA in the league. On the same day that Lance McCullers was placed on the 10-day DL, the Astros traded for Francisco Liriano to add some stability to their rotation/bullpen as they are all but guaranteed a postseason spot.

But every year, we hear talk about which teams will buy or sell. The teams who have little to no shot of making the postseason, are obviously more likely to sell. The decision-making gets interesting when looking at teams that are “on the bubble.” Front offices must decide whether to go all-in for the current year, possibly giving up young prospects for proven stars to fill needs they see in their team, or to take the seemingly less-risky route of keeping your prospects and attempting to fill your needs with lesser players on the trade market and hope that it’s enough to make a run in the postseason. And if it doesn’t work out, at least you didn’t give up your future stars.

This is the conventional wisdom that’s being challenged by some teams, and needs to be examined more. The truth about the postseason in professional baseball is that you don’t know when you’ll have that chance again, no matter how many top-100 prospects you have. The Washington Nationals infamously shut down Stephen Strasburg in 2012 following the logic that it would be better to save their starter for future postseasons rather than “risk it” that year. And of course, the Nationals have not won a postseason series since. Had they managed Strasburg so that he could have pitched into October, who knows what would have happened. Win probabilities show that is far easier to predict who will make the playoffs then what will happen once those teams get there. So if you have a chance to make the playoffs, you should go all-in for it.

This is exemplified by the win probabilities calculated at FiveThirtyEight.com. As of this article’s writing, the Dodgers have a greater-than 99% chance of winning their division, and a 23% chance of winning the World Series, and the same can be said about the Astros. The Nationals, Indians, and Cubs all have a ten, nine and eight percent chance of winning the Fall Classic, respectively. But all three of those teams have an 84% chance or better of making the playoffs. The point is, you could be the Dodgers or the Astros and be having a historic season, and still “only” have a 23% of winning the World Series. Now, this year is unusual. Typically, even when baseball teams are really good, their World Series chances are less than 20%. Comparing this to basketball, the Warriors, dominating the NBA in a similar fashion that the Dodgers and Astros are in the MLB, had a 48% chance of winning the title at a similar point in their season. So even when there seems to be a lack of parity in the game, baseball’s postseason still has a relatively higher level of unpredictability. These win probabilities are the data that should be driving the decisions of teams as they near the deadline, particularly if they have even a small chance of getting to the playoffs. Because you can never have enough talent to guarantee a chance to win the pennant or the World Series.

Obviously, these decisions are limited by payroll and the contracts of the players you have at the time. But the overall idea that a team who has a small chance should wait and build even more so that they have an even better chance of making the playoffs the next year or some other year down the road — it needs to go. The Dodgers were smart to add a great starting pitcher in Yu Darvish despite already having arguably the best staff in baseball. And the Yankees and Cubs were smart to bolster their previously strong bullpens. What is interesting is that, once again, the Nationals, who have one of the worst bullpens in the league, did not push harder for Sonny Gray or Justin Wilson. They got Sean Doolittle, who is good (4.10 ERA and 0.3 WAR in 2017 according to bbref.com) and Brandon Kintzler, who has been slightly better (2.78 ERA and 1.2 WAR in 2017). It’s also interesting to see that the Red Sox, whose offense ranks 23rd in wRC+, did not go after more hitters close to the deadline, and settled for reliever Addison Reed from the Mets. The Red Sox currently have a 6% chance of winning the World Series according to FiveThirtyEight. If their offense doesn’t pick up, their reluctance to find that power bat could be the difference.

But the Rockies, who currently have a 2% chance of winning it all and whose relievers’ ERA ranks 23rd at 4.52, acquired Pat Neshek and his 2.1 WAR from the Phillies. The Diamondbacks added J.D. Martinez to a powerful lineup that likely has more in them than they’ve showed recently, seeing that they are fifth in hard-contact percentage, but 16th in wRC+. Both of these are smart moves by the front office; on the other hand, Mike Rizzo of the Nationals and Dave Dombrowski of the Red Sox will have some questions to answer if their teams don’t make decent runs into the postseason.

Hopefully, we continue to see more teams who have at least a 2 or 3% chance of winning the World Series go all-in at the trade deadline. I’m not claiming that the reasons other teams weren’t more aggressive at the trade deadline are because they’re concerned about losing prospects, but it is worth noting that teams often make the mistake of not going all-in because they don’t believe they have a high enough chance of winning it all, when the reality is that you don’t. You just need a somewhat reasonable path to the playoffs, where the x-factor of unpredictability comes into play and anything can happen.