-Yes, I know Matt Kemp should be ready by the start of 2014 to play center field.
-Yes, I know the Dodgers already have four outfielders, three of which have massive contracts, and three of which are injury prone.
-Yes, I know Ellsbury is injury prone. This example is operating in a vacuum.
-No, I don’t think the Dodgers will end up signing Ellsbury. There are just too many things that need to happen in order for the signing to make sense. And even then, depending on contracts, the signing STILL might not make sense due to Ellsbury’s injury history, along with how much money the Dodgers would have to eat on the contracts of their traded outfielders, and how badly that money would hamstring them for the future.
Okay. Now that we’ve gotten that cleared up, let’s begin.
The Los Angeles Dodgers, when healthy, have one of the best offensive outfields in the league. But, despite having a couple gold glove winners out there, they lack something when it comes to the fielding department, specifically in center field.
In 2013, the Dodgers trotted out five different players for a combined total of 1450.1 innings in center field, with Andre Ethier (645.1) and Kemp (576.1) getting the lion’s share of playing time. Now, Kemp hasn’t looked awful in center field (besides running into walls, which we’ll cover in a second), but UZR has less-than-friendly reviews on him. With Ethier, he looked somewhat usable while healthy in center, but just looked bad in the NLCS while trying to play with one good ankle. For the record, UZR gives Ethier a -1.8 for his efforts this season. The other three that played center for the Dodgers this season were Skip Schumaker (167 IP, -1.3 UZR), Yasiel Puig (55.1 IP), and Nick “Chili” Buss (6.1 IP). Schumaker shouldn’t be a starter, Puig’s natural position is right field, and I’m not even going to talk about Buss being in there as a viable option.
So, that brings us to comparing UZR for Kemp and Ellsbury.
Year
Kemp (IP, UZR)
Ellsbury (IP, UZR)
2009
1355.1, 3.2
1302.2, -9.7
2010
1346, -25.8
104.2, 1.3
2011
1380, -4.8
1358.1, 16.0
2012
911, -9.0
611.1, 3.0
2013
576.1, -16.2
1188.1, 10.0
If we take the three seasons with the greatest sample size, Ellsbury is clearly the optimal choice in the field. Granted, he doesn’t have the arm strength that Kemp has, but UZR factors that into its ratings as well. The signing of Ellsbury to play center field would likely move Kemp to left, and would make Ethier and Carl Crawford expendable. Moving Kemp to left field also saves him from the rigors of center field that have plagued him over the past couple years.
Offensively, the acquisition would be relative. Yes, Ethier would probably hit more home runs, but Ellsbury would offset that with stolen bases. In 2013, Ethier posted a wRC+ of 120 without being able to hit lefties at all (wRC+ of 73 vs LHP) and Ellsbury wasn’t far behind with a 113 RC+ and troubles against lefties of his own (w RC+ of 78 vs LHP). Ellsbury represents more of an upgrade in speed over both Crawford and Ethier, and would give the offense a new dynamic to go with Puig atop the order in front of Hanley Ramirez, Adrian Gonzalez, Kemp, and newly-signed Alexander Guerrero.
Given what a healthy Kemp has meant to this team in the past (which was just as recently as April, 2012), he is arguably the most important piece in their lineup. If moving him out of center field and into left field can save him from some of the numerous hamstring and shoulder injuries that he has experienced, it would be a huge win for the Dodgers to finally acquire a proper center fielder without giving up any value on offense.
Rotograph’s venerable duo Mike Podhorzer and David Wiers recently contemplated aloud a new statistic, formulated by Ron Shandler, that replaces Wins (W) and Quality Starts (QS) by simply adding the two (W+QS). Chandler decided to use this approach in monthly fantasy leagues, and its useful to look at how using this combination could best be used to solve an implacable problem, the overall crappiness of using wins to evaluate a pitcher’s ability.
W+QS is interesting because it weights QS more than W, since a pitcher usually has considerably more QS than W. With a mean of 19 QS and only 12 W, a starting pitcher is more likely to throw at least six innings with 3 earned runs or less than he is to get the W. Wins are capricious and depend greatly on the pitcher’s offensive support. As a way to measure a pitcher’s ability, one might argue that wins are a waste of time. In fantasy baseball, a pitcher is most often valued by his ERA, WHIP, number of Ks and W and Saves. Some more progressive leagues use QS in place of the W.
As evidenced by the table below, ranking a pitcher by W+QS instead of wins alone certainly helps many a fine pitcher, especially James Shields, who leads the league in QS but only is ranked 38th in wins, while also penalizing others like Shelby Miller who has even more wins (14) than quality starts (12). Stephen Strasburg and Cole Hamels see the greatest percent increase jumping from wins to QS+W, while Jeremy Hellickson and Shelby Miller’s total changed the least.
Conversely, Shelby Miller and Jeff Locke saw the greatest increase from quality starts to W+QS, again showing that Mr. Miller, while pitching well his first full season, got the W more often that he made a quality start. A quick glance at his game log shows the innings-limited young pitcher often earned the win when pitching less than the 6 innings needed to record a quality start.
Comparing Wins, Quality Starts, and Wins + Quality Starts
Name
W+QS Rank
W Rank
Change in Rank
W
QS
W+QS
% Change from W to W+QS
% Change from QS to W+QS
Max Scherzer
1
1
0
20
24
44
120
83
Adam Wainwright
2
3
1
18
26
44
144
69
Clayton Kershaw
3
8
5
15
26
41
173
58
Jordan Zimmermann
4
2
-2
19
21
40
111
90
C.J. Wilson
5
5
0
17
23
40
135
74
Bartolo Colon
6
4
-2
17
22
39
129
77
James Shields
7
38
31
12
26
38
217
46
Cliff Lee
8
12
4
14
23
37
164
61
Patrick Corbin
9
17
8
14
23
37
164
61
Chris Tillman
10
7
-3
16
20
36
125
80
Bronson Arroyo
11
20
9
14
22
36
157
64
Jon Lester
12
10
-2
15
20
35
133
75
Kris Medlen
13
16
3
14
21
35
150
67
Doug Fister
14
21
7
14
21
35
150
67
Hisashi Iwakuma
15
26
11
13
22
35
169
59
Madison Bumgarner
16
27
11
13
22
35
169
59
Mike Minor
17
31
14
13
22
35
169
59
Jarrod Parker
18
42
24
12
23
35
192
52
Anibal Sanchez
19
11
-8
14
20
34
143
70
Mat Latos
20
15
-5
14
20
34
143
70
Yu Darvish
21
28
7
13
21
34
162
62
Hyun-Jin Ryu
22
29
7
13
21
34
162
62
Justin Verlander
23
33
10
13
21
34
162
62
Chris Sale
24
45
21
11
23
34
209
48
Jorge De La Rosa
25
6
-19
16
17
33
106
94
Jhoulys Chacin
26
14
-12
14
19
33
136
74
Felix Hernandez
27
37
10
12
21
33
175
57
Travis Wood
28
66
38
9
24
33
267
38
Zack Greinke
29
9
-20
15
17
32
113
88
Justin Masterson
30
19
-11
14
18
32
129
78
Lance Lynn
31
24
-7
14
18
32
129
78
Jose Fernandez
32
36
4
12
20
32
167
60
Derek Holland
33
54
21
10
22
32
220
45
Ervin Santana
34
67
33
9
23
32
256
39
Cole Hamels
35
74
39
8
24
32
300
33
Jeremy Guthrie
36
23
-13
14
17
31
121
82
Julio Teheran
37
30
-7
13
18
31
138
72
R.A. Dickey
38
34
-4
13
18
31
138
72
Rick Porcello
39
35
-4
13
18
31
138
72
Gio Gonzalez
40
47
7
11
20
31
182
55
Homer Bailey
41
48
7
11
20
31
182
55
Mike Leake
42
18
-24
14
16
30
114
88
CC Sabathia
43
25
-18
14
16
30
114
88
Ricky Nolasco
44
32
-12
13
17
30
131
76
Mark Buehrle
45
43
-2
12
18
30
150
67
Hiroki Kuroda
46
46
0
11
19
30
173
58
Wade Miley
47
58
11
10
20
30
200
50
A.J. Griffin
48
22
-26
14
15
29
107
93
Scott Feldman
49
40
-9
12
17
29
142
71
Andrew Cashner
50
53
3
10
19
29
190
53
Kyle Lohse
51
55
4
10
19
29
190
53
John Lackey
52
57
5
10
19
29
190
53
Eric Stults
53
60
7
10
19
29
190
53
Matt Harvey
54
65
11
9
20
29
222
45
Dillon Gee
55
41
-14
12
16
28
133
75
Wily Peralta
56
51
-5
11
17
28
155
65
Andy Pettitte
57
59
2
10
18
28
180
56
Miguel Gonzalez
58
61
3
10
18
28
180
56
Felix Doubront
59
49
-10
11
16
27
145
69
Yovani Gallardo
60
50
-10
11
16
27
145
69
Kyle Kendrick
61
64
3
10
17
27
170
59
Matt Cain
62
75
13
8
19
27
238
42
Shelby Miller
63
13
-50
14
12
26
86
117
Ubaldo Jimenez
64
39
-25
12
14
26
117
86
Bud Norris
65
62
-3
10
16
26
160
63
A.J. Burnett
66
68
2
9
17
26
189
53
Jose Quintana
67
69
2
9
17
26
189
53
Jeff Samardzija
68
76
8
8
18
26
225
44
Kevin Correia
69
70
1
9
16
25
178
56
Joe Saunders
70
52
-18
11
13
24
118
85
Tim Lincecum
71
63
-8
10
14
24
140
71
David Price
72
73
1
8
16
24
200
50
Stephen Strasburg
73
79
6
7
17
24
243
41
Jeremy Hellickson
74
44
-30
12
11
23
92
109
Jeff Locke
75
56
-19
10
13
23
130
77
Dan Haren
76
72
-4
9
14
23
156
64
Ryan Dempster
77
77
0
8
14
22
175
57
Edwin Jackson
78
78
0
8
14
22
175
57
Jerome Williams
79
71
-8
9
11
20
122
82
Ian Kennedy
80
80
0
6
13
19
217
46
In fantasy, the 5 categories are meant to evaluate the overall value of a pitcher, and players that are best able to predict future value can win serious jelly beans. A pitcher accumulates Ks by defeating individual batters, while a low WHIP indicates that he can avoid putting opposing players on base. ERA evaluates a pitcher’s run prevention skill. Saves and wins are meant to measure a pitcher’s ability to dominate opposing teams, whether for an inning or an entire game. However, wins compare poorly with quality starts and W+QS when correlated with commonly used pitching statistics.
The chart below shows the correlation between wins, quality starts, and the combination of the two with other commonly used pitcher evaluation metrics. By calculating the correlation between these 3 categories and other pitcher metrics such as FIP, OPS allowed, batting average against, homeruns allowed per 9 innings, and runs above average by the 24 base/out states (RE24), we can measure not only the relationship between the variables, but also how much they differ from each other.
None of these statistics correlate as well with wins as they do with quality starts and W+QS. In fact, the difference between QS and W+QS is negligible in every case. This result makes sense—since QS make up the majority of the W+QS total, the two are almost identical in the chart. The actual values of each correlation are less important that the overwhelming conclusion that wins do not have much to do with pitcher skill, while the difference between QS and W+QS is negligible.
Why, then, might it be useful to use W+QS? These results show that it may not be very different from using quality starts, but is far more reliable way to judge a pitcher’s performance than wins alone. W+QS double count the games when a pitcher goes somewhat deep into a game, pitches fairly well (3 ER or less), and exits the game while leading his opponent. This scenario might not be much different than the QS by itself, but it does retain an element of “winning the ballgame for your team”, which is what the win category somewhat accurately captures. A winning pitcher is generally on a winning team, although that statement may not mean much.
W+QS may be an unnecessarily complicated way to repeat the same evaluation standards as quality starts, but some players may prefer it simply because it retains the W while relegating it to a position of less importance. Maybe owning a great pitcher like James Shields doesn’t have to be so frustrating after all.
Previously, I took a look at the benefits of a legally nebulous, but somewhat unlikely nine-man defense. In this piece, we’ll look at a group of other tactics that can be employed in the new one-game Wild Card Round that the MLB has created. This time, we’ll take a more traditional “outside the box” approach, if such a thing is possible.
With the addition of the new playoff round comes the opportunity for roster gaming. Being AL-centric here for a moment, we saw this last year in particular on the AL side. While the other three teams (Cardinals, Braves, Rangers) selected 3 starting pitchers to their Wild Card roster, the Orioles went with only 1, Joe Saunders. Sure, Arrieta, Hunter, Matusz all had starts in the year, but by September they were all in the pen. This freed up some roster room for Buck, which he primarily filled with other relief pitchers.
Now, that’s not the worst idea in the world, but given the uniqueness of the one-game playoff, why not make unique roster decisions?
First, as I mentioned above. The selection and usage of pitchers seems paramount. I’m of the opinion that one should almost play the entire game as if it were a game in extra innings. Limit your pitchers to 2 innings or so, potentially even starting with your closer. Now, that gets into the mental preparedness issues as to whether or not a closer could appreciate or handle coming into a game in the first inning. However, if he were aware that he is only going to be pitching the first inning, perhaps this may not be as big of an obstacle.
The main benefit to this is that you are able to rest your starters for a potential 5-game series against the best team in the league. Additional benefits exist in the ability to play matchups, and remove a pitcher who gives up more than a run or two. I would imagine this would result in selecting mostly (all?) relief pitchers, with an “emergency” starter, similar to how the All-Star Game has worked as of late. I would imagine employing this strategy would lead you to want to carry 11 or 12 pitchers on your roster. That may limit your options for position players, which brings us up to point two.
Second, depending upon the comfort one has with their team’s starting lineup, the logical roster choice is to select speed. In a one-game scenario, the likelihood of needing a hot bat to add to the lineup is low, and the value of a stolen base, potentially late in the game, can be incredibly high, as we saw in the 2004 ALCS. Perhaps the inclusion of an emergency catcher would be a good idea, if you’re one of those who lives in perpetual fear of random foul tips and collisions.
The third and final element is for managers and players to put their ego at the door. Here we live in the age of the immense infield shift, with the third baseman playing behind second base in some instances. In a one-game playoff, the correct move is for the player to bunt the ball down the line where no defensive player exists. Sure, I agree that over the long term of a season, you’re better off with the potential for a double or home run, but given the difference in value of having a player on the bases in one game (plus the potential that for the next at bat, the defensive team would not shift as dramatically) increases the likelihood of success for the team as a whole. And besides, it even opens up the opportunity for the rare bunt double. I’m not the first to make this argument, though. This has existed since at least the 1946 World Series, when Ted Williams was out-dueled by Manager Eddie Dyer of the Cardinals. For the record, Williams batted .200 that Series, with all of his hits being singles.
Ultimately, this boils down to one thing: small ball is the name of the game. Even teams full of power hitters can benefit from not having to rely on the long ball to win a ball game, especially one as important as the Wild Card Game. We only have to look back one year to see an example of a power team’s bats going cold at just the wrong time, with the Rangers, the MLB’s best offense in runs per game, only able to put together one run, while their opponents scored five with only one extra-base hit (and three sacrifices!).
What do FanGraphers think? What strategies that are not typically employed would be worth the effort in a one-game playoff?
I’m generally opposed to the sacrifice bunt, except in the rarest of circumstances. This less than optimal strategy is utilized even more in the playoffs. Derek Jeter, the all-time leader in playoff sacrifice bunts with 9, bunts almost twice as frequently in the playoffs as the regular season. That in itself should tell you that managers tend to go bunt-happy in the postseason since Jeter is a career .308/.374/.465 playoff hitter. I used Win Probability Added (WPA) and Run Expectancy (RE) in my calculations. For the record, the sum of Jeter’s sacrifices is -0.13 WPA and -1.88 RE. Anyways, here’s the list of the five worst playoff sacrifice bunts since 2002. Data is provided by Baseball Reference’s Play Index.
5. Daniel Descalso 2012, NLDS, Game 1. The Cardinals were losing to the Nationals 3-2 in the 8th when Descalso came to the plate with Adron Chambers on first and Tyler Clippard on the mound. Descalso laid down a bunt, sending Chambers to second. WPA: -0.04 RE: -0.19. Pete Kozma and Matt Carpenter would be retired, and the Nationals would go on to take Game 1. Descalso would hit two home runs in the series.
4. Eric Bruntlett 2004, NLCS, Game 6. Down 4-3 in the 9th, the Astros pinch-hitter faced Cardinals closer Jason Isringhausen with Morgan Ensberg on first and no outs. Bruntlett had 4 home runs and a 111 wRC+ in 61 regular-season PA, but a go-ahead home run was not on manager Phil Garner’s mind. Bruntlett bunted Ensberg to second. WPA: -0.05RE: -0.21. After Craig Biggio flew out, Jeff Bagwell would deliver a game-tying single, but the Cardinals would eventually win it in the 12th. Though I’m not a fan of judging decisions based on results rather than process, you could say that this decision “worked.”
3. Brad Ausmus 2005, WS, Game 4. The Astros were trailing 1-0 when Jason Lane led off the bottom of the 9th with a single off White Sox closer Bobby Jenks. The 36 year-old catcher had posted a .351 OBP in 2005, one of the best marks of his career. Nevertheless, he sacrificed on the first pitch he saw, moving Lane to second and decreasing the Astros’ chance of scoring. WPA: -0.05 RE: -0.21. Pinch hitters Chris Burke and Orlando Palmeiro would be retired, and the White Sox took game 4 on their way to winning the series.
2. Elvis Andrus, 2010 ALCS, Game 1. The Rangers shortstop came to the plate against Mariano Rivera in the bottom of the 9th inning, with the Rangers trailing 6-5 and Mitch Moreland on first with no outs. With the count at 1-2, Andrus got down a bunt, sending Moreland to second. WPA: -0.06 RE: -0.22. Rivera would strike out Michael Young and get Josh Hamilton to ground out, ending the game. This bunt is even worse than the numbers because of the 1-2 count on Andrus and the fact that there was little to no risk of grounding into a double play, as the speedy Andrus had just 6 GDP in almost 700 PA. I should add that noted lover of bunting Ron Washington was managing the Rangers, who have had the most sacrifice bunts in the AL during his tenure.
1. Danny Espinosa, 2012 NLDS, Game 1. The Nationals were trailing the Cardinals 2-1 in the top of the 8th. With Ian Desmond on first and Michael Morse on third and no outs, Espinosa came to the plate, facing Cardinals reliever Mitchell Boggs. Espinosa was 0-3 on the day with 3 strikeouts. He still had some pop though, as he had 17 home runs on the season. For whatever reason, on an 0-1 count, Espinosa tapped a bunt to Boggs, advancing Desmond to second. WPA: -0.09 RE: -0.44. The next hitter, Kurt Suzuki, would strike out. Fortunately for Espinosa and the Nationals, pinch hitter Tyler Moore would come through with a two-run single, and the Nationals would win the game 3-2.
The sacrifice bunt by a position player is almost universally a negative play, but even in the age when statistical information is readily available and most teams are employing an army of nerds, the tactic refuses to die. Perhaps it’s because “that’s the way the game was played” when many of these managers were players. Or maybe it’s the conservative nature of managers. The players usually get saddled with the blame if an opportunity with runners in scoring position is squandered after a sacrifice bunt. But if a player grounds into a double play when he could have bunted, the manager might be taking the heat. Whatever the case, expect managers to keep ordering the bunt come October.
(Author’s note: This is the first of a series in nontraditional tactics that may be advantageous in a one-game playoff scenario)
It certainly wouldn’t be earth-shattering for me to tell you about baseball being heaped in tradition. In fact, to most of us, that’s the appeal. The tradition. The consistency. The ability to reconnect with old times, making the comparisons between Manny Machado and Brooks Robinson without fear of having to factor in the large changes of the game. The traditionalists out there, the ones who surely disagree with interleague play, and maybe even the designated hitter, make up a large part of the viewing audience. Unfortunately for them, this article is probably not for them.
With the way that sports have evolved in the past few years, the future seems to be innovation. In football, there was the Wildcat Offense, which was only outlasted by the (similarly gimmicky) Spread Offense. Of course, who can forget New Orleans opting to onside kick to begin the second half of the Super Bowl, something that “common sense” would dictate is a terrible idea? Meanwhile in hockey, Uwe Krupp, coach of the German national team has decided that when on 5 on 3 power play, he will pull their goalie. While football and hockey are more prone to innovation, it is surprising that, for the most part, baseball offense and defense is almost exactly the same as it was in 1950. Or even 1900. Sure, the traditionalists will cite the Designated Hitter, the rise of the relief pitcher who exists solely to get one out, the Joe Maddon-esque shifting that seems so prevalent. However, the shifts that we’ve seen have assumed the traditional positioning of defensive elements.
It’s time to change that.
Now, like I have mentioned, what I’m about to propose is extremely radical. The reactions I’ve gotten from people I’ve told is twofold: one group telling me that I’m an idiot and it would never work; the other telling me that I should write a letter to the manager of my favorite MLB team to ensure success in a one-game playoff (likely the best venue for such a suggestion).
It’s simple. Move the catcher. For lack of a better name, we’ll call it the nine-man defense.
“What on Earth are you talking about, the catcher can’t move, he’s there to call pitches, position his glove, and of course catch the ball!”
Relax, traditionalists. I realize the problems. The passed third strike or fourth ball, the runners on base concerns. This isn’t about that.
However, we’ve all surely seen the following: fewer than three balls or two strikes, the pitch is in the dirt, skipping past the catcher, and the ball is replaced by the umpire.
Did you see that sequence? The catcher did nothing. He sat there, providing marginal defensive benefit, while he could have been occupying valuable defensive space.
“Okay, but the rulebook says that’s how it has to be!”
Not exactly. The rule book only has a couple of fleeting references to the role of the catcher, surprisingly. The first is Rule 1.12 which cites that the catcher is allowed to have a different glove than most other positional players and section 1.16 which permits a protective mask. You’ll note a complete absence of a mention requiring that a catcher be in the catcher’s position for every pitch. Remove the mask and the glove, and your catcher is just your run of the mill positional player. The chest protector and knee pads, according to the rules, may remain on. The second section (rulebook owners or adept googlers, refer to section 4.03) references the requirement that only the catcher is permitted to be positioned in foul territory during an at-bat, and that the catcher must be positioned behind home plate. However, that does not say that a catcher is a REQUIRED fielder. I’ll leave it up to the Joe Maddons of the world to determine the optimal position of the catcher, my initial suggestion would be to place him near first base, and shift the second baseman to directly behind the bag, while moving the first baseman to the previous position of the second baseman. Perhaps there would be more value in a fourth outfielder, that discussion is beyond the scope of this hypothetical discussion.
The 9 man defense, with fewer than 3 balls or 2 strikes and no runners on.
So that’s it. That’s all the rules have to say about the catcher. It’s almost silly how few references there are to the role of the catcher in the rulebook.
“Okay, Chris. I acknowledge that there may be some value to this, but I just have to think there are entirely too many downfalls.”
As I see it, there are quite a few downfalls to the approach. The balance of trade on these downfalls as compared to the opportunity will be left up to you.
One: The associated hassle of moving the catcher from “behind the plate” to “in the field” and back (once a third ball or second strike has been thrown, or a baserunner has gotten on base.) Of course, baseball has had to deal with the complaints about long games, this does absolutely nothing to rectify it. In fact, every pitch flying to the backstop might frustrate everyone involved. Which is why it would have to be done in a one-game playoff type scenario (or series deciding game), segueing us perfectly to downside number two.
Two: The rules committee would come down hard on this loophole after the first application of the nine-man defense. There’s no getting around this. This is a nuclear defense. It’s only to be used in the most critical of situations. Indeed, even the on-field crew may have difficulty in permitting it, which brings us to point number three.
Three: The poor home-plate umpire is just left behind the plate to have to somehow deal with being directly thrown at with 90-100 MPH pitches. I feel sorry for the umpires, and this may be why I’ve gotten a less-than-receptive response from the MLB umpires I have contacted. My only remedy to this issue is a simple one: the umpire move to the side…or work on his reflexes.
Four: The defending team is now susceptible to a bunt. Now, this may seem the case, but with a fifth infielder, the corner players would be able to play a lot closer in on the infield without worrying about range as much. The additional infielder perhaps discourages the practice of bunting by having true fielders located along the baselines in a position to better field bunts. In fact, it may make the fielding of bunts simpler without the opportunity for the pitcher to collide with the catcher running out from behind the plate to field a ball.
Five: The relatively minor concerns about pitch selection and positioning. It may take some time for a pitcher to adjust, given a lifetime of throwing pitches to a target, but it is not unreasonable to think that pitches could be called from the dugout, or even the catcher positioned in the field. As for targeting, I would hope that is something that the team would address with their pitching staff before implementing such a plan.
That’s it. For many, even the non-traditionalists, I realize this is a quantum leap in the defensive mentality of baseball teams, normally limited to an infield shift, or the ever-so-rare 5-infielder-2-outfielder-hope-to-keep-the-ball-in-the-infield-to-save-the-game-in-the-ninth defense. And sure, the rules committee may take exception, but in a one-game playoff, which MLB has tacitly admitted an affinity for (by forcing an annual one-game playoff), this seems like it would certainly cause a buzz about October baseball. And after all, isn’t that the point?
Since 2002 (the batted ball era), the Colorado Rockies pitchers have the 4th highest groundball percentage in the MLB. On its face, this seems like a good strategy, as Coors Field has an effect on batted and thrown baseballs that is not pitcher-friendly. Rockies’ pitching coach Jim Wright emphasizes pitching down as key to the success of the staff. However, the emphasis on groundballs has caused the Rockies to get into relationships with pitchers such as Shawn Estes, Aaron Cook and Jeff Francis, hurlers that lack strikeout stuff. And lest we forget, this same club famously gave Mike Hampton, a groundball pitcher who never averaged more than 6.9 K/9, what was then the richest contract in sports history. As a consequence, Rockies pitchers have the 5th lowest strikeout rate in the MLB since 2002. Compounding this problem is the fact that the Rockies have the 6th highest walk rate. Of course, there is the counter-argument that it is harder for pitchers to get strikeouts at Coors Field due to the effect that the altitude has on offspeed pitches. Additionally, it would seem that a pitcher could be forgiven for nibbling a little at the high altitude. I did a little research to determine how much of the poor strikeout and walk rates are due to Coors Field and how much could be attributed to the pitching style the Rockies advocate. I found that only three teams have higher walk rates in road games, and only four teams have lower strikeout rates. So Coors Field is not entirely at fault for the lack of strikeouts and proliferation of walks.
Since 2002, Coors Field has the second-highest HR/FB ratio behind only the Reds’ Great American Ballpark. I took a look at the Home/Away splits of the five parks with the highest HR/FB ratios since 2002 to see if they tried to combat the longball in a style similar to the Rockies.
HOME
Team
HR%
HR Per Contact
HR/FB
GB%
BABIP
K/9
BB/9
xFIP
ERA
League
2.6
3.6
10.2
44.3
0.291
7.0
3.1
4.14
4.06
Reds
3.4
4.6
12.8
42.5
0.291
7.0
3.0
4.21
4.42
Rockies
3.0
4.0
12.5
46.3
0.311
6.4
3.3
4.27
4.96
Blue Jays
2.9
4.0
12.1
46.2
0.292
7.1
3.1
3.93
4.27
Phillies
2.9
4.1
12.1
44.8
0.288
7.4
2.9
4.08
3.99
Orioles
3.1
4.2
12.1
44.0
0.294
6.4
3.5
4.51
4.61
AWAY
Team
HR%
HR Per Contact
HR/FB
GB%
BABIP
K/9
BB/9
xFIP
ERA
League
2.7
3.0
10.7
43.8
0.296
6.7
3.4
4.36
4.45
Reds
2.7
3.7
10.5
43.4
0.299
6.5
3.4
4.41
4.43
Rockies
2.5
3.4
10.0
44.9
0.297
6.5
3.7
4.48
4.56
Blue Jays
2.7
3.7
10.8
43.4
0.300
6.5
3.7
4.56
4.48
Phillies
2.6
3.6
10.3
43.9
0.295
6.8
3.2
4.24
4.21
Orioles
2.9
4.0
11.2
45.1
0.294
6.5
3.5
4.39
4.91
OVERALL
Team
HR%
HR Per Contact
HR/FB
GB%
BABIP
K/9
BB/9
xFIP
ERA
League
2.7
3.7
10.4
44.0
0.294
6.9
3.3
4.24
4.24
Reds
3.0
4.1
11.6
42.9
0.295
6.8
3.2
4.31
4.42
Rockies
2.7
3.7
11.2
45.6
0.305
6.5
3.5
4.38
4.76
Blue Jays
2.8
3.9
11.4
45.6
0.293
6.8
3.3
4.08
4.26
Phillies
2.8
3.8
11.2
44.3
0.292
7.1
3.0
4.09
4.09
Orioles
3.0
4.1
11.5
43.7
0.297
6.4
3.6
4.54
4.76
So the Rockies strategy of pitching to groundballs has led to some success in limiting longballs. Among these teams, only the Blue Jays can match the Rockies HR Per Contact rate for home games. The Rockies overall HR rate and HR Per Contact rate is league average, thanks to a road HR rate that only two teams can best. Unfortunately for the Rockies, home runs are not the whole story, and their team xFIP and ERA are 7th and 11th worst on the road. Overall, their team xFIP and ERA are 8th and 2nd worst. The Phillies, Blue Jays, and Reds all have strikeout rates at or above league average. Since 2008, the Blue Jays and Reds have stepped up their strikeout efforts. Meanwhile, the Rockies are 29th in strikeout rate in 2013.
Don’t be fooled by the recent success of Jhoulys Chacin and his HR/FB ratio of 4.9%, the Rockies need to focus more on strikeouts than groundballs. While groundballs have helped limit home runs, the Rockies are still giving up plenty of hits, walks, and runs. Strikeouts need to enter the equation for the Rockies staff to be successful. For a couple of years they had the perfect marriage of both with Ubaldo Jimenez, but none of the three pitchers obtained in the trade with the Indians (a well-timed one) has panned out. Perhaps if the Rockies acquired strikeout pitchers, they could configure their rotation so that those pitchers threw more innings on the road. It’s not as if they haven’t utilized a non-traditional approach with their pitching staff before. The Rockies probably shouldn’t spend 250 million to acquire strikeout pitchers like the Yankees did with C.C. Sabathia and A.J. Burnett when they moved into the cozy confines of the new Yankee Stadium. More than twelve years later, the Mike Hampton signing still has a bad taste in their mouth. However, there is precedent for developing and acquiring strikeout arms at an affordable cost.
Look at the Reds. Since Walt Jocketty took over as GM in 2008, the Reds have managed to develop and acquire strikeout arms as a means to limit runs in homer-happy Great American Ballpark. The 2013 Reds are 4th in K/9 and 4th in xFIP and ERA. Aaron Harang’s contract was bought out once his strikeout stuff diminished. Homegrown product Tony Cingrani has been striking out hitters at an incredible rate in his first 100 innings with the big league club. The organization’s patience with Homer Bailey has been rewarded. Edinson Volquez posted excellent strikeout rates before being used to acquire Mat Latos and his devastating slider. And of course, they signed the flamethrowing international free agent Aroldis Chapman. While rotation mainstays Mike Leake and Bronson Arroyo are never going to blow anybody away with their stuff their ability to limit walks has allowed the Reds to rely on them as back-end innings eaters. Chapman’s 6 years/30 million is the biggest commitment to any of the above pitchers.
Currently, the Rockies farm system is not loaded with strikeout pitchers. Tyler Matzek is intriguing, but his strikeouts are way down this year as he has moved up a level and attempted to improve his control, and he is far from a sure thing. Tyler Chatwood has shown some promise at the big-league level, but his secondary pitches will have to be refined for him to have long-term success. Chad Bettis was blowing away Double-A hitters before a recent callup, but his innings against MLB competition have been predictably average. Most likely, this is not a quick fix, but more of a long-term strategy which will have to be implemented across several drafts.
‘Pitching to contact’ and ‘throwing ground balls’ are classic baseball buzzwords. Twins pitching coach Rick Anderson has essentially built a career around this philosophy. It seems like every time a young pitching phenom arrives and starts striking hitters out, people start talking about how he needs to pitch to contact. The strategy has been around since this guy played, and while Kirk Rueter pitched in his last game in 2005, Kevin Correia is still hanging around and Jeremy Guthrie signed a three-year deal last offseason. And, lest we forget, Aaron Sele got a Hall of Fame vote. To take a more in-depth look at the merits of pitching to contact I grouped all 394 starting pitchers from 2002 onward (the batted ball era) who had thrown 200 or more innings, and organized them by Contact% into eight groups. The following spreadsheet details the results of my study. Groups 1-4 are classified as contact pitchers, while groups 5-8 are strikeout pitchers.
Group
Contact range
xFIP-
ERA-
WAR/200 IP
RA9-WAR/200 IP
GB%
K%
BB%
HR%
BABIP
FB velo
FB%
Pitches/IP
MLB
80.0—82.2
101
103
2.4
2.3
43.0
16.8
7.9
2.8
0.295
90.3
59.3
16.2
Group 1
85.2—89.9
109
112
1.7
1.5
44.7
11.8
6.8
2.9
0.299
89.2
64.3
15.8
Group 2
84.0—85.2
106
110
2.1
2.0
43.7
13.8
7.2
2.8
0.300
89.6
61.7
16.0
Group 3
83.1—84.0
106
112
2.0
1.7
44.0
14.6
7.3
2.8
0.295
89.3
59.0
15.9
Group 4
82.1—83.1
105
110
2.4
2.0
42.4
15.6
7.6
2.8
0.299
89.4
60.1
16.2
Group 5
81.0—82.0
105
106
2.3
2.3
42.4
16.8
8.3
2.7
0.290
90.0
60.3
16.4
Group 6
79.7—80.9
100
101
3.0
3.0
43.2
18.4
7.5
2.7
0.292
90.5
59.0
16.0
Group 7
78.0—79.6
98
98
3.0
3.1
43.1
19.5
8.2
2.6
0.290
91.1
58.8
16.2
Group 8
71.3—77.8
89
90
3.8
3.7
42.1
22.7
8.2
2.5
0.290
91.9
58.5
16.2
Of the Group 1 pitchers, only 5 had an xFIP- better than the league average, and only 6 had an ERA- better than league average. Two of these were posted by aging control artists Rick Reed and David Wells, who had success on the strength of their walk rates of 4.0% and 3.7%, respectively. Chien-Ming Wang rode his 59.5 GB% to a 98 xFIP- and 99 ERA-. Overall, Nate Cornejo was more typical of the group than these three. xFIP- went down with decreasing contact, and except for a small blip between groups 2 and 3 (both contact groups), so did ERA-.
There is a strong connection here between fastball velocity and contact rates, but there is also a strong connection between fastball usage and contact rates. Group 1 had both the slowest average fastballs and the highest use of fastballs. As anyone watching Gerrit Cole and the Pirates can tell, contact rate has almost as much to do with fastball usage as fastball velocity.
Though the contact pitchers had lower walk rates than the strikeout groups, their strikeout rates were far below average. The separation between strikeout and walk rates was better for the strikeout pitchers, with an average separation of 11.3, compared to 6.7 for the contact pitchers. In terms of K/BB, the strikeout pitchers posted a 2.4 K/BB, and the contact pitchers were at 1.9 K/BB. The old adage that groundball pitchers prevent home runs did not bear out. While the contact pitchers had a groundball rate of 43.7% compared to 42.7% for the strikeout pitchers, the contact pitchers had a HR% of 2.8, and the strikeout pitchers had a HR% of 2.6. Home runs are connected to contact.
The contact pitchers also slightly underachieved their peripherals. The ERA- for the contact groups was an average of 4.5 points higher than their xFIP-, while the ERA- for the strikeout groups was on average less than 1 point higher. The contact pitchers had an average BABIP of .298 compared to the .291 for the strikeout pitchers. High strikeout pitchers can often sustain slightly lower BABIP than their counterparts.
The connection between contact and efficiency is slight. The difference in Pitches/IP was the biggest between group 1 and group 5. The difference of 0.6 Pitches/IP translates to only 120 pitches per 200 IP. While the pitch count and innings limit debate has overtaken the nature of starting pitching, pitching to contact does not seem to be the answer. Teams and pitching coaches that are advocating pitching to contact as a means to pitch longer in games are essentially sacrificing a lot of quality for a tiny amount of quantity. And with 12 or 13 man pitching staffs being the rule of the day, this strategy seems absurd.
Despite mounting evidence that pitching to contact is a futile strategy, teams keep encouraging their young pitchers to stash away their strikeout stuff in the name of efficiency. Young pitchers Nathan Eovaldi and Gerrit Cole currently own the 3rd and 4th fastest fastballs among starting pitchers. Both of them, and Cole in particular, posted very high strikeout rates in the minor leagues. Yet both of them own strikeout rates well below the NL average, and Cole and Eovaldi’s respective xFIP- rates of 99 and 101 are decidedly average. I know, almost anybody with a good fastball can rack up a lot of strikeouts in the minors, and Eovaldi in particular has a limited repertoire that may keep him from reaching his potential. But shouldn’t young pitchers focus on developing strikeout pitches rather than trying to get ground balls? After all, fastball velocity peaks early and Cole and Eovaldi will probably have a tougher time getting outs on contact when they aren’t throwing 96. While Mike Pelfrey has carved out a decent career for himself, I’m sure most teams hope for more out of their top pitching prospects.
Earlier in the month I had an idea. It all stemmed from the idea of quantifying the un-quantifiable. I was going to record grit.
A lot of times we hear about how gritty a player is, but it’s tossed around with no real proof. Sure Nick Punto dives into first a lot, but is that really more gritty than stupid? Is a guy like David Eckstein really the grittiest of all gritty players, or can it be a guy we don’t really notice?
To figure all of this out I, along with some help, wrote a formula. The formula is imperfect, because of a lack of reliable sources for things like headfirst slides and broken-up double plays, but it tries and does its job. The formula is as follows:
Where InfH stands for Infield Hits and 1stS3 means first to third on a single, we have found a way to see a players GRIT (Game Rating In Testosterone.) All this stat is designed to show is who works harder to score a run for their team, it doesn’t show you who is better or worse, but it does show who tries.
Using this formula my small team of experts has found David Eckstein to have a career GRIT of 172.16, which is very impressive over a 10-year career, but it’s no Juan Pierre, who has amassed a career GRIT of, wait for it, 1582.
We also found the difference between Martin Prado and Justin Upton, who was the subject of criticism from Diamondbacks GM Kevin Towers who said he wasn’t gritty enough prior to trading him for Prado. We found out that Kevin Towers may have been wrong.
Using their numbers the formula says that Prado has put together a GRIT of 57.93 in his career, where Upton has a GRIT of 68.65, despite playing in one less season. So, Kevin Towers, you may need to rethink your strategy.
Also invented was TeamGRIT, a stat that uses numerous numbers to calculate how hard a team works for each run.
A disclaimer here before I list the GRITs: I am not trying to say that some teams work harder than others, nor am I saying that a high GRIT is more or less valuable than a low GRIT, all these numbers illustrate is that some teams are more comfortable with power numbers to win games, while others are more inclined to small ball.
The following are the AL leaders prior to games played on August 7th 2013
Royals – 90.57 (9th in wins)
Indians – 74.77 (6th in wins)
Red Sox – 73.92 (1st in wins)
A’s – 70.57 (5th in wins)
Blue Jays – 61.73 (10th in wins)
Rangers – 56.52 (4th in wins)
Astros – 55.70 (15th in wins)
White Sox – 51.62 (14th in wins)
Rays – 51.10 (2nd in wins)
Angels – 48.98 (12th in wins)
Twins – 46.97 (13th in wins)
Yankees – 45.59 (8th in wins)
Orioles – 40.49 (7th in wins)
Tigers – 30.30 (3rd in wins)
Mariners – 25.90 (11th in wins)
The most interesting numbers to me are those of the Royals and the Tigers. On opposite ends of the spectrum, one is a team that absolutely crushes the ball, everything that comes their way, the Tigers hit it, and they’re fine with it. They don’t feel the need to manufacture runs the way that the Royals do. The Royals seem to grind more to score their runs. More than any other team in the league by a large margin. They, like the Astros at 55 GRITs, are doing everything in their power to score more runs. It doesn’t always work, but there’s something to be said about a team that works to get extra runs and extra outs. If anything, they’re less comfortable with a lead than the Tigers. That isn’t to say the Tigers get lazy, just that they tend to not have to try so much.
In the NL there appears to be a negative correlation between GRIT and wins; I assure you, this is just a coincidence.
NL leaders prior to games played on August 7th 2013
Pirates – 80.83 (2nd in wins)
Rockies – 77.08 (8th in wins)
Marlins – 76.31 (15th in wins)
Brewers – 73.57 (14th in wins)
Mets – 67.33 (11th in wins)
Giants – 64.21 (12th in wins)
Padres – 62.53 (9th in wins)
Phillies – 57.06 (10th in wins)
Dodgers – 51.83 (4th in wins)
Cardinals – 47.67 (3rd in wins)
Nationals – 45.03 (7th in wins)
Cubs – 44.79 (13th in wins)
Diamondbacks – 42.38 (6th in wins)
Reds – 39.99 (5th in wins)
Braves – 31.12 (1st in wins)
The only thing these numbers definitively tell us is that there is a lot more GRIT in the American League, which is a deviation from the stereotype of hard-hitting AL clubs. The longball is less important in the American League, whereas manufacturing runs is a lot more emphasized. In the National League one team stands out from the pack: The Pirates.
They have a GRIT of 80.83 while also being in 2nd place, they are the only team in the top 5 of wins who is also in the top 5 of GRIT. The Pirates also hit a fair amount of home runs, but that’s not enough for them. They aren’t comfortable with just a lead. They want more of a lead. They try their damnedest to score more runs than anyone else by any means necessary. Is this because they spent so many years as a losing team? Possibly, but that’s just a theory.
As I said before, these numbers are not proof that any team is better than another, nor are they proof than any player is better than another, just that some teams and players are GRITtier than others.
It’s no secret that Diamondbacks GM Kevin Towers hates strikeouts. Since taking over in 2010, Towers has discarded every Diamondbacks player who struck out 100 times or more from the 2010 club that set the major-league record for strikeouts in a season by striking out 24.7% of the time. His 2013 squad’s 18.5% strikeout rate is 10th-lowest in the majors. However, the decreased strikeout rate has not resulted in increased offense. The 2010 D-Backs scored 4.40 runs per game, posting a .325 wOBA and 93 wRC+, a shade better than that of the more contact-driven 2013 Diamondbacks who currently average 4.17 runs per game with a .313 wOBA and 92 wRC+. While the 2010 team had the 4th-best walk rate at 9.5%, the 2013 Diamondbacks are just 13th at 8.1%. Though the 2010 Diamondbacks struck out more, they also walked more, and made more quality contact, as shown by a .312 BABIP% and .166 ISO which were 2nd and 4th in the majors, respectively. The 2013 team has a .301 BABIP% and .135 ISO, good for 10th and 23rd in the majors. A look at the plate discipline numbers shows that the 2013 Diamondbacks swing at more pitches out of the strike zone and make more contact on those swings than the 2010 team.
If a hitter can cut his strikeout rate while maintaining his walk rate and power production, that is special. However, there is usually a tradeoff between power/walks and contact. After all, not everyone can be vintage Albert Pujols. To dig deeper into the balance between power and contact, I separated MLB hitters by strikeout percentage into five groups, with 30 hitters per group. I limited the study to qualified hitters, to eliminate the presence of pitchers and small sample size hitters. Not surprisingly, the first group was the clear leader in home run rate.
MLB
K%
BB%
HR%
wOBA
BABIP%
WAR
Total PA
19.7
7.9
2.6
0.313
0.296
Group 1
K%
BB%
HR%
wOBA
BABIP%
WAR
Total PA
27.2
8.7
4.4
0.336
0.305
61.7
13008
Group 2
K%
BB%
HR%
wOBA
BABIP%
WAR
Total PA
20.7
8.6
2.5
0.337
0.323
65.9
12962
Group 3
K%
BB%
HR%
wOBA
BABIP%
WAR
Total PA
17.1
8.1
3.0
0.342
0.313
68.9
13510
Group 4
K%
BB%
HR%
wOBA
BABIP%
WAR
Total PA
14.3
8.5
2.4
0.342
0.313
71.5
13895
Group 5
K%
BB%
HR%
wOBA
BABIP%
WAR
Total PA
10.4
7.0
2.1
0.317
0.284
51.9
13187
I included WAR even though it includes defensive and baserunning values because I thought that the contact-heavy hitters in group 5 might make up for their offensive deficiencies by being better defenders or baserunners. However, the total WAR for each group tracked offensive production for the most part. The first four groups are very close together with regards to wOBA. As I expected, the most strikeout-heavy group owned the highest walk and home run rates. Group 2 made up for its lower home run rate with a higher BABIP%. The rates of doubles were very close in all groups, ranging from 4.5% in group 5 to 5.2% in group 3. Group 5 had the lowest homerun and walk rates. Despite group 5’s ability to put the ball in play, the contact generated was of a lesser quality due to higher contact rates on pitches out of the zone. With the exception of Edwin Encarnacion, Adrian Beltre, and Buster Posey, none of the hitters in group 5 had more than 20 weighted runs above average (wRAA). The group average was 0.9 wRAA. Though group 5 had the lowest WAR of any group by a wide margin, they had the 3rd most plate appearances.
As the above table shows, there is not a significant negative connection between higher strikeout rates and offensive production. In fact, the most contact-heavy hitters are far less productive offensively than their more strikeout-prone counterparts. Of course, the plate approach of Chris Davis would not work for Marco Scutaro and vice versa. The idea of an ideal groundball rate for individual hitters has been posited. I would suggest that there is also an ideal strikeout rate for individual hitters. The following is a list of five hitters who I believe would benefit from a more or less contact-friendly approach.
Matt Holliday has trimmed his strikeout rate from 19.2% in 2012 to 14.4% this year. However, he has also trimmed his wRC+ from 141 to 137. His BABIP% is down from .337 to .312, but this is likely due to a less formidable batted ball profile, as his xBABIP% has dropped from .328 to .304. His Line Drive/Infield Fly ratio is down from 89/11 to 58/16. Furthermore, his home runs on contact has dropped from 5.7% to 4.8% and his overall homerun rate has dropped from 4.9% to 3.5%. His flyball distance has decreased from 305.15 to 294.66. A look at the PITCHf/x data shows that Holliday is swinging more and making more contact on those swings. His Swing% has jumped from 47.2 to 49.9 and his Contact% has gone from 78.5 to 81.8. His O-contact% has gone from 65.0 to 66.1 and his Z-contact from 86.1 to 89.0. While Holliday is striking out less while walking at the same rate, his swings have been noticeably less aggressive, and his overall offensive production is down.
Mike Moustakas has reduced his strikeouts even more than Matt Holliday, going from 20.2% in 2012 to 13.6% in 2012 while essentially maintaining his walk rate. However, his offensive production is down significantly, from 90 wRC+ to 79 wRC+. His home run rate has dropped from 3.3% to 2.6%, and his home runs on contact is a paltry 3.3% compared to 4.5% in 2012. His fly ball distance has dropped to 279.2 to 274.6. Moustakas’ increased contact rate has come largely from swings on balls outside of the zone, as he has seen as increase in O-Contact% from 63.7 to 74.3. During GM Dayton Moore’s tenure, the Royals have had an emphasis on putting the ball into play. Their 16.4 K% since 2007 is the lowest in the league over that time frame. However, they have only a 92 wRC+ over that span, good for 21st in the league and their BB% of 7.0 is dead last. While the Royals’ emphasis on contact appears to have helped Eric Hosmer, its application to Moustakas has had a negative impact on his production.
Adrian Gonzalez has undergone a significant change since being traded from the Padres. While playing in the spacious Petco Park Gonzalez posted home run rates between 3.8-5.9% and walk rates of 8.2-17.5%. His wRC+ numbers ranged from 123 to 156. His home run rate dipped to 3.8% in his first year at Fenway, his lowest since his first full season, but a still solid walk rate of 10.3% and a .380 BABIP% led him to an excellent 154 wRC+. Since then, his ability to draw walks and hit for power have plummeted. From 2012 to the present, Gonzalez has a 2.9 HR% and a 6.7 BB%. While Gonzalez has posted his three best contact rates since 2011, his O-Contact% has been between 70.1 and 75.9, well above his career rate of 67.1. Though Gonzalez has slightly improved his power production from 2012, his 126 wRC+ remains a far cry from his peak years. In Gonzalez’ best years, he had strikeout rates in the 17-20% range. He can still be a productive player, but the make-contact approach has taken away much of his power and walks.
Asdrubal Cabrera is posting career high strikeout and fly-ball rates in 2013. Unfortunately for him, this approach has not led to an increased power output, as his home runs on contact, average fly ball distance, and ISO are virtually unchanged from 2012. The 22.0% strikeout rate has conspired to cut his wRC+ from 113 to 91. In an effort to hit for more power, Cabrera’s contact rate has gone from 84.0% to 78.6%, a career-low figure, and his walk rate has dropped from 8.4% to 5.8%, also a career low. Though Cabrera’s BABIP% has dropped from .303 to .286, his xBABIP% is up from .319 to .334, suggesting that he can be productive when he puts the ball in play. Not yet 28, it is time for the Indians shortstop to go back to the plate approach that made him a productive hitter in 2009-12, controlling the strike zone with a more level swing. In picture form, here is a swing from 2011 when Cabrera had a K% of 17.8 and a 119 wRC+.
Yoenis Cespedes has improved his home runs on contact from 5.9% in 2012 to 6.4% in 2013. However, because of the jump in his strikeout rate from 18.9% to 23.9% his overall home-run rate remains at 4.3% and his ISO is basically the same. His wRC+ is only 96, compared to 136 in his debut season. Cespedes is hitting more fly balls at 47.7% compared to 39.9%, and their average distance is the same, but those fly balls have come at the expense of line drives and ground balls, which has caused his xBABIP% to sink from .305 to .279 and his actual BABIP% to go from .326 to .255. Because Cespedes is relatively new to the league, I wanted to see if pitchers are attacking him differently. However, Cespedes has been pitched to in largely the same fashion as 2012, but with slightly more fastballs and less changeups. Cespedes has been less able to hit those fastballs, as he is only 0.37 runs above average per 100 fastballs, compared to 1.71 last year. Cespedes has been seeing slightly more pitches out of the zone, as his Zone% has decreased from 46.2% to 45.1%, but his O-Zone Swing% is mostly the same. For the most part, Cespedes has been getting beat in the strike zone, as his Z-Contact% down from 84.2% to 81.0%. Because Cespedes’ raw power and athleticism are so impressive, there is a temptation to be overaggressive at the plate. He will likely always be an aggressive hitter, but if he can cut his strikeout rate to his 2012 level, it will be worth the decrease in home runs on contact.
Unlike many people, I do not think that strikeouts are inherently bad. For some hitters, the increased strikeouts are the cost of home runs and walks. Other hitters would be well served to put more balls in play while suffering a loss of power. However, start implementing a one-size fits all approach of strikeout avoidance and you’ll end up like the Royals.
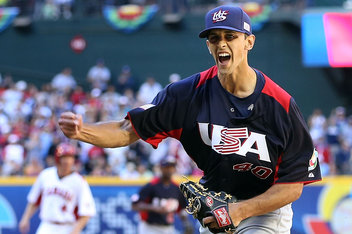
The Miami Marlins are always in the news at the Trade Deadline, and the story is no different in 2013.
Bullpen
Steve Cishek Fist Pump
The Marlins possess sought after relievers Steve Cishek, Mike Dunn, Ryan Webb, and Chad Qualls. Cishek, Dunn, and Webb still have multiple years under team control, while Qualls’ is signed on a one-year deal. Of the four, I would be most inclined to keep Cishek, who is currently closing games for the Marlins, and doing so extremely well. Qualls is the most likely to be dealt, as the Marlins don’t want to part with valuable bullpen arms who could contribute to next year’s team. Also, they don’t want to leave the young starting rotation with an inexperienced bullpen to back them up for the remainder of this season. Qualls would be a rental reliever for any team, as a 34 year-old journeyman doesn’t scream “Long-term plans”. Nevertheless, Qualls has caught fire in 2013, putting up the best season of his career. Through 42 IP in 42 Appearances, Qualls has put up a 2.57 ERA, 1.024 WHIP with a 7.29 K/9 and a 1.93 BB/9 leading to a 3.44 FIP.
The Marlins dealt relief to a contender at last year’s deadline as well, sending Edward Mujica to the Cardinals for 3B prospect Zack Cox. Mujica had a 4.38 ERA at the time he was sent to St. Louis, so Qualls’ numbers are significantly superior. However, Mujica was just 28 at the time, and still had a year of Arbitration remaining, which increased his value. All things considered, Qualls should be able to produce the same return as Mujica did, possibly more. What Mujica brought in was fairly significant. Zack Cox was the Cardinals #4 prospect heading into 2012 by Baseball America. He was drafted in the first round out of the University of Arkansas in hopes that he would develop into a premier hitter. He showed that ability during his first full minor league season in 2011, but fell off dramatically in 2012, hitting .254/ .294/ .421 in the hitter-friendly Pacific Coast League. Cardinals management decided it was time to move on from Cox, and shipped him to the Marlins, who sent him back down to AA. Cox has been solid in AA this season, hitting .292/ .393 / .391. his power numbers decreased, but he’s hitting more consistently as the Marlins are allowing him to take a slow track through the system. He has the Marlins’ future 3B job in his sights, but will be competing in the system with recent 1st round pick, Colin Moran out of UNC.
In my opinion, the Marlins sold Mujica enormously high The Cardinals’ frustration with Cox allowed him to be moved at a fairly cheap price, and it’s difficult to say that this trade is comparable to what the Marlins can get for Qualls. Nevertheless, this shows that the Marlins can target mid-level prospects (or seemingly declining former top level prospects) in exchange for Qualls.
Decision: Avoid trading Qualls for the sake of trading him. Aggressively shop him around, but if the return isn’t right (comparable to Mujica’s return), try to negotiate a 2014 contract in the off-season. Cishek, Dunn, and Webb are main contributors to the Marlins bullpen, and with the team appearing to be a contender in 2014, I would want to keep that consistency.
OF Justin Ruggiano
Veteran Position Players
The Marlins could potentially move Placido Polanco, Juan Pierre, Greg Dobbs, and Justin Ruggiano. Polanco and Pierre are signed to one-year deals, and will be Free Agents after the season. Dobbs is in the last year of a two-year contract. All four are most likely fits on the bench for a contender, and none of them would be able to bring in a significant return. Ruggiano had a breakout year in 2012, his first full season, hitting .313/ .374/ .535 in 91 games. However, he’s slumped this year, removed from his everyday role, floating around a .200 batting average. He holds the most value, as he still has another season before he’s arbitration eligible, and teams may hope that he returns to his 2012 form. However, his remaining pre-Arb year is valuable to the Marlins as well, who didn’t want to move him a few weeks ago. The Marlins called up their top two outfield prospects last week, which makes Ruggiano slightly more available.
Decision: Without much to gain in return, I’d hold on to the veterans, and try to retain Polanco, Pierre, and Dobbs for another year to serve as valuable bench players for the 2014 season.
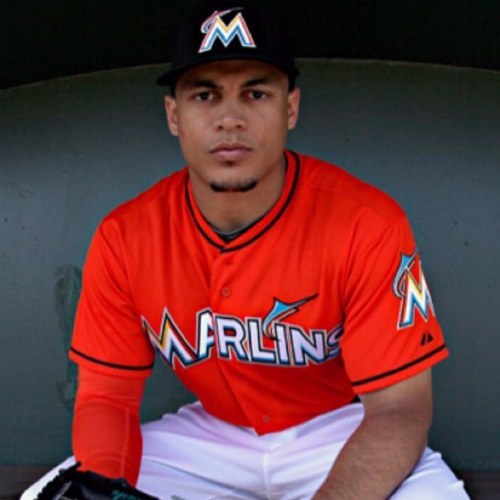
Giancarlo Stanton
The feature of this article, and many national news stories is Right Fielder Giancarlo Stanton. I’ve admittedly flip-flopped back and forth about what the Marlins should do with the face of the franchise. He’s 23 years old, and will be arbitration-eligible for the first time after this season, which will increase his salary by a couple million dollars. He led the league in slugging in 2012, and had already amassed over 100 career Home Runs. He is a budding superstar, and teams are willing to pay a very high price for him.
Keep Him
Giancarlo Stanton
The Marlins are historically known to being a penny-pinching team, but are in a position to spend big money, which they have available to give to Stanton. If the Marlins stick with Stanton, I see them avoiding arbitration this year with a one year deal in the neighborhood of $7-8MM. I then project him to earn $10-12MM after 2014, and $13-15MM after 2015. To avoid paying Stanton $13-15MM for 2016, and then have a future long-term deal based on that salary structure, I would begin working on a back-loaded multi-year deal immediately after the season. My first offer of a proposed contract would follow a similar structure to my predicted arbitration salary hike, but then level off around $17-18MM for 2016 and beyond. Miguel Cabrera, former Marlins emerging offensive superstar, signed a long-term deal with the Tigers in 2008, which levels off at about $20MM per year. In my opinion, Stanton has shown the potential to deserve a similar contract, but there is no way that I would begin the negotiations at Miguel Cabrera’s deal.
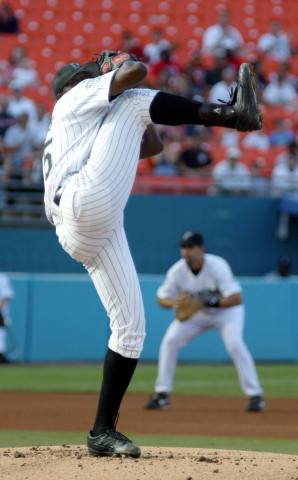
Trade Him
Dontrelle’s Delivery
Stanton’s value is as high as it’s ever been. As mentioned before, he’s an emerging superstar who is just reaching arbitration for the first time. Comparing him again to Cabrera, the Marlins traded him after the 2007 season to the Detroit Tigers along with pitcher Dontrelle Willis for the Tigers #1, 2, 6, 8 rated prospects according to Baseball America, along with other mid-low level players. The Marlins would be able to reel in at least three of a team’s top ten prospects, ideally two of the top five. In my opinion they should throw in one of the relievers teams have been calling for (preferably Qualls) to bump up the level of the prospects they would receive.
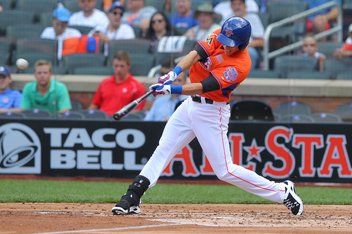
The most important thing to consider in this situation, is that the Marlins already have multiple potential replacements for Stanton. According to Baseball America, three of the Marlins’ top five prospects are outfielders, all of whom have been in the majors this season (Christian Yelich #2, Jake Marisnick #4, Marcell Ozuna #5). Beyond those three, they also feature Jesus Solorzano, Austin Dean, Brent Keys, and Isaac Galloway in a rich system of minor-league outfielders. Stanton is simply not at a premium position of need for the Marlins, which in my opinion makes him expendable. Also, the millions of dollars that would be used to lock up Stanton could be better used to lock up the Marlins phenomenal young pitching staff.
Don’t Trade Him
The rebutting argument against trading Stanton is how unpredictable trading for prospects can be. Once again, the Marlins traded Miguel Cabrera and Dontrelle Willis to the Tigers for four of their top ten prospects, including #1 and #2. A total of zero of them are still with the Marlins, and Cameron Maybin (#1) and Andrew Miller (#2) never lived up to their potential. All those two names do is make Marlins fans cringe. Bad trades happen, Major Leaguers are known commodities, while prospects are prospects, something that might be good in the future. The unpredictability and risk of trading Giancarlo is something that cannot be over-analyzed.
Decision: Make Stanton Available, and listen to offers, but don’t undersell him
Yelich at the 2013 Futures Game
If a team wants to give you their entire future, then by all means go for the trade. But if I’m Michael Hill, and I’m not receiving everything that I want from a team, then there’s no deal. If I’m trading Giancarlo Stanton to your team, I want to be able to go through your organization, and hand-pick the players I want like I’m at a buffet. If any compromise has to be made, then it’s no deal. Stanton won’t break the bank in the off-season, and it’s worth keeping him around to see if the Marlins can be truly competitive in 2014, which I believe is very possible, barring unforeseen injuries.
Needs
Jose Fernandez
The most difficult part about making trades for prospect is to decide where you need help. The Marlins are set in the outfield, no question about that. 3B seems locked down with Cox and Moran, and I’m a big fan of future Gold Glove winner Adeiny Hechavarria at SS. Derek Dietrich hasn’t been amazing at 2B, though I really like Ed Lucas. If only he wasn’t 31. Donovan Solano could still be a fit, but this is a position that could use improvement. At 1B, there isn’t much behind Logan Morrison, who is finally fully healthy. Rob Brantly has been a disappointment behind the plate after impressing at the end of 2012 after he came over from the Tigers for Omar Infante and Anibal Sanchez. Brantly is still just 24, but is hitting .232/ .283/ .294 while splitting time with Jeff Mathis. Former first round pick Kyle Skipworth hasn’t been able to hit at any level, and relying on J.T. Realmuto to be the future isn’t a safe bet. The Marlins pitching is phenomenal, led by Jose Fernandez, and followed by Nate Eovaldi, Jacob Turner and Henderson Alvarez. The Marlins also have Andrew Heaney and Justin Nicolino in the minors among others with a young pitching staff whose future is just as bright, if not brighter than the Marlins’ outfield crop.
Trade Possibilities
Chad Qualls
2B Kolten Wong
If we assume that Chad Qualls can bring in a similar return to Edward Mujica, then we’re talking a downward-trending lower high-level prospect (if such a thing exists) or a mid-level prospect. I love what the marlins did in the Mujica trade, by taking a risk on a possible high-level guy, who is having a bad season. If the Marlins deal with the Cardinals again, Kolten Wong’s name has been thrown around, as he’s blocked at the Major League level by Matt Carpenter. However, the Marlins aren’t likely to be able to put together the package for him without having to part with an integral piece. His name has been linked to a potential Alexei Ramirez trade, who holds more value than Qualls. The Marlins would have to throw in another reliever or two (Dunn, Cishek, or Webb), or maybe even Derek Dietrich who replace Wong’s spot in the Cardinals system, obviously to a lesser extent. As an outsider, it’s unclear what the asking price is for Wong, but maybe the Cardinals could sell low again. Wong is more highly regarded than Cox was at this time last year, but then again Qualls has been better than Mujica was, and the Marlins have arms to give.
Giancarlo Stanton
SS/IF Xander Bogaerts
I’m trying very hard not to be one of those internet users who has no sense of trade balance, but it would take a completely unreasonable package for me to trade Stanton right now. The Red Sox reportedly are willing to give up everything to get Giancarlo. Any deal with them would need to include Xander Bogaerts, and Henry Owens, plus much more. Bogaerts plays the same position as Hechavarria, but could move over to 2B to create a stellar middle infield that already has me excited. Bogaerts, the Red Sox #1 prospect by BA, is a 20 year old from Aruba, who has absolutely torn it up in the minors. Owens, their #5 prospect, recently turned 21, and has pitched very well at High-A Salem. The Red Sox also have C Blake Swihart at #6 who is showing an upward batting trend. Their #2 prospect, former South Carolina Gamecock standout, Jackie Bradley Jr. has already spent time in the majors, but being an Outfielder isn’t necessarily attractive to the Marlins. Again, I’d just pick out the Red Sox star prospects, and if I can’t have everyone I want, then sorry Beantown, Giancarlo will still be a Marlin.
The Pirates and Rangers have also expressed interest in Stanton. For me, the Pirates would have to part with Gerrit Cole and Jameson Taillon at least. It would create a very crowded pitching rotation for the Marlins, but is that ever a bad thing? Unfortunately for the Pirates, many of their top prospects are Outfielders which doesn’t help. The Rangers have Jurickson Profar, who has been playing 2B. However, they just traded for Matt Garza which took a hit out of their system, and don’t have many other guys close enough to being Major league ready for me to feel comfortable about.
If Stanton does get traded, I’m thinking that it’s going to be the Red Sox.