Archive for Outside the Box

The Most Perfect Career

Since you are here at FanGraphs, you likely already read August Fagerstrom’s recent piece on Getting Mike Trout to 168.4 WAR. It’s a pretty fun thought experiment, but I’d like to take it one step further and create the best possible player by using the best season in history by age. I’m not sure the exact methodology August used to get his seasons, but mine is going to use the same baseline:

  • Position players with at least 100 PAs only
  • No Bonds or Ruth (we’ll take a look at them later)
  • No duplicates, always take a players best year
  • No pre-1900 guys

I’m also not going to adjust anyone’s numbers for the time period like August, mostly because I don’t feel like it, but also so we can get some silly years that would not play today at all. Anyway, let’s create a magical mystery player!

Age 18: Phil Cavarretta – 1935

WAR: 1.2

FanGraphs’ player search is kind enough to go back to age 14, but there is no one who fits my above criteria with positive value before 18, so we’ll just ignore them. The only pre-18 player who was worthwhile at all was Bob Feller at 17, but he’s a pitcher.

As for Cavaretta, he had a decent career, although his best seasons came during World War II when the rest of the league was in the service. Cavarretta had hit for a cycle the year prior to this one, which is cool I guess, but he wasn’t all that impressive, aside from the fact that he was, from what I can tell, the only 18-year-old who started a full season. Whitey Lockman in his age 18 season was almost as valuable in one-fourth the PAs.

Age 19: Bryce Harper – 2012

WAR: 4.6

It’s amazing that, prior to this season, there were people disappointed with Bryce Harper. He had the best seasons of any teenager ever (runners up, Mel Ott and Edgar Renteria, who you never put together in your head before right now).  What else did people expect? Harper to moonlight as the Nats’ set-up guy?

Age 20: Alex Rodriguez – 1996

WAR: 9.2

You knew this guy was lurking somewhere around here. He was Bryce Harper when Harper was a toddler. It’s actually rather amazing the number of spectacular young players we’ve seen in recent years. Between Harper, A-Rod and Mike Trout, we’ve seen the four best seasons from a player younger than 22 since 1943.

Age 21: Mike Trout – 2013

WAR: 10.5

You already know about this guy. He’s pretty good I hear.

Age 22: Eddie Collins – 1909

WAR: 10.0

You think Harper and Trout are a brilliant pair of young players? Try Eddie Collins and Ty Cobb. Both were 22 in 1909 and they put up WARs of 10.0 and 9.7 respectively. Luckily (or unluckily) for American League fans, both would go on to have brilliant careers, with both in the top 15 for career position player WAR. If just one of our two youngsters puts up a career of this quality, we’ll be lucky to see it.

Collins is a bit of a forgotten man compared to Cobb, but his career ought not be. He had a career .333/.424/.429 batting line, despite playing in deadball, and he was also an elite defender at second base and an excellent base runner. He’s probably best known today for being one of the clean players on the Black Sox, which is sort of like Frank Sinatra being known for his roll in High Society.

Age 23: Cal Ripken – 1984

WAR: 9.8

Cal Ripken actually was the fifth best 23-year-old player, but the other four were good enough to appear further down the list. Not that I’m complaining, because Ripken was pretty good this year. For being a guy known for his durability, Ripken was a great young player as well; probably the best between Mays/Mantle and A-Rod.

Age 24: Lou Gehrig -1927

WAR: 12.5

I love that these two guys slot in back-to-back. I also love that Gehrig wasn’t even the most valuable player on his team in 1927, with Ruth slotting in a slightly better mark of 13.0 WAR. What an absurd team that was. Seriously, imagine that Harper and Trout were on the same team this past season. Now imagine they were 35% better than they actually were. Now imagine that this team also had Manny Machado and Jason Heyward, who are standing in for Earle Combs and Tony Lazzeri on the ’27 Yankees. Now imagine yourself, rolled up on the floor in the fetal position, weeping silently as these guys make your favorite team look like little leaguers. You think to yourself, “eventually they’ll get old and bad and my team will have a chance at a championship.” Then you wake up from your coma thirty years later and the Yankees are still the best team in baseball. Because of the next guy.

Age 25: Mickey Mantle – 1957

WAR: 11.4

Okay, the 1957 Yankees weren’t quite as good as their predecessors, losing the World Series to Hank Aaron and the Milwaukee Braves. Mantle and Berra weren’t quite Ruth and Gehrig. But they were still pretty good. Mantle put up a .512 OBP in 1957, which is silly, and would be even sillier had Barry Bonds not desensitized us from silly OBPs.

Age 26: Norm Cash – 1961

WAR: 10.6

Norm Cash is not a name you see come up very often, but for one year, he was just as good as all these all-timers. The rest of his career he was basically a 3-4 WAR player, but in 1961, Cash caught the BABIP bug. His .370 mark this year was nearly one hundred points higher than his career mark. It also helped that he hit a career high of 41 home runs.

Age 27: Ted Williams – 1946

WAR: 11.8

This was the Splender Splinter’s first year back from three years of service in WWII. Depriving us of three years of Ted Williams hitting is probably at the bottom of the list of Nazi war crimes, right next to stealing the Ark of the Covenant, but it’s there.

Age 28: Rogers Hornsby – 1924

WAR: 12.5

Okay, we’ve mentioned Collins and Cobb, Mantle and Mays, and Trout and Harper as great pairs of contemporaries, but how about Babe Ruth and Rogers Hornsby? Ruth also managed a 12.5 WAR in 1924, which is pretty funny. This was the year that Hornsby hit .424. This is also the best year for our magical mystery player. His career 104.1 WAR is basically Frank Robinson. We still have 18 more seasons to go.

Age 29: Al Rosen – 1953

WAR: 9.1

Al Rosen is sort of like Norm Cash in that he only had one season of this caliber, but, unlike Cash who played for seventeen years, he only played seven full seasons. Who knows what might have been if not for injuries and other such circumstances that cut Rosen’s career short. He was probably the best executive of the guys on this list, guiding the 1989 Giants to a pennant as General Manager.

Age 30: Ty Cobb – 1917

WAR: 11.5

I think that Ty Cobb came up the most of any player I ran into while researching this list. He was a great young player, a great old player, and a great normal-aged player. I rank Ty Cobb’s second to only Barry Bonds’ as my favorite player page to marvel at.

Age 31: Joe Morgan – 1975

WAR: 11.0

At this point, some of these legendary seasons are starting to look ordinary at this point. Only a .466 OBP? Gotta pick of the slack Joe! In all seriousness, Morgan was a great player and this was his best year. I haven’t been keeping track of stolen bases so far, but 67 at age 31 is really impressive.

Age 32: Sammy Sosa – 2001

WAR: 9.9

Sosa hit 64 dingers this season, which makes for our magical mystery player’s career high mark. Of course Barry Bonds hit 9 more than Sosa in 2001. Sosa doesn’t have a reputation as a single-season hero like Norm Cash, mostly because he was a a legitimate star for a good while, but its amazing how much this season stands above the rest in his career. The only other time he broke 6 WAR was 1998 and his 186 wRC+ is 25 points higher than any other season in his career.

Age 33: Willie Mays – 1964

WAR: 10.5

You knew this guy was going to show up sooner or later. I probably could have picked one of about a dozen Mays seasons for this thought experiment and it wouldn’t have changed the results much.

Age 34: Honus Wagner – 1908

WAR: 11.8

You probably knew this guy was going to be here as well. While his 11.8 WAR isn’t quite as high as some of the more ridiculous years from Ruth, Bonds, and Hornsby, this might have been the most dominant season ever. Joe Tinker placed second in WAR this year with 7.5. Wagner had over 50% more value.

Age 35: Nap Lajoie – 1910

WAR: 9.3

Lajoie was so good that they named the team after him. I imagine our magical mystery player would also have a team named after him at this point, as he has now passed Babe Ruth in career WAR. He still has another decade left to play. Then again, I imagine there are some obnoxious fans who think he’s done. I mean, he only hit 4 home runs this year when he hit 47 two years ago and 64 the year before that.

Age 36: Luke Appling – 1943

WAR: 7.8

Interesting run of middle infielders we’ve had here. Appling is well behind Bonds and Ruth in this age bracket, but that doesn’t diminish how great of an old player Appling was. He missed 1944 and most of 1945 to war, but then proceeded to put up four more All-Star level seasons. He would also hit a home run off Warren Spahn in 1982 at age 75.

Age 37: Hank Aaron – 1971

WAR: 7.1

This season was probably Aaron’s ninth or tenth best year, but he hasn’t been particularly close to make this list prior to this point. I guess that shows how consistent of a hitter Aaron was.

Age 38: Bob Johnson – 1944

WAR: 6.4

No, I did not make that name up. But I don’t blame you for thinking that, as Wikipedia has him listed behind thirteen other Bobs Johnson including a weatherman, a butcher, a psychiatrist, an Arkansas State Representative, three other major leaguers, and a squirrel boy.

Johnson actually was a pretty good player in his day, although this season was likely exaggerated due to the paucity of good players left in the game in 1944. That being said, he’s a pretty solid Hall of Very Good type player who had a fine season when he was 38.

Age 39: Dummy Hoy – 1901

WAR: 4.8

I swear I’m not making these up! Hoy’s nickname actually comes from the fact that he was deaf, not because he was unintelligent. In fact, it seems he was quite smart for a ballplayer at the turn of the century. Hoy was also pretty good at playing baseball, as he managed a .400 OBP despite his old age and stole 27 bases.

Wait, did I just gloss over the fact that he was DEAF! In 1901 there was a 38-year-old, deaf, All-Star level player. He produced more WAR than Ted Williams did at age 38. He also got hit by 14 pitches in this season, which my brain wanted to blame on his deafness for about a third of a second before I realized how little sense that made.

Age 40: Sam Rice – 1930

WAR: 4.6

WAR rates this as Rice’s best season in his twenty year career. It seems he never peaked and just spent his entire career as a 4 WAR type guy. It managed to get him into the Hall of Fame. Our magical mystery player at this point has a career WAR four times Rice’s career mark.

Age 41: Stan Musial – 1962

WAR: 4.0

Stan Musial hit .330/.416/.508 in 1962. That is a better batting average and on base percent than Mike Trout had this season. I think that requires no further comment

Age 42: Carlton Fisk – 1990

WAR: 5.0

Our poor magical mystery player has taken up catching for the first time in his career, here at age 42. A least he hasn’t caught 2000 games already like Fisk had. It’s actually incredible that Fisk was able to pull his broken body out of bed, let alone put up a 133 wRC+. Just to put in perspective how slim the pickins are getting, only nine players put up at least 1 WAR in their age 42 seasons. Four of them have already appeared on this list, and Barry Bonds is a fifth that I am not allowed to take. Luckily, Fisk was better than all of them with the exception of Luke Appling.

Age 43: Tony Perez – 1985

WAR: 1.5

Perez and Fisk are the only two batters to manage a 1 WAR season at age 43. Interestingly enough, Perez was not a very good old player, with his last 1 WAR season prior to this one coming at age 38.

Of note is that of the twelve players to manage 100 PAs in their age 43 seasons, eight are in the Hall of Fame. The only one who is neither in the Hall nor otherwise mentioned here is Graig Nettles.

Age 44: Pete Rose – 1985

WAR: 0.8

Pete Rose stuck around this long because he was aiming for the all time hits record. This doesn’t concern our magical mystery player, who achieved that four years ago.

Age 45: Julio Franco – 2004

WAR: 1.2

I could give this season to Omar Vizquel to allow magical mystery player to hang on with one more season from Julio Franco but I’d rather he go out with a bang. Or at least as much of a bang as a 45-year-old can provide. Franco was actually an above average hitter with a 113 wRC+ in 2004. He would hang on for three more seasons, but the rules prevent me from tacking those on here at the end. Not that it matters much, since Franco was basically replacement level from here on out.


Finally, the greatest player of all time is riding off into the sunset at age 45. How good was he? He managed 4892 hits in his career with 620 of them being home runs. His career batting line was .333/.421/.549. He played all around the field, spending at least one full season at each position. Seventeen Hall of Famers contributed to his career. Somehow, he only won 5 MVP awards (1927, 1946, 1953, 1957, and 1975).

Career Wins Above Replacement: 220.4

That’s Babe Ruth plus Will Clark or Larry Doby. Here’s his full ‘career’ if you want to call it that:

Age Player Year PA Hits Home Runs BA OBP SLG WAR
18 Phil Cavarretta 1935 636 162 8 .275 .322 .404 1.2
19 Bryce Harper 2012 597 144 22 .270 .340 .477 4.6
20 Alex Rodriguez 1996 677 215 36 .358 .414 .631 9.2
21 Mike Trout 2013 716 190 27 .323 .432 .557 10.5
22 Eddie Collins 1909 660 198 3 .347 .416 .450 10.0
23 Cal Ripken 1984 716 195 27 .304 .374 .517 9.8
24 Lou Gehrig 1927 717 218 47 .373 .474 .765 12.5
25 Mickey Mantle 1957 623 173 34 .365 .512 .665 11.4
26 Norm Cash 1961 672 193 41 .361 .487 .662 10.6
27 Ted Williams 1946 672 176 38 .342 .497 .667 11.8
28 Rogers Hornsby 1924 640 227 25 .424 .507 .696 12.5
29 Al Rosen 1953 688 201 43 .336 .422 .613 9.1
30 Ty Cobb 1917 669 225 6 .383 .429 .515 11.5
31 Joe Morgan 1975 639 163 17 .327 .566 .508 11.0
32 Sammy Sosa 2001 711 189 64 .328 .437 .737 9.9
33 Willie Mays 1964 665 171 47 .296 .383 .607 10.5
34 Honus Wagner 1908 641 201 10 .354 .415 .542 11.8
35 Nap Lajoie 1910 677 227 4 .384 .445 .514 9.3
36 Luke Appling 1943 677 192 3 .328 .419 .407 7.8
37 Hank Aaron 1971 573 162 47 .327 .410 .669 7.1
38 Bob Johnson 1944 626 170 17 .324 .431 .528 6.4
39 Dummy Hoy 1901 641 155 2 .294 .407 .400 4.8
40 Sam Rice 1930 668 207 1 .349 .407 .457 4.6
41 Stan Musial 1962 505 143 19 .330 .416 .508 4.0
42 Carlton Fisk 1990 521 129 18 .285 .378 .451 5.0
43 Tony Perez 1985 207 60 6 .328 .396 .470 1.5
44 Pete Rose 1985 500 107 2 .264 .395 .319 0.8
45 Julio Franco 2004 361 99 6 .309 .378 .441 1.2
Career 17295 4892 620 .333 .421 .549 220.4

Speaking of Babe Ruth, I almost forgot our other, very important exercise. In creating the magical mystery player, I purposely left out any seasons from Babe Ruth or Barry Bonds, who were both a completely different level of silly good. In the comments of the aforementioned article from August Fagerstrom, I took the best season between just Bonds and Ruth, much in the same way as I did with everyone else here. Now, there is a bit of smudging. Ruth’s pitching stats are included, but it’s not a whole lot. Furthermore, neither player managed 100 PAs in their age 19 or 40 seasons, but I included the best of them anyway. But here’s the player I got.

3208 hits

833 home runs

.336 batting average

.483 on-base percent

.692 slugging percent

210.0 WAR

Oh… oh my. That WAR is awfully close to our magical mystery player. And magical mystery player has 5000 more career plate appearances. If you prorate the home runs to even just 15,000 plate appearances (still over 2000 behind magical mystery player) you end up with exactly 1000 home runs. With that, I leave you with this. It is tangentially related.


Speculating the 2016 Toronto Blue Jays Lineup

We’re halfway through November and the winter meetings are right around the corner. Teams are gearing up for next year and taking a look at their rosters, deciding what direction they want their team to head. Today I want to look at the Toronto Blue Jays and hypothesize a direction they could go.

The Blue Jays had a great 2015 and continuing that momentum is crucial for the newly recharged fan base. They have a number of quality young players who contributed this past year. Kevin Pillar, Chris Colabello, Ryan Goins, Marcus Stroman, Roberto Osuna and Devon Travis (when healthy) all had nice seasons and remain under team control in some shape or form for the next 3-5 years. The Jays also have some large expiring contracts after the 2016 season in the form of R.A. Dickey, Edwin Encarnacion and Jose Bautista who have been important pieces to Toronto’s success. Add in Russell Martin, Josh Donaldson and Troy Tulowitzki and the Blue Jays should once again compete in the AL East in 2016. One of the glaring issues however is their starting rotation and bullpen.

With Marco Estrada signed the Blue Jays have a starting rotation of Dickey, Stroman, Estrada and Hutchison. Reports have come out and the Jays will reportedly have a similar budget to last year, around $140 million. After the guaranteed contracts, arbitration estimates and league-minimum salaries are accounted for the Blue Jays will have about $18-$19 million to spend on starting pitching and bullpen help. There are a number of directions the Blue Jays could go; it’s a solid class of starting pitching this year and with the $18 million left in the salary they could for sure pick up a quality starting pitcher to fill out the rotation. They could also spent the money on a lockdown relief pitcher and try to transition either Aaron Sanchez or Roberto Osuna to the rotation. Or they could split up the money and get an older starting pitcher and get whatever reliever is available for the remainder of the money. Another option, and the one that I’m going to explore, is the trade route.

With all the moves the Blue Jays made at the deadline, their farm system isn’t as strong as it was at midseason last year but the recent developments with the Atlanta Braves got me thinking about trade ideas — mainly Julio Teheran. With the Braves set to open a new stadium in 2017 the mentality has been to shed money and stock prospects for the opening season in the new stadium. This works out great for the Blue Jays who have some talent left in the farm system that could be useful to the Braves. The fourth-ranked prospect in the Blue Jays system and coincidentally the fourth-ranked catching prospect in baseball is Max Pentecost. Atlanta has been stocking arms in recent trades but with Christian Bethancourt struggling in his time in the majors, the Braves clearly don’t have a long-term solution behind the dish. The former 1st round pick, 11th overall is currently in advanced-A ball and his estimated time of arrival in the majors is 2017, perfect for their rebuilding plans. If the Jays were to include one maybe two young pitchers on a similar timeline like Conner Greene and/or Marcus Smoral, perhaps that would be enough to pluck Teheran away from Atlanta.

Teheran is only 24 years old and will turn 25 for the 2016 season. He’s owed a bargain-basement price of $3,466,666 for next season, is under contract through 2019, and has a club option for 2020. With starting pitcher salaries estimated anywhere from $10-$25 million and up this offseason, Teheran and his $3.5 million in 2016 season seem like a steal. Plus the Blue Jays would be getting Teheran for the prime years of his career and although last year was an off year, he’s shown signs of being an ace. Teheran would complete the starting rotation for the Jays in 2016 and after Dickey’s contract expires, Toronto would be left with a rotation of Stroman, Teheran, Hutchison and Estrada for the 2017 season. The other nice thing about Teheran is that his $3.5 million contract leaves Toronto with roughly $15.5 million left over to fill out the bullpen or upgrade other areas. Teheran would be an affordable and valuable piece to a rotation that desperately needs it and would be far better then spending 3 to 4 times his annual 2016 salary on a pitcher that may already be or not far away from the decline of his career.

As I mentioned above, with the money saved on the Teheran trade, the Blue Jays could add a piece to the bullpen or upgrade other areas but in compiling data for this article, I got to thinking about what the Jays could do for the future. 2017 has roughly $36 million coming off the books for Toronto and with a young core of controllable players, the Jays have some room to make a move. One of the contracts expiring is RF Jose Bautista. I personally think the Jays should re-sign Bautista after 2017 but I don’t think putting him in right would make sense. With Encarnacion’s contract set to expire as well, the DH spot would be available for Bautista, should he choose to stick around. That would leave RF empty and looking at the outfield class of 2017 (Beltran, Suzuki, Gregor Blanco, Josh Reddick, Brandon Moss, Mark Trumbo and of course Bautista) the group leaves something to be desired.

That brought me to the 2016 class, led by arguable the best right fielder in the game, Jason Heyward. The Jays have been rumored to be after SP free agents David Price and Zack Greinke but for the amount of money they’ll command and the stages they’re at in their career, I think the money might be better spent on a player whose best days are ahead of him. That in my opinion is Jason Heyward. We know Heyward is a solid player, who’s shown flashes of brilliance and is young enough to still put it all together consistently. In a lineup like the Blue Jays’, Heyward would thrive much the way Josh Donaldson officially broke out as a superstar last year. Heyward would have the protection and opportunities to truly develop into the player he’s about to get paid to be. The problem with signing Heyward would be the Blue Jays would have to free up a sizable amount of money and the only real place to look is at shortstop in the form of Troy Tulowitzki.

Tulowitzki was a surprise addition for the Blue Jays last year and definitely added strength to an already dangerous lineup but with the depth that Toronto has with Ryan Goins able to play SS and the return of Devon Travis, the 31-year-old Tulowitzki becomes an expensive option for the remainder of his career. Perhaps the Jays should trade Tulowitzki to free up money to sign Heyward to a long-term deal? Instead of watching the expensive decline of Tulo for the remainder of his contract, Toronto could still sell high to a team willing to take on the contract, receiving bullpen help and possibly an extra outfielder to help address current needs.

I then started going through MLB teams to see which ones would possibly be in a situation to make the trade happen. The Diamondbacks, White Sox and Mets all stood out as possible suitors while the Rangers, Yankees, Padres and Mariners also seemed like possible options. For the purposes of this article I’m only going to focus on the first three.

With a 2015 budget of about $76,622,575 million the Arizona Diamondbacks definitely have room to financially take on Tulo’s contract; the question is, is that where LaRussa and Dave Stewart want to take the team? None of us truly know but if the asking price is right, perhaps Randall Delgado and Ender Inciarte, maybe the thought of Tulo and Goldschmidt would fit their plans. They did spend $68.5 million for 6 years of Yasmany Tomas and with the emergence of David Peralta and A.J. Pollock, the Diamondbacks have outfielders to spare. If the trade were to go through the Blue Jays would gain about $18,487,000 giving them a total available amount of about $33,980,334. That would definitely be enough to sign Heyward to a 7-10 year deal (depending on what the market drives his year amount to) at anywhere from $20-$29 million per season. With the $36 million coming off the books in 2017, Toronto would have about $37 million to spend on the DH spot (Possibly Bautista) and SP or RP spot open (depending on how they handle Sanchez and Osuna). Compared to the $50 million amount they could have in 2017 minus whatever they pay for a starting pitcher this off season. In reality that $50 million would probably be more like $30-$35 million with two rotation spots available as well as the DH. If the Teheran trade and Heyward signing were to happen, here is what the 2016 and 2017 Blue Jays lineup would look like.

2016 Lineup                2017 Lineup

C = R. Martin                C = R. Martin
1B = E. Encarnacion    1B = C. Colabello
2B = D. Travis              2B = D. Travis
3B = J. Donaldson       3B = J. Donaldson
SS = R. Goins                SS = R. Goins
LF = B. Revere              LF = B. Revere
CF = K. Pillar                CF = K. Pillar
RF = J. Heyward         RF = J. Heyward
DH = J. Bautista          DH = ?

SP = R.A. Dickey                 SP = M. Stroman
SP = M. Stroman                 SP = J. Teheran
SP = J. Teheran                   SP = D. Hutchison
SP = D. Hutchison            SP = M. Estrada
SP = M. Estrada                   SP = ?

RP = R. Osuna                     RP = R. Osuna
RP = A. Sanchez                  RP = A. Sanchez
RP = L. Hendricks              RP = L. Hendricks
RP = B. Cecil                        RP = B. Cecil
RP = R. Delgado                  RP = R. Delgado
RP = S. Delabar                   RP = S. Delabar
RP = A. Loup                        RP = A. Loup

BN = E. Inciarte                   BN = E. Inciarte
BN = J. Thole                        BN = D. Pompey
BN = C. Colabello                 BN = ?
BN = D. Barney                     BN = ?

If Heyward’s contract was structured so that his first year was set at $20 million, the Jays would enter 2016 with about $13-$14 million left in the budget for any additional moves. It would also shore up right field a year before it’s an issue while upgrading the bullpen and perhaps leading the way for Sanchez or Ozuna to enter the rotation for 2017. The point is Toronto has money coming available next year but in order to get the player that best fits their future needs, they might have to make a move now instead of waiting till next year.

The next team I thought might make sense as a trade partner was the Chicago White Sox, who recently released long time SS, Alexi Ramirez. The White Sox had a budget of $118,860,487 in 2015 and were supposed to be contenders with the additions of Melky Cabrera, Jeff Samardzija, David Robertson and Adam LaRoche but instead fell way short and put together an all-around forgettable season. With the release of Ramirez, shortstop seems to be an area of need for Chicago, and Tulowitzki with Abreu, Cabrera and LaRoche would be a great fit on the south side.

Unlike the Diamondbacks however the White Sox don’t have as much potential new money available, so off-setting the cost of Tulo’s contract would have to be taken into account when thinking about a trade. Someone like Zach Duke, who is owed $5,000,000 over the next two years might be a good addition to the Toronto bullpen. If the Sox would somehow include often-injured Avisail Garcia, this trade might really swing in Toronto’s favor but really saving money for a Heyward run would be more important then any name on the back of a jersey.

For argument’s sake I’m going to use the Duke/Garcia for Tulowitzki trade as an example. The difference in salaries would be about $12.7 million and that added to the $15,493,334 left over after the Teheran trade, Toronto would have about $28,193,334 left over to make Heyward an offer. And again, if the contract was structured so that the first year paid Heyward $20 million, the Blue Jays would have about $8 million left over for additional offseason/mid-season upgrades.

The last team that I thought would make sense for a potential Tulo trade was a team that was linked to him while he was still in Colorado, the New York Mets. Coming off a spectacular run to the World Series, the Mets are set to lose Yoenis Cespedes and Daniel Murphy to free agency. In 2015 they had a payroll of $120,415,688 and Cespedes and Murphy combined for $11,729,508 of that total budget, over half of what Tulowitzki is owed going into 2016. For the Mets, their quality rotation is under team control or earlier arbititration for the next few years, so continuing the winning environment at a fraction of the cost is of utmost importance. The health of David Wright is suspect and with a nice young group in Conforto, d’Arnaud, Duda, and Lagares, trading for someone of Tulo’s caliber might help their development and continue the winning environment.

The Mets would be in the same situation that the White Sox are — they can’t add too much salary, so off-setting costs would play into the equation. If the Mets traded Jonathan Niese, who’s owed about $9 million in 2016, and Kirk Nieuwenhuis, they’d clear about $10,688,729. Add that with the money saved from letting Murphy and Cespedes walk and they could easily bring in Tulowitzki’s contract. The Blue Jays would have about $26 million to work with and again, if Heyward’s first year was set at $20 million, they’d have about $6,182,063 to work with for offseason/mid-season upgrades.

All of this is unauthorized speculation but I do think that the Blue Jays are in a unique situation where they can really make some moves that could set them up for years of success. Chasing the big-name starting pitchers may seem like the obvious move but taking advantage of other team’s situations could allow them to acquire elite talent for minimal cost and the money saved on starting pitching could be used to solve future needs that aren’t quite here yet. As always, thanks for reading and let me know what you think.


Measuring Team Chemistry with Social Science Theory

Every athlete, professional or otherwise, talks about that feeling of being on a team. There’s something that happens when a team “clicks” – it’s a united feeling of team spirit that propels team members to compete, most often referred to as team chemistry. In the social sciences there’s no measure of team chemistry, but there is however Team Cohesion, which is defined as:

A dynamic process that is reflected in the tendency of a group to stick

together and remain untied in the pursuit of its instrumental objectives

and/or for the satisfaction of member affective needs [1].

Team cohesion has been shown to exist across multiple work group settings (organizational, military and sport) [2], as well as across multiple sports (basketball, golf [3], softball, and baseball [4]). Perhaps more interestingly, cohesion has also been bi-directionally linked to performance: when teams perform better, they are more cohesive; and when they are more cohesive, they perform better [2,5]. And while the research on this relationship is clear, it has mostly been conducted with non-professional teams. Indeed, team cohesion is one of many other “unobservable” properties that are untapped within profession sports.

How can we measure team cohesion in professional sports?

 As researchers, we would normally use a validated survey to measure team cohesion – a survey that I could rely on to accurately measure team cohesion. Unfortunately, when I don’t have access to a team, I’m forced to use alternative methods. The first step is to examine the literature; a few key findings are brought to light about indications of team cohesion:

  • Team cohesion is related to the extent that members accept the roles on their team (captain, motivator, leader, follower, etc.) [6].
  • Charismatic leaders will refer to their teams more often than referring to themselves [7].
  • The higher the level of team cohesion, the better the team performance [2,5].

So, if I can somehow measure how often leaders refer to their teams (vs. themselves), then I can use this as an approximation of their leadership characteristics. And if leaders are acting like leaders, they may also be helping to solidify roles within their team. Therefore we might expect that:

Hypothesis 1: As leaders reference their team more, we should see increased team cohesion – and as team cohesion increases, we should see better performance.

A charismatic leader does not typically arise without a contextual or conditional trigger. Crisis often prompts the emergence of charismatic leadership – a setting that allows a charismatic leader to propose an ambitious goal [8]. Both the context and the charismatic leader influence one another, almost as if the leader requires crisis as an occasion to exemplify charismatic leadership [9]. Additionally, at the group level, team members have been shown to become more attached to the leader in times of crisis, prompting a greater presence of cohesion during times of crisis as followers rally around the charismatic leader [10].

In baseball, teams experience all types of crises throughout the long season, including injuries, losing streaks, playoff races, and team conflicts. Perhaps the most common and least contextual of these crisis is the race to the playoffs as the season comes to an end. With an understanding of how and when the playoff races begin to make an impression, I can expect to observe a temporal effect of charismatic leadership by using our previous indicator of team reference. That is, it may not only be that “there is a positive relationship between a leader’s team references and the amount of wins his team will have at the end of the regular season”, but also:

Hypothesis 2: The timing of when a team leader references his team can determine the effectiveness of his leadership.

Methods

As the first component of the measure, I needed to assess team leaders’ reference to themselves or their team, I used the most popular newspaper from that team’s city to extract quotations (e.g., San Francisco Chronicle for the Giants; the New York Times for the Yankees). A team leader was identified by teammates, coaches, or front offices as a “leader”, a “captain”, or having either of these qualities. If there was more than one identified team leader, I randomly chose between the two. I tracked the quotes from 8 randomly selected baseball team leaders from 8 randomly selected teams across an entire regular season (April 4th, 2012 – October 3rd, 2012). Statement settings included comments made in locker rooms after games, during the All-Star break, before a game started, or in any other setting. Any time the leader was documented as saying anything that appeared in the newspaper, that quote was documented for analysis. Leader quotes were qualitative coded independently between 3 different coders. Each quote was coded as containing “self-reference”, “team-reference”, and/or “other reference” (the 3 coders had 97% agreement on their final codes). I began this study in 2013 thus I used the 2012 season, which was the latest complete season at my disposal.

Due to the disparity in responses, the sample was aggregated based on team leaders who played on teams that finished with a certain number of wins. Since 1996, no AL team has made the playoffs with less than 86 wins [11]. During the same time period, no NL team has made the playoffs with less than 82 wins [12]. For this study, leaders were categorized based on how their teams finished the regular season (86 or more wins for AL teams and 82 or more wins for NL teams). Those at or above the win mark were titled “high team leader” (HTL) and those below the win mark were titled “low team leader” (LTL). Four teams in the sample met the HTL criteria and their combined record was 368 – 280 (.568 wining percentage). Not all HTLs were on teams that made the playoffs in 2012, but each of the four teams were competing for a playoff spot in the months of August and September. Four teams in the sample met the LTL criteria and their combined record was 296 – 352 (.457 winning percentage).


High or low team leader classification

Team League 2012 Regular Season Record Team Leader High or Low Team Leader
Angels AL 89-73 Torii Hunter HTL
Giants NL 94-68 Buster Posey HTL
Yankees AL 95-67 Derek Jeter HTL
Rays AL 90-72 Evan Longoria HTL
Rockies NL 64-98 Michael Cuddyer LTL
Twins AL 66-96 Justin Morneau LTL
White Sox AL 85-77 Paul Konerko LTL
Phillies NL 81-81 Jimmy Rollins LTL
     Table 1. Classification of high or low team leaders based on their team’s 2012 regular season record

Results

There was no significant correlation between the total number of team references and the total number of wins that a leader’s team had at the end of the regular season r = .237, p > .05). Nor was there an indication of a negative correlation between self-references and total number of team wins r = -.086, p > .05.

Leader responses were then aggregated between LTLs and HTLs. Of the 490 total responses, 252 responses were made after or in reference to a previous game. Quotes were then selected for these post-game interview responses after a leader’s team had won a game (162 total) or lost a game (90 total). After a loss, both HTLs and LTLs referred to their teams much more often than referring to themselves. LTLs were 7.20 times as likely to reference their team after a loss than reference themselves. When compared to LTLs, HTLs were less likely to refer to their team after loss (4.42:1). After a win, LTLs were 1.41 times as likely to reference their team than themselves. HTLs on the other hand were 2.32 times as likely to reference their team than themselves after a win (Table 1).

Reference to team or self as ratio

Leader Loss Win
HTL 31:7 (4.42:1) 65.28 (2.32:1)
LTL 36:5 (7.20:1) 45:32 (1.41:1)
     Table 2. Ratios of team vs. self references for each type of leader

The monthly distribution of team reference for LTLs was relatively even across all months of the regular season. The highest percentage was July (19.9%) and the lowest was August (12%), a difference of 7.9% (Figure 1). The overall standard deviation for team references by month was σ = 2.88. In contrast, team reference for HTLs was much more dynamic. The highest percentage was September (39.6%) and the lowest was June (5.8%), a difference of 33.8%. September team references for HTLs were more than double any other month. The overall standard deviation was σ = 12.2, with the resulting distribution becoming much more parabolic (Figure 2). The quadric trend line that is used to represent the team reference distribution for HTLs showed a very good fit R2 = .91.

nullFigure 1. Percentage of team reference by month LTLs
           Figure 2. Percentage of team reference by month HTLs with quadratic trend line


Discussion

The increased rate of team reference by HTLs as compared to LTLs may have helped to establish better role clarity – a characteristic of more cohesive teams. This was further marked by the fact that HTLs were on higher performing teams than LTLs. The direction of the team cohesion to performance relationship in this case is still unknown.

HTLs also referred to their teams most often during the end of the regular season. This relates to the theory that charismatic leaders will “activate” in times of crisis. In turn, this helps to create more team cohesion as members attach themselves to leaders in times of crisis.


[1] Carron, A.V., Colman, M.M., Wheeler, J., & Stevens D. (2002). Cohesion and Performance in Sport: A Meta Analysis. Journal of Sport & Exercise Psychology, 24, 168-188.

[2] Mullen, B. and Copper, C. (1994). The relation between group cohesiveness and performance: an integration. Psychological Bulletin.115, 210-227.

[3] Vincer, D., & Loughead, T.M. (2010). The Relationship Among Athlete Leadership Behaviors and Cohesion in Team Sports. The Sport Psychologist, 24, 448-467.

[4] Carron, A.V., Bray, S.R., & Eys, M.A. (2002). Team Cohesion and Team Success in Sport. Journal of Sports Sciences. 20(2). 119-126.

[5] Oliver, L.W., Harman, J., Hoover, E., Hayes, S.M., & Pandhi, N.A. (2003) A quantitative integration of the military cohesion literature. Military Psychology, 11, 57-83.

[6] Carron, A. V., & Eys, M. A. (2012). Group dynamics in sport (4th ed.). Morgantown, Fitness Information Technology.

[7] Shamir, B., Arthur, M.B., & House, R.J. (1994). The rhetoric or charismatic leadership: A theoretical extension, a case study, and implications for research. The Leadership Quarterly, 5(1), 25-42.

[8] Poon, J. & Fatt, T. (2000). Charismatic Leadership. Equal Opportunities International. 19(8), 24-28.

[9] Conger, J. A. (1999). Charismatic and transformational leadership in organizations: An insider’s perspective on these developing streams of research. The Leadership Quarterly, 10, 145-179.

[10] Kets de Vries, F. R. (1988). Prisoners of leadership. Human Relations, 41, 261-280.

[11] Gaines, C. (2011, April 21). Chart of the Day: What it takes to make the playoffs in Baseball. Business Insider. Retrieved from http://www.businessinsider.com/chart-of-the-day- what-it-takes-to-make-the-playoffs-in-baseball-2011-4

[12] Bloom, B.M. (2005). Padres Try to Recover from 82-80 Record. San Diego Padres. Retrieved from http://m.padres.mlb.com/news/article/1236830/


Give Me a Rise

It is well established that having more rise on your four-seam fastball is a good thing. The question then becomes, can we identify the optimal amount of rise as compared to the league-average fastball. For the purposes of this analysis, we will look at swinging-strike rate, from all four-seam fastballs thrown since the dawn of the PITCHf/x era, in regular-season action.

We in the sabermetrically-inclined community tend to pooh-pooh popular baseball concepts, particularly ones where the science, on the surface, doesn’t appear to jive with the age-old baseball wisdom. Don’t worry, this is not a DIPS discussion, nor a discussion on a pitcher’s ability to manage contact. I bring up this concept in relation to the term “late life” as in movement later in the pitches trajectory. Physics tell us that the ball will have a very predictable trajectory from the moment the ball leaves the pitchers hand, until it reaches the front of the plate. That, however, is merely half the story. There are two important points I want to bring up:

  1. Batters cannot compute vertical trajectory explicitly; they essentially tap into a huge vault of experience telling them how far a pitch will drop based on their experience with pitches of similar velocity.
  2. A hitter’s swing is largely ballistic (very difficult to change mid-swing) and takes about 0.18 seconds to execute. That means that a hitter has roughly 0.2 seconds post-release of the ball to gather information and form an educated guess as to where the ball will end up.

Based on these assumptions, I computed late movement, in both the vertical direction and horizontal direction. I then compared this to the expected vertical movement based on the velocity (more velocity, less drop obviously). This to me is the optimal way to look at movement, since presumably they cannot gather any more information. A great hitter may be able to factor in their knowledge of the pitcher’s ability to rise the fastball, but they are fighting their memories of all the other fastballs they’ve seen, so more difficult than you would think.

Which brings us to a very interesting graph: The height and colours in the histogram reflect the magnitude of the swinging-strike rates, shown in sequential order of velocity. If you scroll all the way to the bottom, you’ll see that the center of the histogram is somewhere around -.6, or 0.6 feet more rise than the average four-seam fastball when looking at the pitch 0.2 seconds after release until it crosses home plate.

We see a very clear normal curve, with more “normal” at higher n. Thus we can now compute the value of rise in a four-seam fastball, as distributed by a normal curve centered around 0.6 feet above the mean drop. Not really a stats guy, so not sure how to do that exactly. What I find interesting is that the 7 inches or so of rise is pretty consistent across the velocity spectrum. I’m not sure why it peaks at this point, though I would surmise that it’s probably the sweet spot where the hitter feels like they can make contact, but can’t, as opposed to extreme rise which would freeze the hitter.

This leads us to our last graph (warning: this one scrolls for a while). You’ll see the same graph as above, but you’ll see Whiff%, GB% and HR% stacked one on top of the other.

This actually paints a very intuitive picture. If there is more rise than average, you’ll get swinging strikes. If it drops more than average, you’ll get groundballs and if it drops about what you’d expect, you’ll get some groundballs, but also homers. Ignore the SSS noise with homers at the higher velocities. Again what is interesting with the GB% and Whiff% histograms are how consistent they are irrespective of velocity. So… if velocity doesn’t impact this analysis, let’s collapse it all into one final graph:

Paints a very clear picture: if your four-seam fastball isn’t getting at least 5 inches of late rise, you are going to be giving up a lot of homers. Note that swing% (swings/total pitches) is normally distributed around a mean of .2 feet of rise and appears to track pretty closely to HR%, implying that hard contact is not affected within 1 standard deviation.

Looking forward to the feedback.


Vertical Command – Or Lack Thereof

I read a great book by Mike Stadler called the Psychology of Baseball. In it he referenced that it is far more difficult for humans to control where a ball ends up vertically (due to the need for advanced spatial reasoning) compared to horizontally. You can find his discussion starting on page 86. Amazon Link

I’m going to show you three pictures which will illustrate this quite well. Data is inclusive of all pitches thrown in regular season games since 2010. The first is a heat map of sorts which maps vertical distance from the center of the zone (from PITCHf/x data sz_top and sz_bottom) on the y axis and velocity on the x axis. What we see quite clearly is that it is *much* better to throw a four-seam fastball up in the zone than down in the zone, almost irrespective of velocity. In fact, a 92 MPH four-seam fastball thrown 0.8 feet above the center of the zone will get about 13% swings and misses; a 98 mph four-seam fastball thrown below the center of the zone will get 12% swings and misses. Behold the graph, from a fan:

Four Seam Fastball, Depth x Velocity
Four-Seam Fastball, Depth x Velocity

The question then becomes, if a pitcher throws the ball up in the zone, how will the probability of a HR change? This brings us to picture #2, where we have the same x and y axes (apparently that’s the plural of axis, thanks google), but instead we have HR% (# of HRs/Total Pitches). I’ve removed 99+ MPHs from the graph as they were displaying SSS noise.

HR% by Depth and Velocity

So interestingly, if you look at the totals on the right, it paints a visual that HRs are NOT hit on high fastballs, but rather on fastballs closer to the heart of the zone (vertically). In fact (and a story for another day) there is a 97% R-squared correlation between distance from the center of the zone and HR%. On an aside, this also reproduces other research which indicate that faster fastballs yield fewer home runs. The trend is also quite linear (don’t have a computed R2 for that, but that’s old news anyway).

Now, if you are far more likely to get a swinging strike and you aren’t putting yourself at risk for a home run by throwing up in the zone, if we looked at a distribution of four-seam fastballs, we should see a higher proportion of four-seamers up in the zone, ideally right at the top 0.8 to 1.0 feet above the zone, where whiffs are plentiful and HRs are scarce. Beware SSS in some of the higher velocities, but note that a 95 MPH fastball only .4 feet above the center of the zone will yield more HRs than an 88 MPH fastball thrown at the top of the zone (the 95 MPH fastball will still yield more whiffs, but just goes to show how important command is). This is what we actually see:

A nearly uniform distribution across all velocities, slightly skewed to below the center of the zone. I’m not ready to conclude that pitchers are not capable of pitching up in the zone with four-seam fastballs, it may just be old school “pitch down in the zone” thinking. I still find it astonishing how consistent the data is across the velocity spectrum. It almost appears to me that if a pitcher can simply pitch higher in the zone with a four-seam fastball, they can make their stuff play up a lot, sort of like MadBum:

Still not pitching at the top end of the zone, but definitely skewed higher, with his distribution centered around .3 feet above the heart of the zone.


How Game Theory Is Applied to Pitch Optimization

The timeless struggle between pitcher and batter is one of dominance — who holds it and how. Both players use a repertoire of techniques to adapt to each other’s strategies in order to gain advantage, thereby winning the at-bat and, ultimately, the game.

These strategies can rely on everything from experience to data. In fact, baseball players rely heavily on data analytics in order to tell them how they’re swinging their bats, how well they’ll do in college, how they’ll perform at Wrigley versus Miller.

Big data has been used in baseball for decades — as early as the 60s. Bill James, however, was the first prominent sabermetrician, writing about the field in his Bill James Baseball Abstracts during the 80s. Sabermetrics are used to measure in-game performance and are often used by teams to prospect players.

Baseball fans familiar with sabermetrics, the A’s, and Brad Pitt have likely seen Moneyball, the Hollywood adaptation of Michael Lewis’ book. The book told the story of As manager Billy Beane’s use of sabermetrics to amass a winning team.

Sabermetrics is one way baseball teams use big data to leverage game theory in baseball — on a team-wide scale. However, by leveraging their data through the concepts of game theory on a smaller scale, baseball teams can help their men on mound out-duel those at the plate.

Game theory studies strategic decision making, not just in sports or games, but in any situation in which a decision must be made against another decision maker. In other words, it is the study of conflict.

Game theory uses mathematical models to analyze decisions. Most sports are zero-sum games, in which the decisions of one player (or team) will have a direct effect on the opposing player (or team). This creates an equilibrium which is known as the Nash equilibrium, named for the mathematician John Forbes Nash. What this means is that if a team scores a run, it is usually at the expense of the opposing team — likely based on an error by a fielder or a hit off a pitcher.

In the case of pitching, game theory — especially the use of the Nash equilibrium — can be used to predict pitch optimization for strategic purposes. Neil Paine of FiveThirtyEight advocates using big data and sabermetrics to analyze each pitch in a hurler’s armory, then cultivating the pitcher’s equilibrium — the perfect blend of pitches that will result in the highest number of strikeouts, etc.

Paine has gone so far as to create his own formula, the Nash Score, to predict which pitcher should throw which pitches in order to outwit batters.

In perfect game theory, the Nash equilibrium states that each game player uses a mix of strategies that is so effective, neither has incentive to change strategies. For pitchers, Paine’s Nash Score uses their data to find the optimal combination of pitches to combat batters, including frequency.

Paine does point out that creating this kind of equilibrium in baseball can be detrimental to a pitcher. He is, after all, playing against another human being who is just as capable of using game theory to adapt strategies to upset the equilibrium.

If a pitcher’s fastball is his best, and his Nash Score shows that he should be using it more often, savvy hitters are going to notice. “ . . . In time, the fastball will lose its effectiveness if it’s not balanced against, say, a change-up — even if the fastball is a far better pitch on paper,” writes Paine.

In this case, a mixed strategy is the best — in game theory, mixed strategies are best used when a player intends to keep his opponent guessing. Though pitch optimization using Paine’s Nash Score could lead to efficiency, allowing pitchers to throw fewer pitches for more innings, it could also lead to batters adapting much quicker to patterns, thus negating all the work.


Stop Thinking Like a GM; Start Thinking Like a Player

Like many baseball fans, I have played a lot of baseball in my life. I wasn’t anything special—Just A Guy in HS-age select ball, a starter in college only by virtue of attending a notoriously nerdy institution, and a player in the kind of adult league where a typical pitcher throws 80 and a double play ball has about a 50/50 shot of actually becoming a double play. What might be atypical about me is that as both a player and fan of baseball, I never had to struggle with sabermetrics upending conventional wisdom. For me sabermetrics was conventional wisdom from the very beginning. I grew up in a house with every single Bill James book ever published on the bookshelves and knew who Pete Palmer was when I was twelve.

Here’s the honest truth: Sabermetrics provided essentially no help in making me a better baseball player.

If a sabermetrician (or saber-partisan) wonders why the larger baseball world has not discarded Medieval Superstition for Enlightened Science, foregoing the burning of witches to instead guillotine the likes of Hawk Harrelson, he should think about all that is implied by the above.

Sabermetrics has immeasurably improved the management of baseball, but has done comparatively little to improve the playing of baseball. The management of baseball (meant generically to encompass front office as well as in-game management) is primarily an analytical task, but the playing of baseball is at heart an intuitive one. Getting better at managing involves mastering and applying abstract concepts. Getting better at playing involves countless mechanical repetitions with the goal of honing one’s neurology to the point at which certain tasks no longer require conscious attention to perform.

It is not terribly surprising that sabermetricians, being almost by definition analytically inclined, have gravitated towards finding management to be a more interesting problem than playing. That attitude has gotten sabermetrics a long way but is now a problem. Traditional sabermetric lines of inquiry are on multiple fronts running into limits, beyond which sabermetricians are declaring, “Everything past here is just luck!” Breaking new ground is most definitely possible, but it will require sabermetricians to ask different questions. To ask those questions, a perspective change has to occur: going forward, the sabermetrician will need to look at baseball through the eyes of a player, not the GM.

The Cultural Divide

To come at this dichotomy from another, roundabout direction, let’s consider a hypothetical player who has just been through a 3-for-20 (with a walk) slump. Two statements are made about him:

Statement A: 21 PA’s is far too small a sample size to make any definite judgement about him. His anomalously low .200 BABIP is driven by a IFFB% well above his career average, so in all likelihood he’ll regress towards his projection.

Statement B: He is letting his hands drift too far away from his body, so pitchers are busting him inside, and he’s popping up what he isn’t whiffing.

Start with the obvious: The reader does not require n = 600 to expect with 95% confidence that he is more likely to read statement A rather than B at FanGraphs, Baseball Prospectus, Grantland, or FiveThirtyEight, and that with nearly equal confidence he would expect to hear statement B rather than A from a color announcer on a broadcast. Furthermore, someone making statement A will often imply or suggest that Statement A is Responsible Analysis and that Statement B is an attempt to Construct a Narrative (“Construct a Narrative” being the polite datasplainer way to say, “Bullshit”). Most people making statement B look at statement A and roll their (glazed) eyes.

Tribal affiliations established, let’s analyze the two statements in the critical literary sense. Who is the intended audience of the respective statements? A is a probabilistic statement about the future that implies lack of direct control but supposes its audience needing to make a decision about the player. The appropriate audience for such a statement is a manager or general manager. B is a definite statement about the present that implies direct, controllable causality and implicitly suggests a course of action to take. The appropriate audience for such a statement is the player himself.

Now of course, neither statement is really made for the GM or player but both are rather made for the fan who vicariously stands in for one or the other. What fundamentally defines a fan is that he identifies with the team and internalizes such statements as if he were actually a participant. The faux-audience of the two statements thus reveals a difference in how the real audience identifies with the team: A is made for fans who primarily identify with the GM, or more likely, fans who have fantasy teams (a variation on the theme).  B is for fans who primarily identify with the players. The use of “primarily” implies that the division suggested is of degree rather than kind—any fan of a mind to be critical, from the bleacher creature-est to the most R-proficient, will do both—but to implicitly adopt the viewpoint of management carries an inherent elitism.

To say the viewpoint of sabermetrics is elitist is not to say it is wrong—quite the opposite. As a system for framing and evaluating management decisions it has proven spectacularly right. It has been over a decade now since Bill James got his ring, and today every single MLB franchise employs people whose sole job is to produce proprietary statistical analysis. The premier saber-oriented publications have difficulty retaining talent because said talent is routinely poached by said franchises. Were an alien to arrive on earth and learn Western Civ from Brad Pitt movies he would judge Billy Beane a greater hero than Achilles. The revolution is over, and the new regime is firmly ensconced. To point at any remaining Tallyrands who have managed to survive the turnover is to ignore the amount of adaptation that has been required of them to do so.

No, to say sabermetrics is elitist is instead to say merely that its assumed perspective is managerial. It asks and answers questions like, What is the optimal strategy? or, How do I compare the value of different skillsets? or the real, ultimate, bottom-line bone of contention: How much does this guy deserve to get paid? That sabermetrics adopted this perspective was not necessarily inevitable. Sabermetrics grew out of the oldest of fan arguments: Who is the (second) greatest? Who deserves the MVP this year? Should this guy be in the Hall of Fame? These questions are about status, and status ultimately rests on subjective values. The declared purpose of sabermetrics is to answer those questions objectively. More modestly stated, the purpose is to force people arguing over subjective values to do so in the context of what actually wins baseball games. More cynically stated, it can be a way of humbugging that dispute by presenting a conclusion dependent upon a particular value judgement as precise, objective truth and its detractors as retrograde obscurantists.

The cynical way of stating sabermetric purpose is unfair, but it is made possible because the sabermetric solution to this problem of trying to referee aesthetics with numbers was to assert a specific conception of value as normative: that of a general manager whose job is to assemble a team to win the most baseball games in the specific context of free-agency era Major League Baseball’s talent pool and collectively-bargained labor and roster rules. When Keith Woolner looked at the talent distribution of players and proposed that there was a more or less uniform level of talent that was so ubiquitous and readily available that players of that skill level should be considered to possess zero scarcity value, he established something that could serve as an objective basis for value comparison. The existence of such a talent level meant that an optimally-operating GM should evaluate players by their skill level in reference to that baseline and naturally allocate the franchise’s finite resources according to this measure of talent scarcity. Woolner didn’t merely propose the idea. He demonstrated, quantified, and named it: VORP. Value Over Replacement Player. Regardless of how an MVP voter wished to philosophize “value”, this was clearly the correct way for a general manager to conceive of it.

“Replacement Level” is one of those ideas that, once one understands it, one immediately recognizes its intuitive obviousness and is embarrassed to have not thought of it before. It cannot be un-thought, and the difficulty of re-imagining what it was like to lack it in one’s mental toolkit makes it easy to forget how revolutionary it was. Overstating this revolutionary impact is exceedingly difficult, so here’s a go: In an alternate universe where Woolner chose to stay at MIT to become an economist instead of going to Silicon Valley, in which he published VORP about a normal profession in an economics journal with Robert Solow as his advisor rather than doing it as a baseball nerd in his spare time at Baseball Prospectus, he’d probably have a Nobel Prize (shared with Tom Tango and Sean Smith). That VORP as a statistic has been superseded by the more comprehensive WAR should not diminish its revolutionary status; VORP is to WAR what the National Convention is to Napoleon. “Replacement Level” labor was the most analytically powerful conceptual advance in economics since Rational Expectations. That some actual labor economists have had difficulty with it and have yet to adopt it as a common principle of labor economics is nothing short of mind-blowing. While it was developed to explain such a unique and weird labor environment, with minor modifications it could be applied widely.

WAR of the Worlds

WAR has conquered the baseball world, but no war of conquest is ever won cleanly. Amongst the common vices: looting. The best example of such is catcher defense. Establishing the level and value of pitch-framing ability has been a hot project in sabermetrics for several years now, enabled by a sufficiently large PITCHf/x database. Quantifying this ability may be a new thing, but anyone who claims the discovery of its existence belongs in the sabermetric trophy case is like a Frenchman claiming the Louvre as the rightful place of Veronese’s Wedding at Cana. The old-school baseball guys shoehorned into the role of bad guys in Moneyball were nearly uniform in their insistence on the value of a catcher’s defensive ability. The great unwritten story of sabermetrics of the last five to seven years is how much of the previously-derided, old-timey wisdom of the tobacco chewers has been validated, vindicated, and… appropriated. There is little better way to see this (r)evolution in opinion than reading the player blurbs on Jose Molina from several editions of the Baseball Prospectus Annual:

2003: My God, there are two of them. Jose has a little more pop than Ben, which is among the faintest praise you’ll read in this book. The Angels would be well served to go out and find a left-handed hitting catcher with some sock, just to bring off the bench and have a different option available. No, not Jorge Fabregas.

2004: Gauging catchers’ defense is an inexact science. We can measure aspects of it, but there’s enough gray area to make pure opinion a part of any analysis. So consider that a number of people think that Jose, the middle brother of the Backstopping Molinas, is a better defender than his Gold Glove-laden sibling. Although the two make a great story, the Angels would be better served by having at least one catcher who can hit right-handers and outrun the manager.

2005: At bat, both Molinas combined weren’t as productive as Gregg Zaun was by himself. That’s the value of getting on base; the difference from the best defensive catcher to the worst isn’t nearly as wide as the gulf created when one player uses his plate appearances effectively and the other toasts them like marshmallows. The younger Molina is a poor fit to back up his bro, given their too-similar skill sets.

2009: Since 2001, 66 catchers including Molina have had a minimum of 750 PAs in the majors. Of those, exactly two—John Flaherty and Brandon Inge—have had lower OBPs than Molina’s .275 (as a catcher only, Inge is lowest at .260). If OPS is your preferred stat, than just three backstops have been lower than Molina’s 614. Compared to Molina, Henry Blanco is Mickey Cochrane. The wealthiest franchise in sports could have had anyone as their reserve catcher, but in December 2007, Cashman decided they would have Molina for two years. He then climbed Mt. Sinai, shook his fist at the Almighty, and shouted, “I dare you to take Jorge Posada away from us, because we have JOSE MOLINA!” Thus goaded, the Almighty struck Posada with a bolt of lightning, and the Yankees hit the golf courses early. The moral of the story is that hubris sucks. P.S.: Molina threw out an excellent 44 percent of attempting basestealers, which is why he rates seven-tenths of a win above replacement.

2010: Nothing about Molina surprises. He could be caught in a hot-tub tryst with two porn starlets and a Dallas Cowboys linebacker and you’d still yawn, because it wouldn’t change a thing: he’s a glove man who can’t hit. In the last two years, he has posted identical 51 OPS+ marks, batting .217/.273/.298 in 452 PAs. He accumulated that much playing time because of Posada’s various injuries and scheduled days off. Though Molina’s good defense stands in direct contrast to Posada’s complete immobility behind the plate (so much so that Molina was used as A.J. Burnett’s personal catcher during the postseason), the offensive price was too high to pay. Molina is a free agent at press time; the Yankees are ready to turn his job over to Cervelli.

2013: Molina owes Mike Fast big-time. Fast’s 2011 research at Baseball Prospectus showed Molina to be by far the best pitch-framer in the business, turning him (and Fast, in fact) into a revered hero almost overnight. The Rays pounced for $1.5 million, and Molina rewarded them by setting a career high for games played (102) at age 37. He’d have played a few more were it not for a late-season hamstring strain, which also interrupted a Yadier-like, week-long hitting spree that separated the offensively challenged Molina from the Mendoza line for good. The Rays were glad to pick up his $1.8 million option in 2013 and hope for similar production.

2014: Arguably the best carpenter in the business because of his noted framework (*rimshot* *crickets*), Molina continued to handle a steady workload for Tampa Bay as he creeps toward his 40th birthday. The middle Molina receives a lot of praise for his work behind the plate, but his best attributes might be imaginary. He has been the stabilizing force for a pitching staff that perennially infuses youth as well as a role model for the organization’s young backstops. These traits are likely to keep him around the game long after he has stolen his last strike. For now, the framing alone is enough—the Rays inked Molina to a new two-year deal last November.

There is much to unpack from these blurbs, too much in fact to do systematically here. I selected them not to pick on Baseball Prospectus specifically (they did after all correctly identify the moral of the story), but because BP is a flagship sabermetric publication whose opinions can serve as a rough proxy for all of sabermetrics and because Jose Molina can serve as the avatar of catcher defense. I have omitted 2006-8 and 2011-12 partially for brevity and partially because it brings into high relief distinct eras of sabermetric consensus: In 2003-5, there is an acknowledgement that he might be a truly elite defensive catcher, but this view is a) not actually endorsed, b) assumed to be of minimal importance even if true given the then-saber consensus that OBP trumps all. In 2009-10, the opinion of him hasn’t really changed but the tone has—the writers acknowledge no uncertainty and are openly offended at his continued employment. By 2013-14 there has been a complete sea change in attitude. Not only does the writer appreciate the value of Molina’s skill, he confidently claims that it was because of Baseball Prospectus that he was now properly appreciated by an MLB franchise!

Fast’s research was genuinely outstanding (as was Max Marchi’s). He deserves enormous credit for it and has received (as has Marchi) the ultimate in sabervalidation- to be hired by a franchise to keep his future work exclusive. What he doesn’t deserve credit for is Jose Molina remaining employed. For someone (it wasn’t Fast) to claim that Molina owed BP a thank-you note for being paid less than he had been as a Yankee is astonishing on several levels, even granting that such blurbs are supposed to be cheeky and entertainingly irreverent. For starters, BP is confident that the overlap between front offices and saberworld is tight enough (and BP influential enough) that someone at every single franchise would have read Fast’s work. This part is at least true. The claim of being so influential as to be the primary reason Jose Molina was signed by the Rays is most likely false.

In February, Ben Lindbergh wrote at Grantland about his experience as an intern at the Yankees, during which time he had firsthand knowledge that the Yankees baseball ops department seriously debated as early as 2009 the possibility that Jose Molina was better at helping the Yankees win games than Jorge Posada, possessor of a HOF-worthy (for a catcher) .273/.374/.474 career slash line. Not only did he witness this argument, he proofread the final internal report that demonstrated this possibility to be reality. When Fast published his research at BP in 2011, Lindbergh was an editor there. Fast’s result was already known to him (although possibly NDA’d). When the blurb in the 2013 annual was published, Lindbergh had risen to Managing Editor. For BP to claim that Fast’s research drove Tampa Bay’s decision (as opposed to their own) was to claim that a front office renowned for its forward-thinking and sabermetric savvy was two years behind two of its division rivals (Molina having just finished a stint in Toronto).

About two weeks before the Rays signed Molina in November 2011, DRaysBay (the SBNation Rays site) had a Q&A with Andrew Friedman, which touched on framing (my emphasis):

Erik Hahnmann [writer at DRaysBay]: Recently there was a study by Mike Fast at Baseball Prospectus on a catchers’ ability to frame pitches and how many runs that can save/cost a team over the course of a season. A catcher being able to frame a pitch so that it switches a ball into a strike on a close pitch was worth 0.13 runs on average. The best can save their team many runs a year while the worst cost their team runs by turning strikes into balls. Is this a study you’ve looked at, and is receiving the ball and framing a pitch a skill that is valued and taught within the organization?

Andrew Friedman: We place a huge emphasis on how our catchers receive the ball. Jamie Nelson, our catching coordinator, pays close attention to each catcher’s technique from day one, and he and our catching instructors have drills to address different issues in that area. As with any skill, some players have to work more at it than others. The recent studies confirm what baseball people have been saying for decades: technique matters, and there’s more to catcher defense than throwing runners out.

To some extent every GM is a politician when it comes to communicating the fanbase, so we can’t necessarily take what Friedman said at face value. Friedman did after all employ Dioner Navarro for years. With that caveat though, those are not the words of a recent convert. Friedman is also the guy who traded for the defensively superb Gregg Zaun in 2009 and for whom Zaun most wanted to play after the 2010 season (he ultimately retired, unable to get an offer coming off of labrum surgery at 39). The weight of evidence, most heavily that the famously low-budget franchise had a full-time employee whose title was “Catching Coordinator”, is that the Rays front office valued catcher defense before it was cool.

The point is not to be too hard on Lindbergh, who is a joy to read and whose linked article above is in part a personal a mea culpa for his original skepticism. The point is to be hard on sabermetricians as a tribe who, having discovered for themselves the value of pitch framing in 2011 and refined their techniques subsequently, rarely if ever made similar mea culpa for belittling the folks who were right about it all along. Imagine the view from the other side: you’re a grizzled scout, a career baseball guy, a former-player color announcer who knew in your bones and always insisted that a catcher’s receiving ability was crucial. Your name might be Mike Scioscia. You were castigated as an ignoramus for more than a decade by a bunch of nerds who couldn’t see the dot on a slider if it Dickie Thon-ed them and who relied almost exclusively on CERA, a statistic so quaintly simplistic it was created before anyone would have thought to construct it as C-FIP. Then all of a sudden, one day the statheads not only show that you were right the whole time, they also show that you are good at judging this ability, and they make no apologies. One can perhaps forgive such a person for not bowing too deeply to his new overlords.

Science?

While Michael Lewis no doubt exaggerated the scout/sabermetric culture clash, especially within actual front offices, he certainly did not invent it either. It is epistemological at heart—whether or not one prefers an intuitive or analytical basis for knowledge. Keith Woolner (can’t win ‘em all) in his above-linked 1999 research on catcher defense stated the sabermetric viewpoint most succinctly, “Currently, the most common way to evaluate game calling in the majors right now is expert evaluation — in other words, managers’ and coaches’ opinions and assessments. Ultimately, this approach is contrary to the spirit of sabermetric investigation, which is to find objective (not subjective) knowledge about baseball.” Given that attitude and the evidence available in 1999 Woolner was, in a limited sense, correct. The best evidence available did not show much differentiation in catcher defensive value. Where he (and saberworld generally) erred was in succumbing to the empiricist’s seductive temptation: declaring absence of evidence to be evidence of absence. It is oh-so-easy to say, “The answer is no” when the technically correct statement ought to be, “There is no answer.” What makes this subtle sleight-of-hand tempting is that on some level everyone understands what’s at stake: Saying, “There is no answer” when a rival epistemology plausibly claims otherwise amounts to betting the entire belief structure that the rival is wrong, a bet for which, by construction, an empiricist has insufficient evidence to make. Authority is up for grabs, and pilgrims do not tolerate silence from their oracles.

Woolner’s apt summation of the sabermetric viewpoint implies the grander ambition: Sabermetrics aspires to Science. Unfortunately, it cannot be Science in the most rigorous sense of the word. It is like economics, faced with complicated systems producing enormous amounts of data, nearly all of which is tainted by selection bias. One can wield the mathematical tools of science, but one is unable to run controlled experiments. Worse, also like economics, in order produce results of even remote usefulness one must often make unfalsifiable assumptions of questionable validity.

For a more concrete illustration of this problem, let’s continue drawing from the catcher framing well. We can measure with high precision the first-order effect of a catcher’s impact on called balls and strikes with PITCHf/x, and with linear weights we can calculate good context-independent estimates of the consequent run & win values. We do this calculation and tacitly assume that this first-order effect is, if not the whole story, at least 70-80% of it. We also know that a catcher’s receiving ability affects pitch selection (type and targeted location), both because we have testimonial evidence to that effect from actual major league pitchers and because it is intuitively obvious. Anyone who has ever toed the rubber with a runner on 3rd has at some point gotten queasy when the catcher signals a deuce and shaken it off. While this effect is openly acknowledged by absolutely everyone who studies framing, it is just as soon ignored or dismissed with prejudice by hand-wavy arguments. Should it be? Who knows? Certainly not anyone who considers Sabermetrics to be Science, because there has never been any rigorous attempt in saberworld to quantify the selection effect. No one has yet laid out a convincing methodology to do so with the extant data.

Yet, the potential second-order effect of pitch selection dwarfs the first order one- only a small fraction of pitches thrown form the basis of the first order calculation, and by definition this sample excludes every single pitch on which a batter swings. One logical possibility would be supposing that a pitcher who knows he has a good catcher is more likely to test the edges of the zone and less likely to inadvertently leave pitches over the middle of the plate. From 2012-present the team-level standard deviation of HR/9 allowed is 0.15. At 10 runs/win and a 1.41 R/HR linear weight, over a 120-game catcher-season it would only take a 0.06 difference in HR/9 to make for a whole win of value. 0.06 HR/9 equates to 1 HR per 17 games, during which time a typical starting catcher will be behind the dish for 2400 pitches, give or take. To repeat: +/- 1 meatball every 2400 pitches could drive 1 win of value. Raise your hand if you want to bet your reputation, with zero statistical evidence to back you up, on the triviality of something that we know exists and only takes 1 HR per 2400 pitches to equate to 1 WAR, let alone whatever effects it has on balls in play. The selection effect could easily be that big and be completely lost in the noise. It could be thrice that big and still look like randomness. Yet, because we can’t measure it, we ignore it. How many Molina-caught pitching staffs (any Molina) would you guess have been on the wrong side of average in HR/9?

The issue of known-but-unmeasurable effects is a big enough practical problem, but the issue of falsifiability is the sub-surface rest the iceberg. Scroll back to the beginning of this essay and compare the two hypothetical statements, this time not from a sociological or literary standpoint but rather from a Popperian, scientific one. Which is falsifiable? The “sabermetric” piece of analysis (A) is a single, probabilistic statement about the future. “The future” has sample size n =1, much too small to reject any distributional hypothesis. Any single statement about the future becomes impossible to falsify once it is hedged with the word “likely”. That by no means makes such statements incorrect, but it does mean that in order to believe it one must implicitly suspend the strict epistemology of Science for the purpose in question. That’s the cost of shifting into a probabilistic view of the world. A set of probabilistic statements made under identical methodologies can potentially be subject to falsification, but that has no bearing on any individual one. That such statements most likely (oh, snap! meta-meta!) are indeed correct ought to present any saberperson with a troubling level of cognitive dissonance.

We’re deep into bizarro world when we’re declaring statements correct but their underlying epistemology questionable, so let’s get a little less abstract and ask what ought to have been the most straightforward question about our hypothetical statements A and B: Are they true? Being hypothetical, there’s of course no way to know, but anyone who has followed baseball ought to be comfortable with the idea that either, neither, or both could be true. If either, neither, or both could be true, does that mean the truth values of the two statements are independent of each other? NO!

Wait, huh? Dig into the assumptions. Statement A is premised upon a body of research that shows that over small sample sizes, performance can vary widely, and that as a statistical matter career-to-date performance is vastly more predictive of future performance than is the most recent 21 PA. All of the data forming the basis of that research has a common feature: It was generated by actual professional hitters on actual professional teams, all of whom have had managers, hitting coaches, and teammates observing them, precisely so that flaws get spotted as soon as possible. When a hitter goes into a slump, it is the hitting coach’s job to point out flaws that might be a factor. A hitting coach who makes Statement A to the player instead of B is simply not doing his job. If he doesn’t say statement B exactly, he will say something like statement B. Being strictly hypothetical, it’s all the same.  If a mechanical flaw is the cause of the slump, then the player or his coach will discover it, and the combined forces of survival instinct, competitiveness, income maximization, and simple professional pride will lead the player to correct it. This is the normal ebb and flow of baseball. This normal ebb and flow of baseball forms the entire sample for the research upon which statement A relies. Hello again, Selection Bias, glad you came back! Statement A is true only if Statement B, or something like Statement B, is true. Furthermore, if B is true, then A is true only if the player realizes the truth of B, either by being told by a coach or discovering it himself.  Alternatively, If the real reason a hitter has started popping up and missing a lot of pitches is instead that he’s lost batspeed due to aging or injury, then statement A is false. Near-term mean-reversion is not likely in those cases. To say that statement A is likely true is simply to say that correctable flaws are much more common than uncorrectable skill declines, and that as a historical matter, players have been expeditious about correcting the easily correctable before generating large sample sizes.

Let’s resume our Popperian examination, this time with “narrative-constructing” Statement B. On close examination, it very much is falsifiable, on several levels: 1) It makes definite, unhedged assertions about observable reality that can be objectively and transparently evaluated, and 2) it proposes a causal mechanism that can be tested and begs for an experiment.  That sounds a lot like proper science. Ah, but there’s a catch: only the player himself has the ability to run the suggested experiment. The literary and the sociological factors return! The saber-inclined reader can easily miss the testability of the statement if he identifies not with the player but with management, because management cannot run such a test.

If the reader began this essay agreeing with the “sabermetric” view that statement ‘A’ is the scientific, responsible piece of analysis and ‘B’ the empty bullshit and hasn’t gotten the point yet, it’s time to level the boom: The truth is the reverse; it is statement ‘B’ that is genuinely scientific and ‘A’ that is the empty bullshit.

The Way Forward

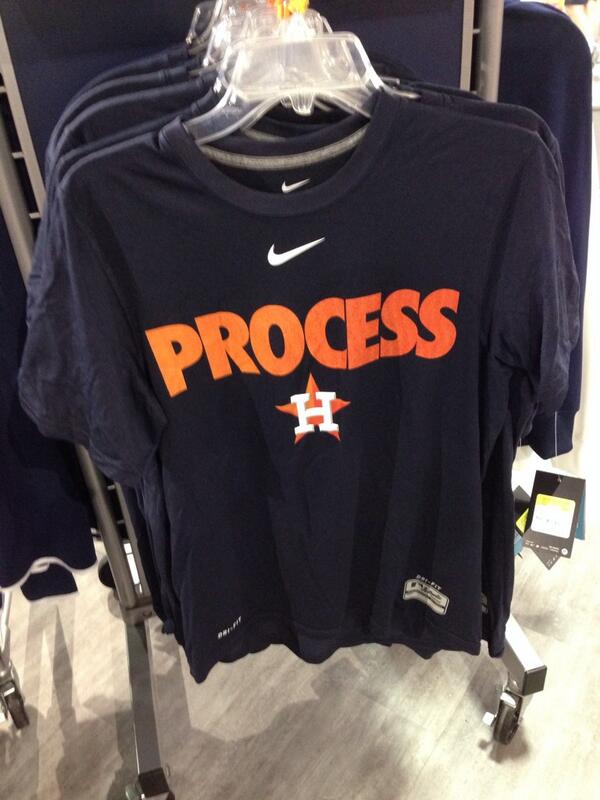
What should be done in light of this truth? If there is a single phrase that expresses the ‘progressive’ management model to which most of saberworld adheres, it is “Process over Results”. That phrase, and the sentiment it expresses, are now sufficiently ubiquitous to be entering the MBA lexicon. Nike sells that T-shirt. It is a good general principle to live by, but once consultants figure out that it is also an infinite excuse generator for mediocrity and outright failure, it will shortly thereafter occupy a spot on the business buzzword bingo board alongside “Synergy” and “Leveraging Core Competencies.” Before that sad day arrives, cutting-edge baseball analysis ought to apply it in a way it has not yet done.

Sabermetric analysis has been very good in applying that principle in the evaluation of management decisions. That’s the easy part, since saberworld identifies with that process closely enough, and feels sufficiently knowledgeable about it to pass judgement. Conversely, sabermetrics has rarely if ever taken that viewpoint regarding its evaluation of players. On that front it has always been and remains resolutely results-oriented. Shifting from AVG to OBP to wRC+, or ERA to FIP, or E to UZR is not shifting from results to process. It is merely identifying a superior, more fundamental, more predictive result upon which to make judgements. Even at the most fundamental level possible—batted ball speed / launch angle/spin—one is still looking at a result instead of a process.

Players themselves, even the most saber-friendly, when asked about advanced stats typically give a highly noncommittal answer. Usually, it’s something along the lines of, “The numbers don’t really tell the whole story.” Saberfans usually assume this response is the meathead’s answer to Barbie. Math class is tough! Let’s go hit fungos! The post-structuralist-inclined will also usually think that the players’ refusal to unreservedly accept the definitiveness of sabermetrics is driven by a subconscious, defensive instinct to retain “control of the narrative.” That both of these explanations have an element of truth makes it easy to think they are the whole truth. They are not. Players are just operating on the same premise we have already endorsed: Process over Results. Because they are young, unacademic, and routinely measured against a ruthlessly tough standard, it is easy to forget that they are professionals operating at the most elite end of the spectrum. The difference between the players and the sabermetricians is that the players see Process in a way the rest of us can scarcely imagine and make their judgements accordingly. Should we accept those judgements uncritically? Of course not. Players like everyone are subject to all the biases datasplainers love to bring up when they are losing arguments (Decrying, “Confirmation Bias!” every time someone presents evidence one dislikes should be a punchinthefaceable offense). We should instead try to figure out how to test them. That means looking at Process through their eyes.

What does Process mean to a player? It means two things: mechanics and psychology. The psychological may always remain opaque to the outside observer, but the mechanics need not. On the contrary, the mechanics are there, open for all to see, and nowadays recorded from multiple angles at 240 fps. There is a wealth of data waiting to be captured there. When conjoined with PITCHf/x and Statcast, we can now have a complete physical picture, literally and figuratively, of what goes on for every single pitch in MLB. We should make use of it.

The gif-ability of pitches has already rapidly changed online baseball writing. No longer must a writer attempt to invent new superlatives to describe the filthiness of a slider when a gif can do it far better than words. It has also opened a new seam of sabermetric inquiry that has only barely begun to attract pickaxes–How do mechanics lead to batted-ball outcomes? Dan Farnsworth has written some great posts at FanGraphs starting down that path, as has Ryan Parker at BP. Doug Thorburn, also at BP, writes articles along these lines on the pitching side. As fascinating as those articles are, the problem they all share is that they take the form of case study rather than systematic compilation. The latter ought to be attempted.

It is fortunate that sabermetric semantics has settled on “luck” rather than “randomness” as the converse of “skill,” because nothing that transpires on a baseball diamond is truly random, and to insist otherwise is fatalistic laziness. Baseball exists in the Newtonian realm; the dance of a knuckleball is an aerodynamic rather than quantum phenomenon. “Random” in baseball is just a placeholder for anything with results that seem to adhere to a distribution but whose process remains mysterious. The goal of sabermetrics going forward ought to be shrinking that zone of mystery. Between physicists, biomechanical experts, hitting & pitching coaches, and statisticians it should be possible to answer some important questions–Is there such a thing as an optimal swing plane? If not, what are the trade-offs? Can we backward-engineer from outcomes the amount of torque in a swing and identify what hitters are doing to generate it? Ash or Maple? Is topspin/backspin something a hitter can actually affect? On the pitching side, can we actually identify a performance difference from a “strong downward plane”? Is Drop & Drive a bad idea? All of these questions are susceptible to scientific analysis, because they are fundamentally physical questions. With high speed HD cameras, PITCHf/x, and Statcast the answers may be out there.

Answering questions such as these will not only make for interesting SABR conferences. It would go a long way to bridging the gap between saberfans and ordinary fans. It would improve everyone’s understanding of the game. Above all, it would improve the actual quality of baseball at all levels. Anyone who has been involved in competitive baseball has encountered dozens of hitting and pitching “philosophies” and has had no way other than personal trial and error to judge between them. At present there is just no way to tell if the medicine a coach is prescribing is penicillin or snake oil. That “philosophies” of pitching & hitting are promoted as such is an implicit attempt to wall them off from empirical rigor. This shouldn’t be tolerated any longer than it has to by the saber set. Sabermetrics began as an attempt to measure greatness. Its greatest legacy to baseball could be in helping create it.


Quantifying Outlier Seasons

I’ve always been fascinated by the outlier season where a guy puts up numbers well above or below his career pattern (Mark Reynolds’ 2009 steals total is one of my favorite examples). I wanted to take a look at the biggest outlier seasons in baseball history. To do this, I ran the data on every player-season since 1950 and calculated a z-score for each season based on the player’s career mean and standard deviation for that stat (only including qualified seasons). While the results were interesting, in my first pass through I did not control for age and the results were largely what you would expect – lots of guys at the beginning or ends of their careers.

On my second pass, I rather arbitrarily restricted the age to 25-32 to attempt to get guys in the middles of their careers. I think these results ended up being pretty interesting. The full list is here, but I’ll highlight a few below:

null

I had never heard of Bert Campaneris, but it turns out he was a pretty good player who put up 45 career WAR, mostly as a speedy, light-hitting, great-fielding shortstop. But in 1970, he briefly turned into a power hitter. He hit 22 home runs, his only season in double digits. He hit two in 1969 and five in 1971, playing full seasons both years. So this wasn’t even a mini-plateau. This was a ridiculous peak that he would never come close to again. We don’t have the batted ball data to dig further, but I would love to know just what was going on that year.

Dawson, on the other hand, was a pretty good home run hitter who usually hit 20-30 a season, except in 1987 when he blasted 49. Usually guys hitting crazy amounts of home runs in the late 80s through the 90s wouldn’t be that interesting, but these guys played for a long time after, never coming close to their 1987 totals again.

The guys on the downside are all fantastic home run hitters. With guys playing a full season and falling this short of their numbers, it’s always a possibility that they were playing hurt. Schmidt did indeed play hurt in ’78, but a quick Google for Thomas and Carter brought up nothing, making it all the more inexplicable.

null

As I mentioned above, in 2009 Mark Reynolds went 44 HR/24 steals. That was Reynolds’ only season stealing more than 11, but it “only” registered a z-score of 2.0. The three guys listed here blow that out of the water. Zeile had his season early in his career so it could have been a case of a guy losing speed or getting caught too many times and then being told to stay put. But Palmeiro and Yaz did it right in the middle of their careers. Palmeiro’s stolen base record consists of usually stealing 3-7, and getting caught 3-5 times. But in 1993, he decided to steal 22 while only getting caught 3 times. The next year he was back to his plodding ways.

On the negative side, Crawford’s struggles have been well documented. Driven by a .289 OBP and possibly declining health, Crawford’s 18 steals in his dismal 2011 season were the lowest amount of his career in a qualified season by far. We knew it was a shocking performance at the time, but I didn’t fully grasp its historical significance.

null

The last things I will look at are plate discipline numbers. They differ from home runs and steals because they represent hundreds of interactions, thousands if you consider individual pitches, rather than the dozens that the former two represent.

Mantle’s 1957 season deserves some attention (although he put up 11.4 WAR so it probably gets plenty of attention). That year, he put up the second best walk rate and the best strikeout rate of his career, at age 25. After that he went right back to being the great player he was before, albeit with slightly worse plate discipline stats.

Except for Money who was a guy early in his career working his way into better walk rates, this is something I don’t have a great explanation for so I’d love to hear theories. Why did Ripken in 1988, right in the middle of his career, take a bunch of walks and then never do it again to that degree? Likewise, how was Brett Butler able to cut his strikeout rate from 8.7% to 6.3% in 1985 then jump back up to 8-10% for the rest of his career?

Before I corrected for age, I got a bunch of results of guys at the tail end of their careers doing what you would expect. I do want to highlight one of them, however. In 1971 at age 40, Willie Mays had a 3.7z walk rate and a 3.1z strikeout rate. He walked a ton, but also struck out a ton. Added with his 18 home runs, that season he had a robust 47% three true outcome percentage. As the z scores show, it was a radical shift from anything he had done in his career and impressively, he used this new approach to put up a 157 wRC+ and 5.9 WAR. Apparently that guy was pretty good.

This piece identifies the biggest outlier seasons in history, but is crucially missing the why. And unfortunately, for most of these that’s not something I have a great answer for. If you have enough player-seasons, you’re going to expect some 3z outcomes. But historical oddities are one of the joys of baseball and each of the 3z outcomes is the product of a radical departure in underlying performance. I think it would be fascinating to talk to some of these guys and see what they have to say about why things went so differently for one season.


The Risk of Long Contracts for Middle-Market Teams

Middle-market teams have historically tried to play the game like they are mini-large-market teams. They develop talent and when they have enough to make a run at the playoffs they make moves. They buy free agents, extend players through their age 27-33 years, and trade for proven talent. Unfortunately this usually does not work and we often see one of the top six most expensive teams (or the Cardinals) in the playoffs year after year. Then, the middle-market team’s “window” has closed, and the wait starts over.

It is time to have a change in the tradition of middle-market teams, and this includes the Texas Rangers.
The focus should not be on operating on a “window” of time where a World Series run is possible, but to create a team where there are very few years where this window is not open. The Cardinals are a good example of executing this plan. They rotate talent in and out due to a solid player-development system, while making very few large free-agent signings. This leads to a team where there is never too much money tied up to one or two players, and they can afford to make short-term deals or trades for players who add value to the team immediately without tying up long-term cash.

Let’s talk about how this relates to the Rangers though, specifically Elvis Andrus and his extension as this issue extends to all of the contracts the Rangers have given out. Most people look back and ask the wrong question as it was never about whether the Rangers thought Elvis was really going to be good for his contract. The Rangers obviously thought that he would be. The question the Rangers should have asked themselves is, should a middle-market team take a large risk by signing a player whose peak will probably be around age 26 to an eight-year extension, well past his peak? For a middle-market team, the contract is near impossible to avoid down the stretch if for some reason the player does not achieve the level of success that is expected.

Other situations, like Adrian Beltre, have worked. However, can you imagine a world where the Rangers spent all that money on Beltre, only to have him be awful? Of course you can, and it would have been miserable. The Rangers were fortunate that Beltre had a second peak at 31 that has lasted five years. Beltre is the exception, not the rule, and the Rangers should not expect to get lucky on a contract like his very often. It was a very high-risk offer that ended up working out. Unfortunately, we have the opposite side of the spectrum as well. Shin-Soo Choo was given a similar contract to Beltre, at a similar age. Unfortunately, this contract appears to be flat and the Rangers are already looking for a way to move Choo on.

The Rangers made a series of high-risk contract moves when they had players in the minors who were only a year or two away from being able to contribute on a major-league team, which led to a large amount of money being tied up. This is not to say that all long-term contracts are bad. If the Rangers were able to find a franchise player who brings extreme value consistently with a skill set that ages well, the risk would be worth the shot as long as a reasonable deal could be achieved.

The ultimate conclusion is that as a middle-market team, the Rangers should have a change in focus from spending money on long-term contracts, which are huge risks, to using money and trades to put together a solid supporting cast of players on shorter-length contracts. These players will support a group of younger cost-controlled players where their risk of failure is not tied to large amounts of cash. It is a superior strategy to hoping that during a window of opportunity, where long-term contract players are not past their prime, the team will make the playoffs a few times. If played correctly, with the Rangers’ amazing farm system and development team, the Rangers could have a consistently good team for long periods of time.


Devon Travis, Sign Stealer?

Devon Travis has been a pleasant surprise for the Jays this season, as he’s hit better than anyone could have expected out of the gate.  Despite a horrible month of May when he tried to play through a shoulder injury, he’s hit to a 129 wRC+ so far with solid defense at 2nd.  Additionally, he may be helping the Jays in other ways, as it seems as though he may be involved in stealing signs.

I was watching the Jays game against Oakland July 22nd, and after Devon Travis hit a double in the top of the 9th inning off of A’s closer Tyler Clippard, I began to notice Travis making some obvious movements at 2nd base.  Sometimes, I would see him clap his hands together enthusiastically; other times, I would see him hop up and down a few times. I then paid attention to the pitches that were subsequently thrown, and noticed a pattern: Whenever Travis would clap his hands, Clippard would throw a fastball, and whenever Travis would hop, Clippard would throw an offspeed pitch.  I decided to go back to the MLB.tv game archive to confirm what I thought I had seen live, and here is what I found:

Batter – Jose Reyes

Travis did not make any motions during the first five pitches to Reyes (likely, he was learning the signs). On the sixth pitch, he clapped, but Clippard stepped off and they ran through the signs again.

Batter – Josh Donaldson

Like with Reyes, Travis did not make any motions right away, as he looked at four pitches to get the signs down. The fun starts with pitch five:

Travis Motion – Clap

Clippard then steps off, followed by:

Travis Motion – Clap

Pitch – Fastball (92 mph)

Pitch six:

Travis Motion – Hop

Pitch – Offspeed (83 mph)

Pitch seven:

Travis Motion – Hop

Pitch – Offspeed (76 mph)

Batter – Jose Bautista

Pitch one:

Travis Motion – Clap

Pitch – Fastball (91 mph)

Pitch two:

Travis Motion – Clap

Pitch – Fastball (90 mph)

Sadly, after the second pitch to Bautista, the catcher visited the mound, and for the remaining three pitches in the at bat (which Bautista walked, moving Travis to third base) Travis did not make any motions (again, he probably figured they changed the signs).

So what we’re left with is five pitches (three fastballs, two offspeed) where the pattern holds up, and logical times when Travis does not clap or hop (i.e. after first reaching second base and after the mound visit when the signs could change). To me, given all the evidence, I don’t think the actions by Travis are coincidental, and I’m pretty certain he was stealing signs.

I was curious if this was a one-time thing, or something that Travis has done in the past, so I had a look at some other games in July in which Travis reached second base and was there for a few batters (i.e. long enough for him to pick up the signs).  Unfortunately, I wasn’t able to spot any patterns that would indicate he was stealing signs in those games that I checked.

As a Jays fan, Devon Travis is already one of my favourite players, as he’s having a fantastic rookie season at a position that has long been a black hole for the Jays.  Now, he’s given me further reason to appreciate him, and a definite incentive to watch his at-bats and times on base a little more closely from now on.