Battle of the Ks: K/9, K/BB and K%
The great debate has been raging for years: which strikeout-related metric is a better predictor of actual pitching success? Some would say there is no right or wrong answer — that each metric has it’s own unique merit and value. That one must look at certain strikeout-related metrics in combination with others. Unfortunately, as tragic as it may seem, statistical evidence begs to differ. Statistics tell us there is in fact a right answer, and it’s a whopper.
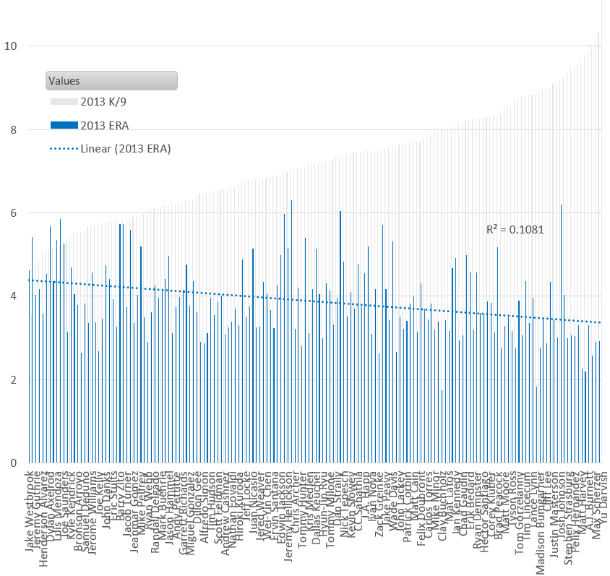
Let’s start with K/9. Looking at all 2013 pitchers with 80+ innings, the correlation (R2) between strikeouts per 9 and ERA is a solid .1081. This correlation has been consistent, plus or minus a few hundredths, for the past five years. So nothing exciting or anomalous can be found in looking at other seasons. Yu Darvish leads the category with Tony Cingrani, Max Scherzer, Anibal Sanchez, and A.J. Burnett rounding out the top five. Additionally, eight of the top ten K/9 leaders ended up with sub 3.10 ERAs. So a decent indicator all-around.
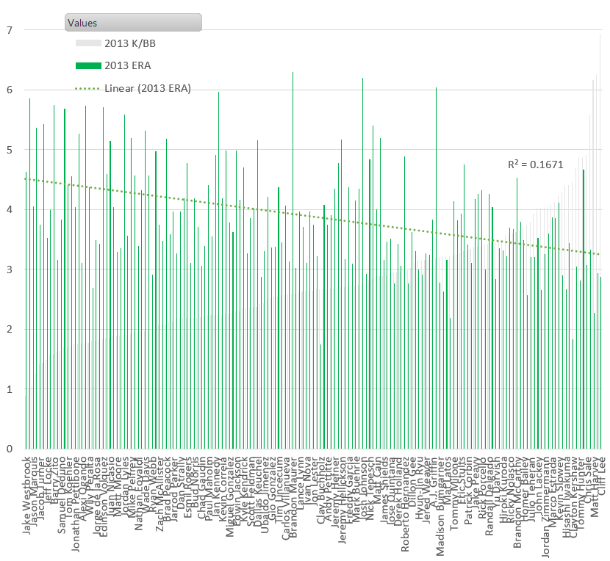
K/BB get’s a bit more interesting. We see a jump in linear correlation to .1671 — more than a 50% increase over K/9. Clayton Kershaw, Cliff Lee, and Adam Wainwright all leap into the top ten of this metric, with Hisashi Iwakuma climbing into the top fifteen — four elite hurlers in 2013 left out of the K/9 leaderboard.
But the real gem is K%. It shows double the correlation versus K/9. Plus, the top fifteen in this category ended the year with sub 3.30 ERA — whereas Scott Kazmir (4.04) and Josh Johnson (6.20) smeared the good name of the K/9 leaderboard; with Kevin Slowey (4.11) and Dan Haren (4.67) unpleasantly loitering on the K/BB board.
The reason K% is so powerful is that it simplifies how effective a pitcher is at simply striking out each batter he faces. When BABIP gets involved — as it does for K/9 (high BABIP pitchers are rewarded on K/9 since the number of outs remains the same even if they’re giving up, say, 10+ hits per game) — the value of each strikeout is severely reduced.
To recap:
| 2013 | R2 (correlation to ERA) |
| K/9 | .1081 |
| K/BB | .1671 |
| K% | .2089 |
So should we end the debate completely? No. But if you asked me to put money on Tim Lincecum, a career 25.8 K% pitcher with no decline in the stat over the past 2 years, over Tyler Chatwood, a career 13.0 K% who had a breakout year in 2013 with his freakish 76.3% LOB, I would bet on Lincecum every doggone time.
Slava Heretz is a Finance Manager, Red Sox fan, and adult ball league hack in Somerville, MA. Business metrics is like sabermetrics... just a different form of nerdy storytelling.


Great analysis. My only quibble would be a preference to see the graphs in a scatter plot form, but I think the bar graph was pretty good as well.
Also, maybe we would get different results if we set a minimum innings threshold. There’s a reason Josh Johnson is the huge outlier; He only pitched 81 innings. I feel like the correlations end up being more reflective on where the outliers fall, rather than the overall trend.
Either way, interesting results. I’m somewhat surprised K/BB doesn’t have the greatest correlation with ERA.
Interesting thought. The reasoning behind 80+ innings was to create a larger sample size. My gut says results would stay the same, but I’d be curious to run data on totals over the course of, say, the past 5 seasons with, say again, guys with 300+ innings. This would add relievers to the data set as well.
Awesome! I’ve been thinking K% was the way to go for quite some time now for the exact reasons you ended up specifying…It’s nice to see my hunch verified by some simple, effective analysis!
Hate to nitpick, but R squared is not correlation. R squared is a measure of how well the data fits around your model or line of best fit (correlation). The higher the number, the better predictor and more accurate your model or line is.
Correlation is a number between -1 and 1.
Forgot to add that R squared explains variability. The more variability that’s explained, the more accurate your line or model!
Interesting analysis though. I’ve always used K/BB…
Why the neglect of K-B in your analysis?
Yeah, if you want to use two components, K rate minus BB rate should have a better correlation than K to BB ratio.
What about k%/bb%…?
It’s the same as k/bb