Power and Strikeouts
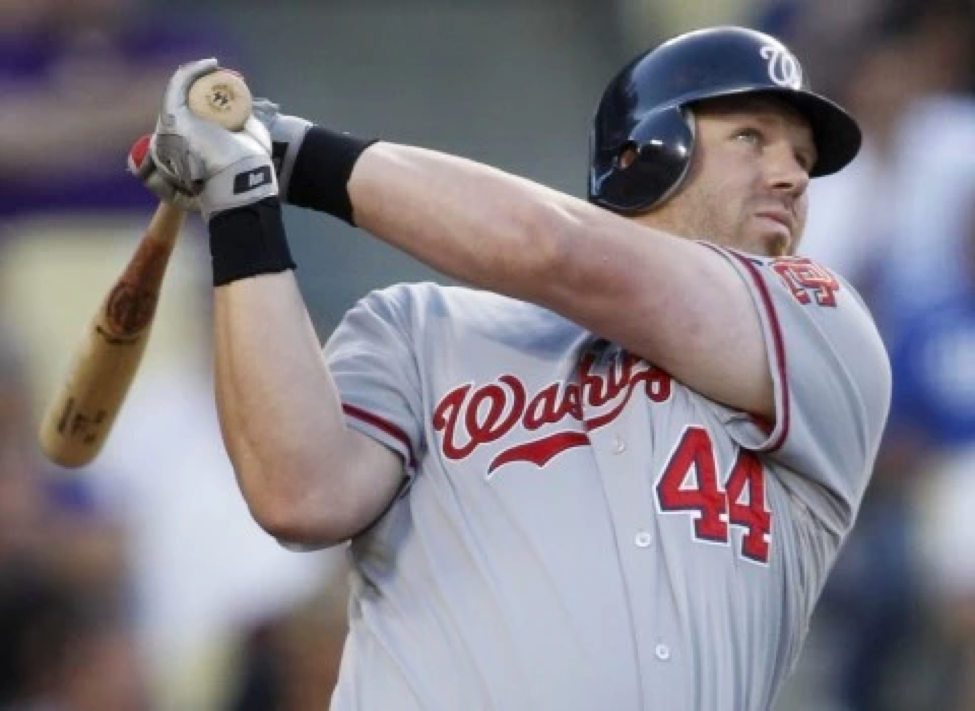
I’ve been a Washington Nationals fan since the team moved to D.C. in 2005. One of my favorite players to watch — though he was with the team for just two seasons — was Adam Dunn. The 6’6, 250-pound lefty masher was an incredible physical specimen who could hit home runs like nobody’s business. Unfortunately, the only thing he did better than hit homers was strike out. He’s 36th on the MLB all-time home run list with 462, and third on the all-time strikeout list with 2,379. Because of his high strikeout numbers and sub-par batting average on balls in play, he sported a lifetime batting average of just .237.
I bring up Adam Dunn because he’s a prime example of the baseball truism that I’ll be investigating today: Do power hitters tend to strike out more often?
This claim is deceptively tough to evaluate because there’s no one clear way to tell if, and to what degree, a player is a power hitter. I came up with as many rational ways to measure power as I could and compared each with strikeout rates. I’ll let you decide for yourself exactly how well each metric relates to power.
Traditional Stats
Let’s start with the most obvious measure of a power hitter: Home-run hitting.
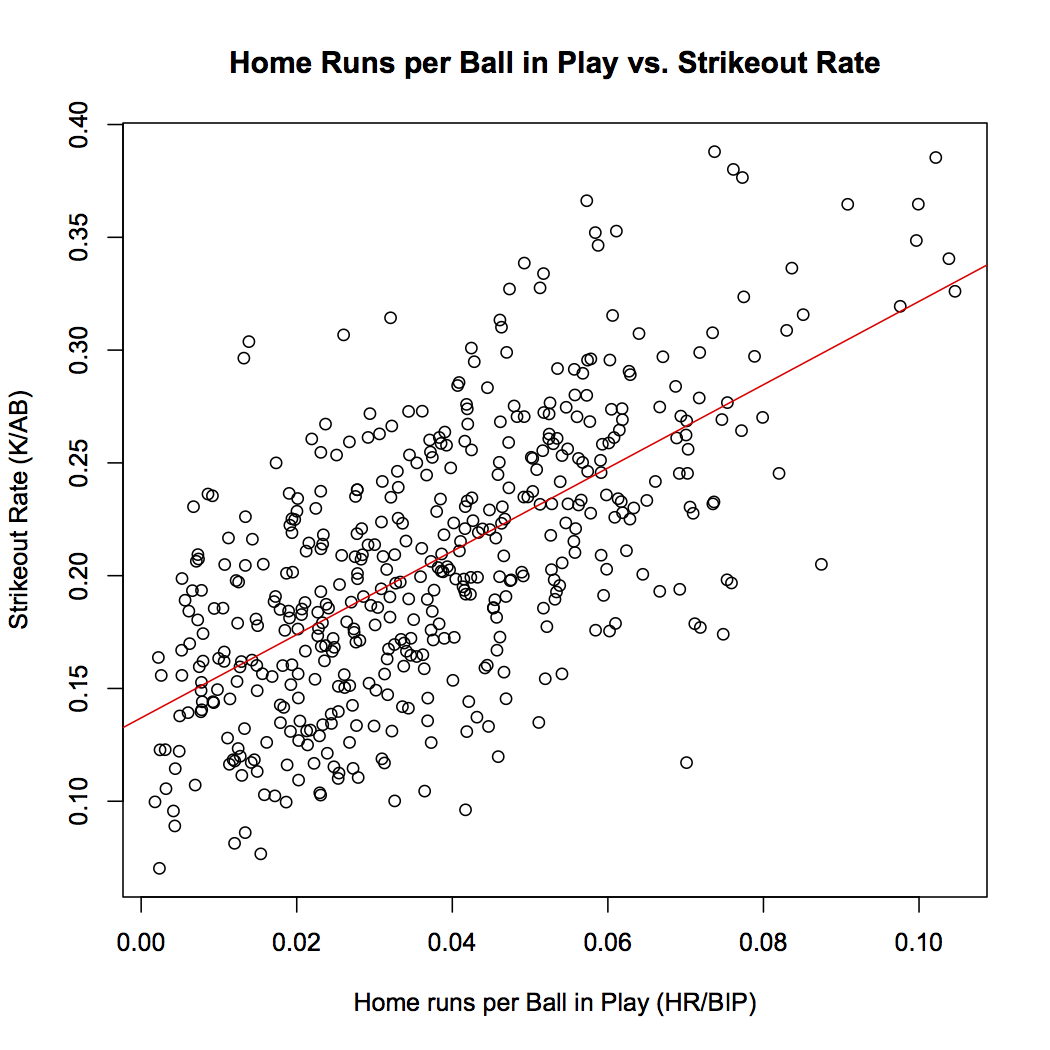
Here’s the correlation between a player’s home-run rate (HR/AB) and strikeout rate (K/AB).
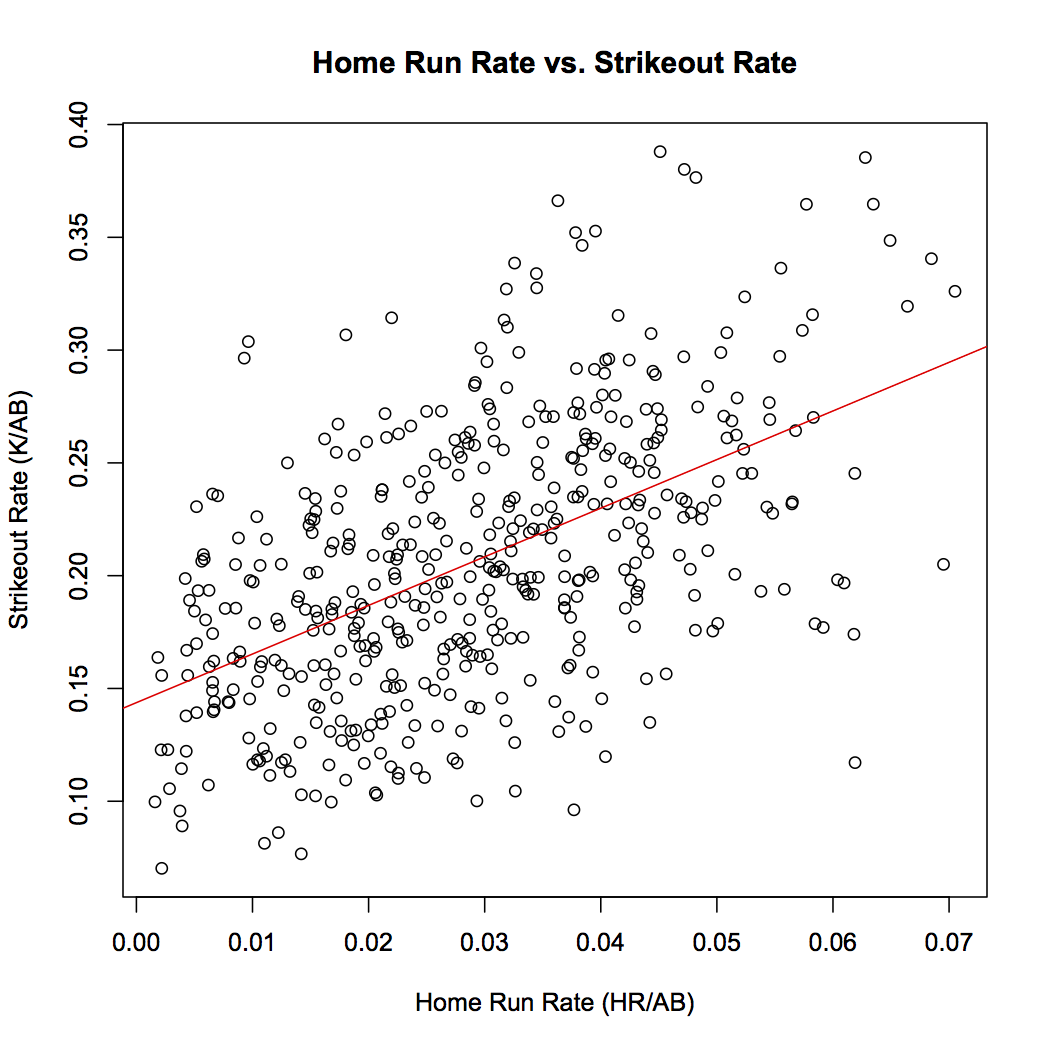
r = 0.527
A correlation coefficient of 0.527 isn’t bad, and you can see a clear upward trend in the data, but let’s keep going.
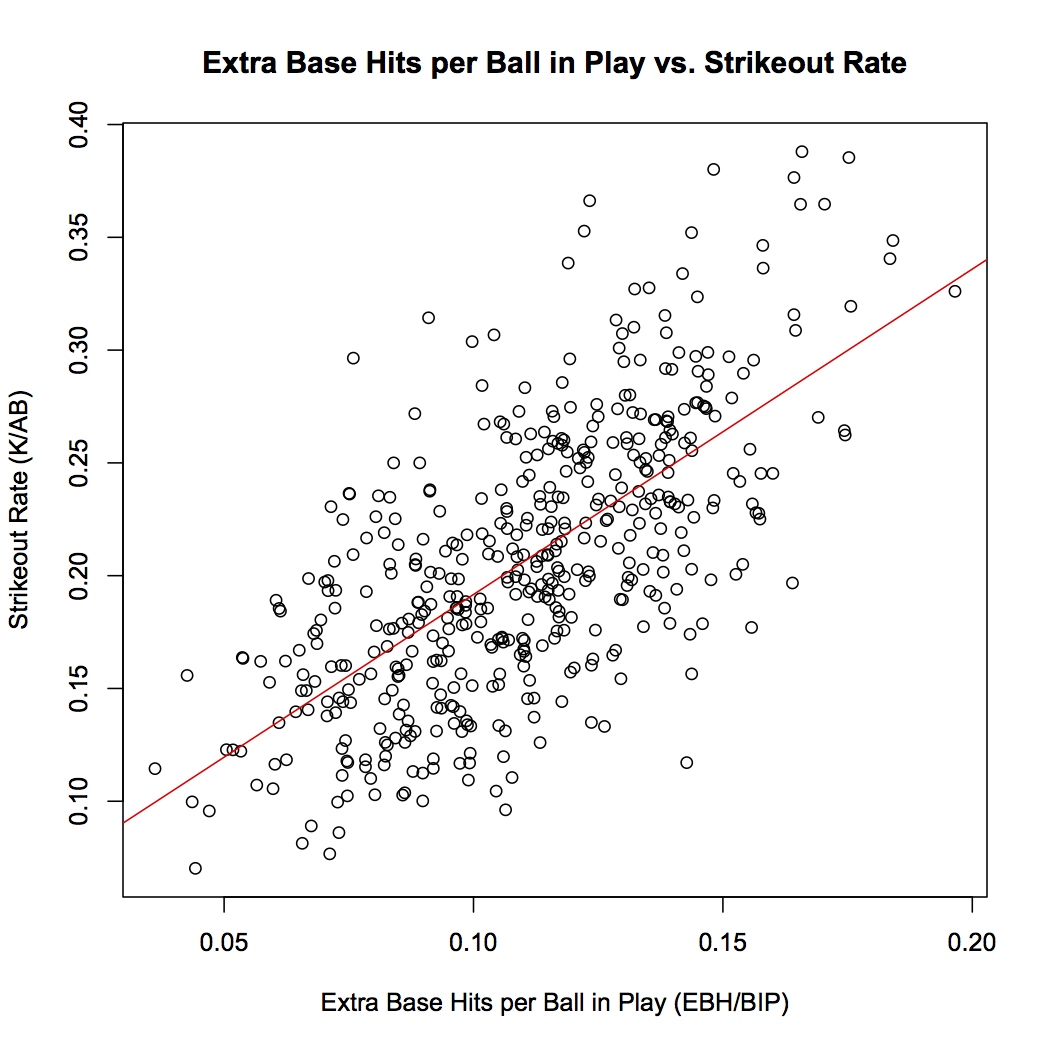
Home runs obviously aren’t the only way to measure power. Let’s see what happens when we expand our study from home runs to all extra-base hits.

r = 0.427
So it turns out there’s actually even less of a correlation with extra-base-hit rate than with home-run rate.
There is a flaw to evaluating power using per at-bat rates. If a player has a high strikeout rate his rate of any type of hit will be lower. Here’s what happens when we redo the previous two graphs using home runs and extra-base hits per hit instead of per at-bat.
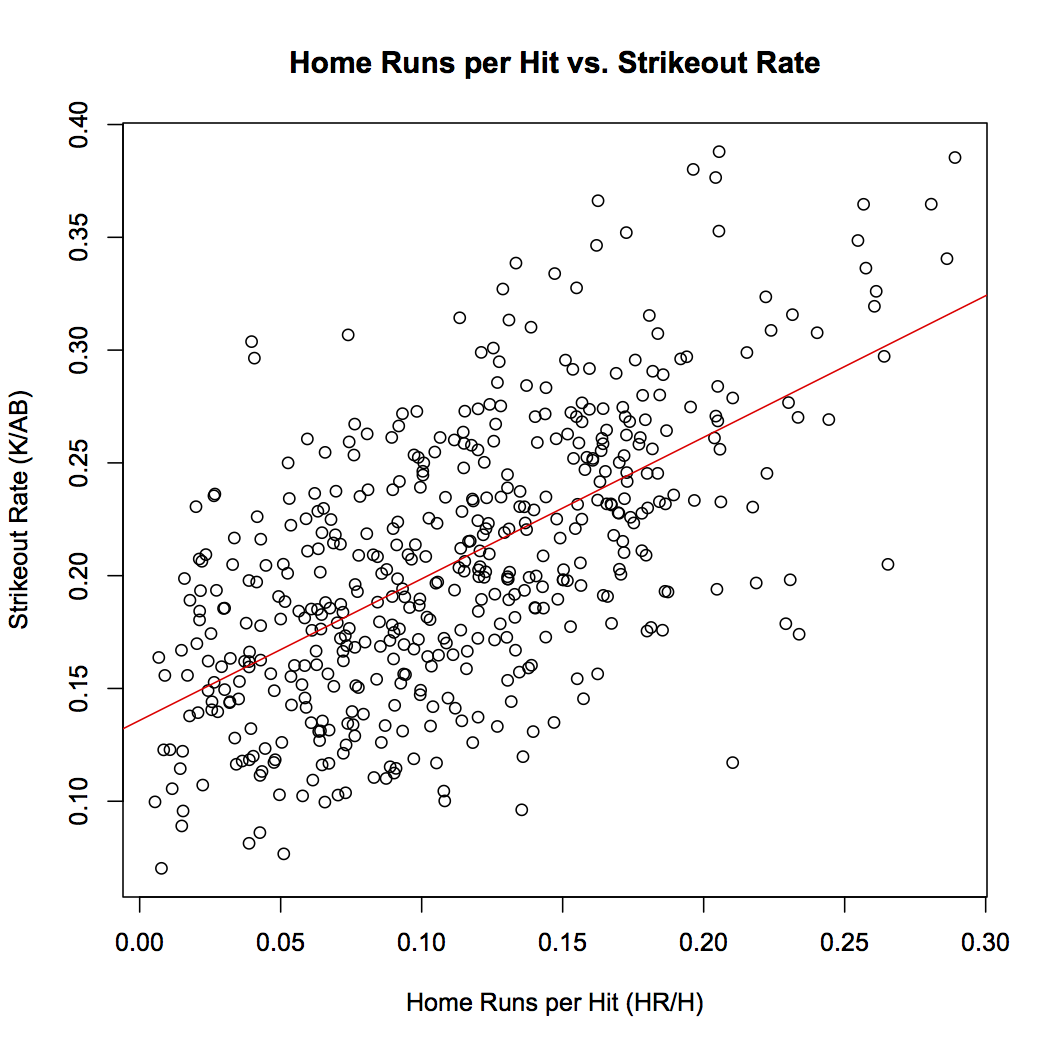
r = 0.609
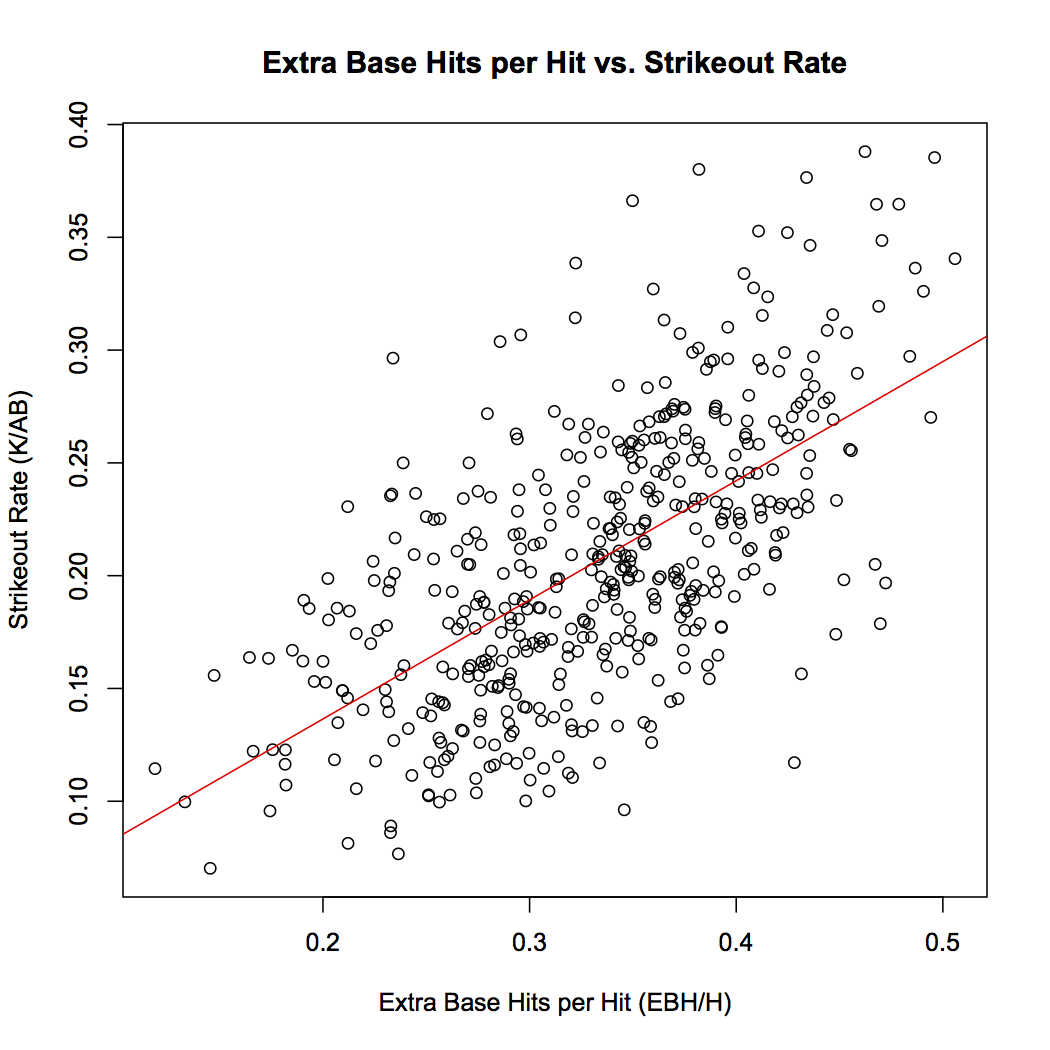
r = 0.627
Much higher correlation. Correlation in the .600 range isn’t the goal — but it’s definitely an indication that something’s there. Since non-per-at-bat rates seem promising, let’s try per ball in play as opposed to per hit.
r = 0.634
r = 0.669
Even stronger correlation. Let’s move on now to a classic measure of power: Isolated power (ISO).
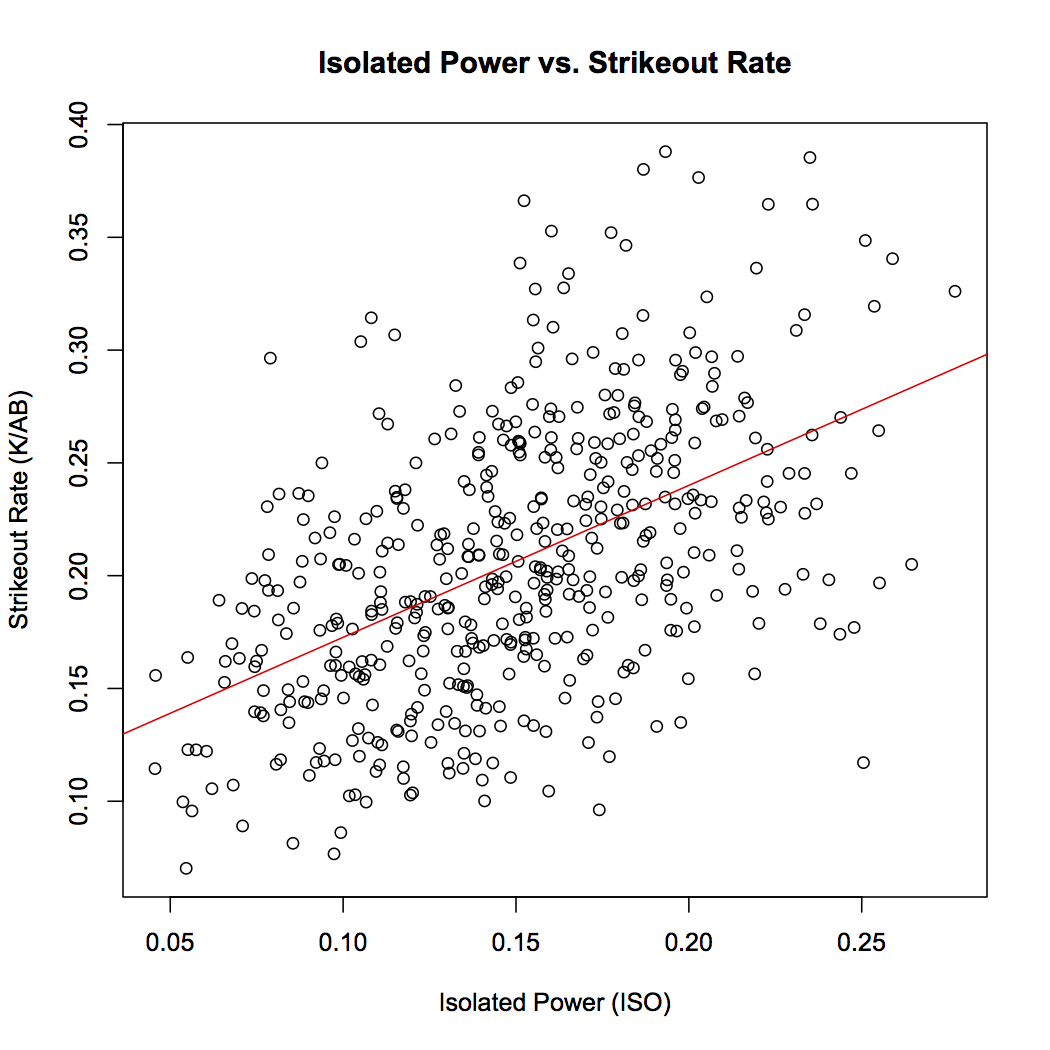
r = 0.508
Good correlation, but not as strong as we just saw with HR and XBH per hit and per BIP. But when you look at what ISO actually is, it’s a per-at-bat rate statistic.
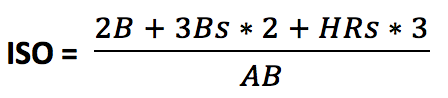
Why don’t we redo ISO as per hit or and per ball in play instead of per at-bat?
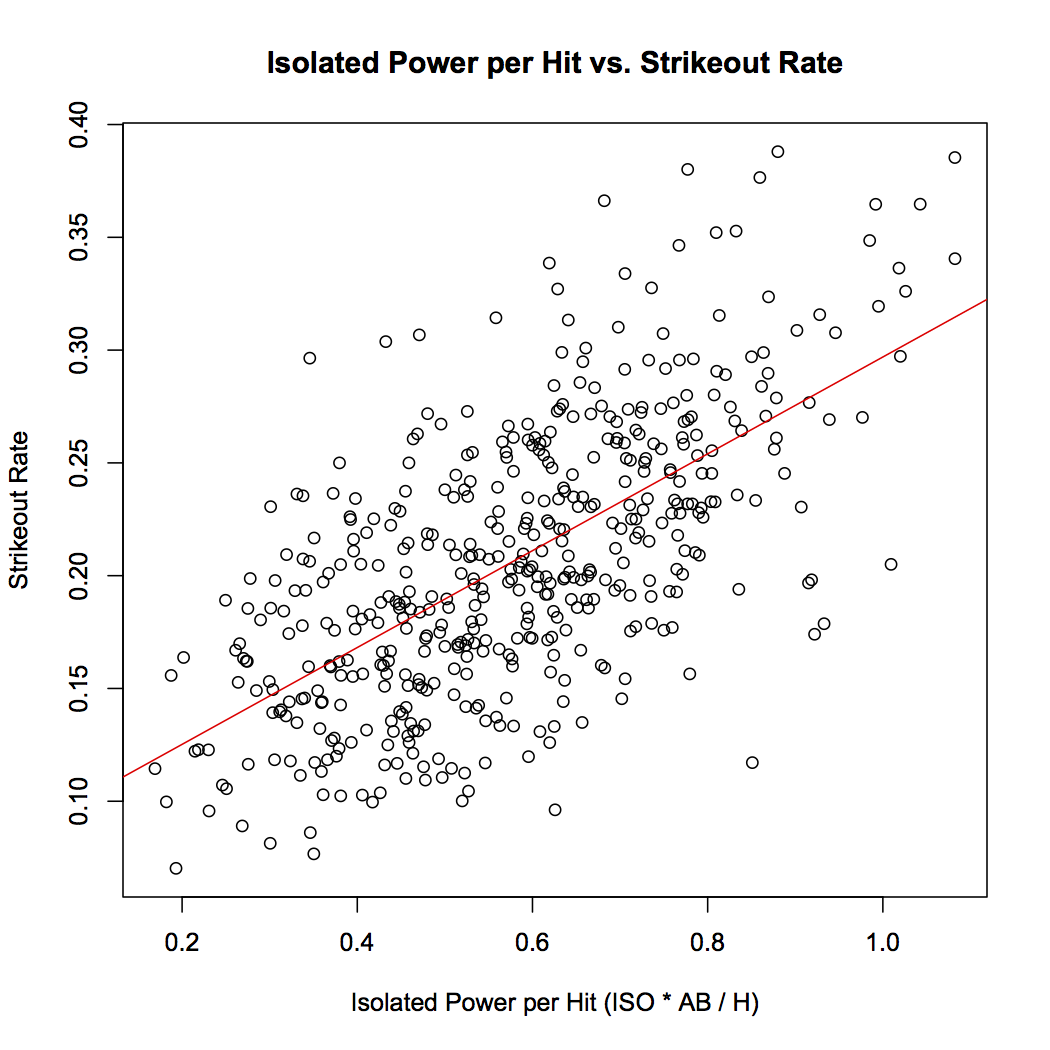
r = 0.642
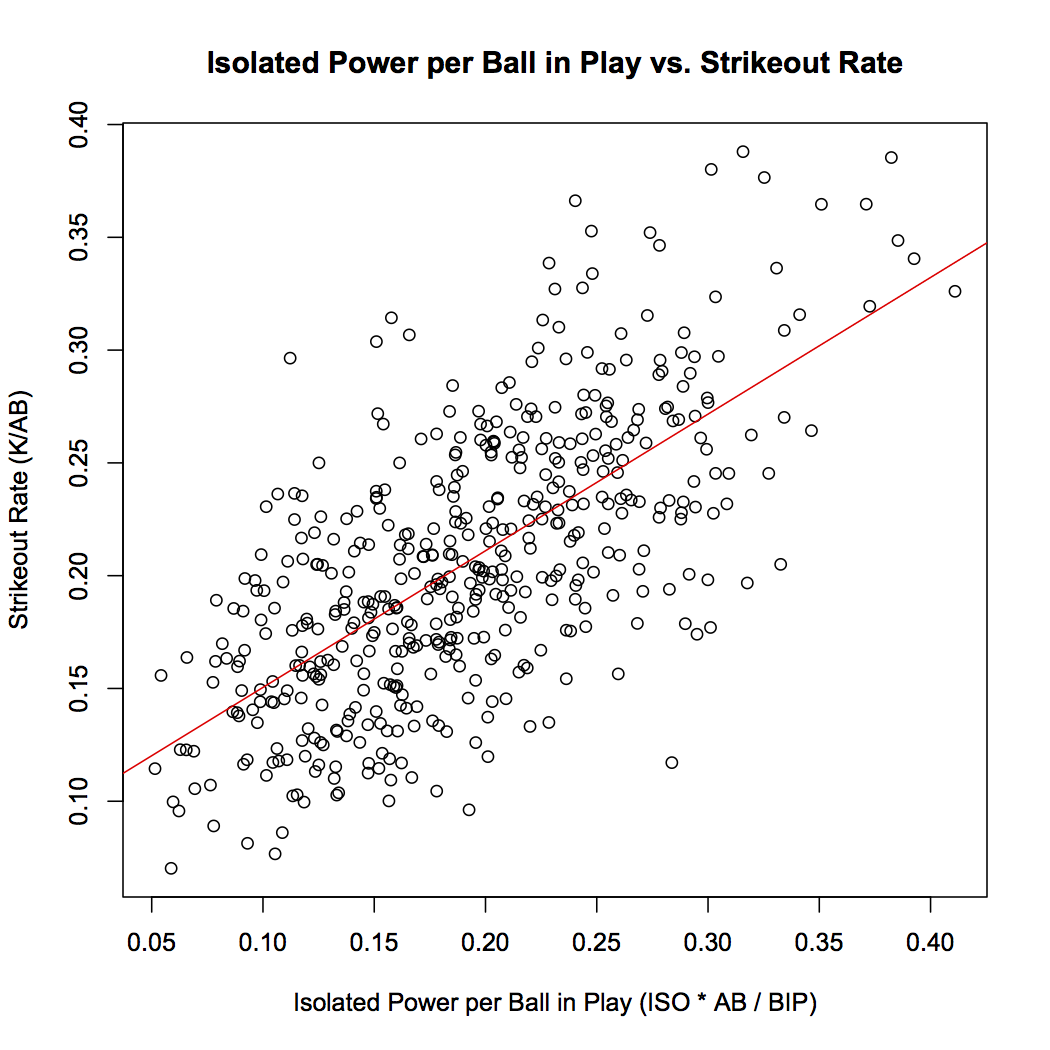
r = 0.673
So it turns out reworking ISO as per ball in play actually gave us our strongest correlation yet at 0.673.
Side note: I tried adjusting the ISO coefficients a couple of different ways since valuing a triple twice as much as a double and a home run three times as much as a double but just 1.5 times as much a triple seemed odd to me. As it turned out, the correlation didn’t get any better. Touché sabermetrics community, touché.
Statcast Stats
One of the great things about doing this study in 2016 is that we aren’t limited to traditional outcome-based stats. That being said, one of the less great things about doing this study in 2016 is there’s only one full season of publicly available Statcast data. As a result, I’m lowering my minimum observations per player from 1000 plate appearances to 100 at-bats. For context Manny Machado led the league in plate appearances in 2015 with 713. So we’re clearly going to see decreased correlation because of poor sample size. To give you an idea of what that looks like, here’s a few of the correlations from the previous section compared with what they would have been had I used 2015 Statcast data instead:
| Stat | 1000 Plate Appearance Correlation | 100 At-Bat Correlation |
| HR per BIP | 0.634 | 0.457 |
| EBH per AB | 0.427 | 0.133 |
| ISO per BIP | 0.673 | 0.495 |
| HR per AB | 0.527 | 0.302 |
What you should take from this is that the strength of pretty much all of the correlations we’re going to look at will be diluted. Many stats that appear to have rather weak correlation could have a real relationship given more data, we just can’t know. It’s unlikely we’ll see some really indicting evidence that a specific measure of power implies a higher strikeout rate, but it could give us a good clue of where to look in the future. So with that out of the way, let’s crunch some numbers.
One obvious way to use Statcast to measure power is to look at exit velocity. If you tend to hit the ball hard, chances are you’re a power hitter. Here’s how average exit velocity correlates with strikeout rate.
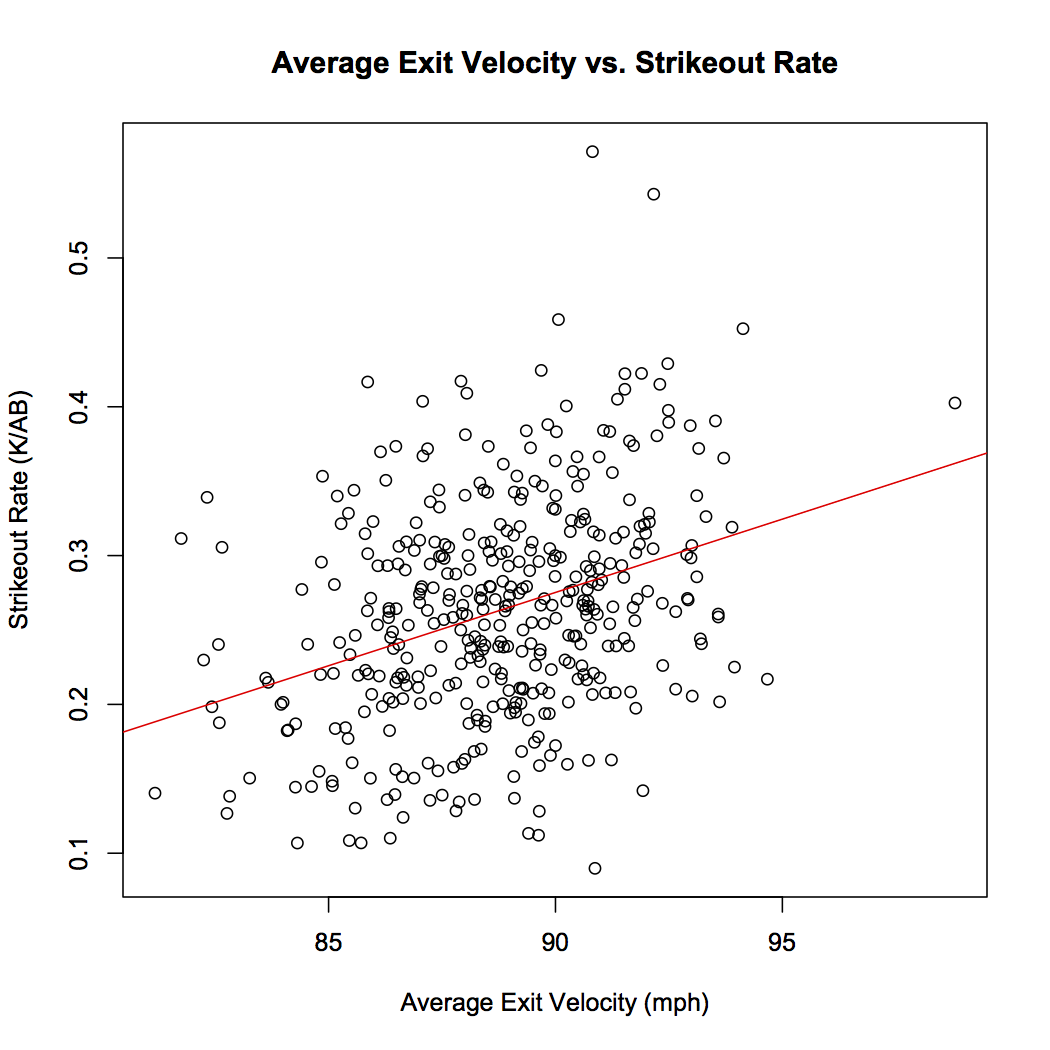
r = 0.338
There’s some correlation, albeit pretty weak. Perhaps power isn’t best represented by whose hits on average are the hardest but rather who has the highest rate of very hard-hit balls. Home runs tend to be hit at least 95 mph, so let’s check the correlation between rate of 95+ mph balls in play and strikeout rate.
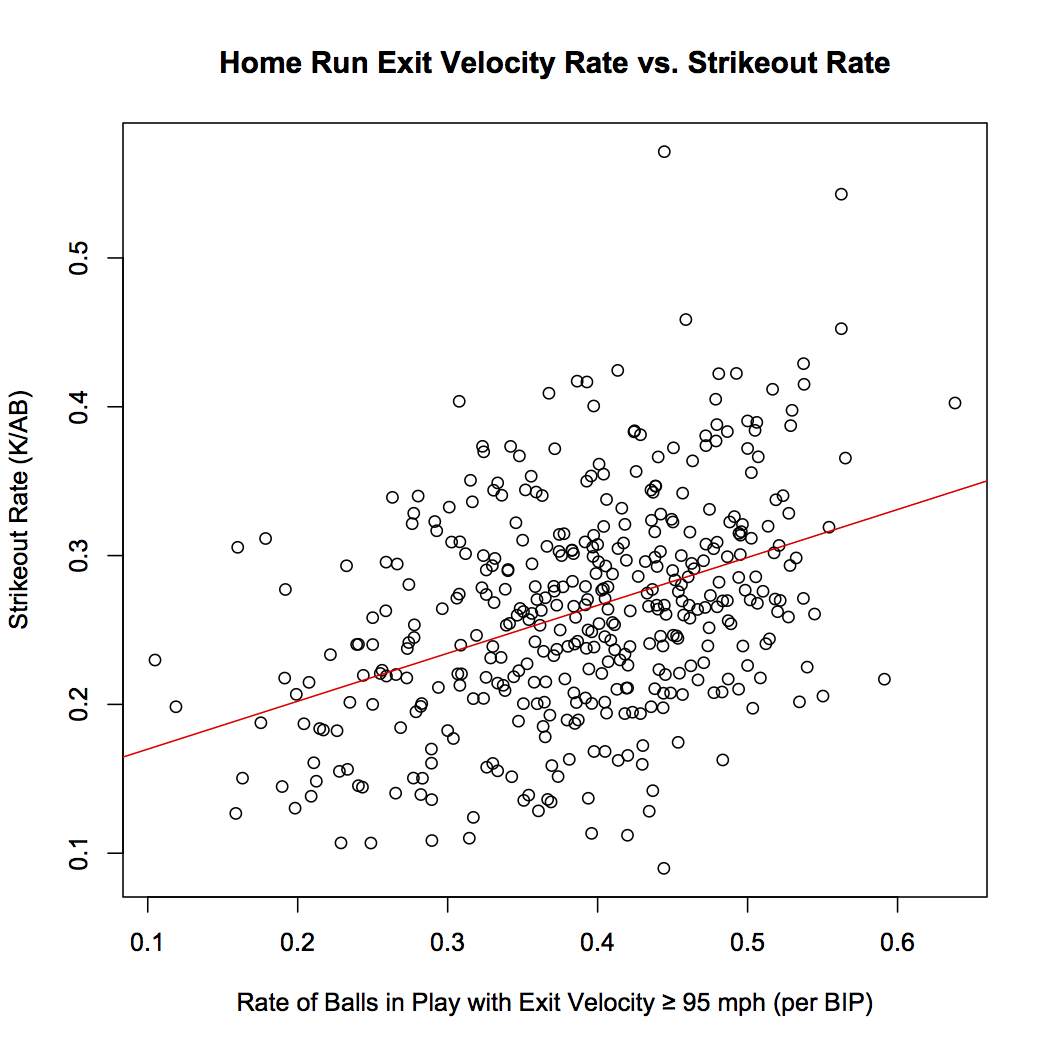
r = 0.393
There’s better correlation, but it’s still rather weak. Let’s move on.
Next up is launch angle. Power hitters hit more fly balls because that’s the only way to get a ball out of the park and a common way to hit a double.
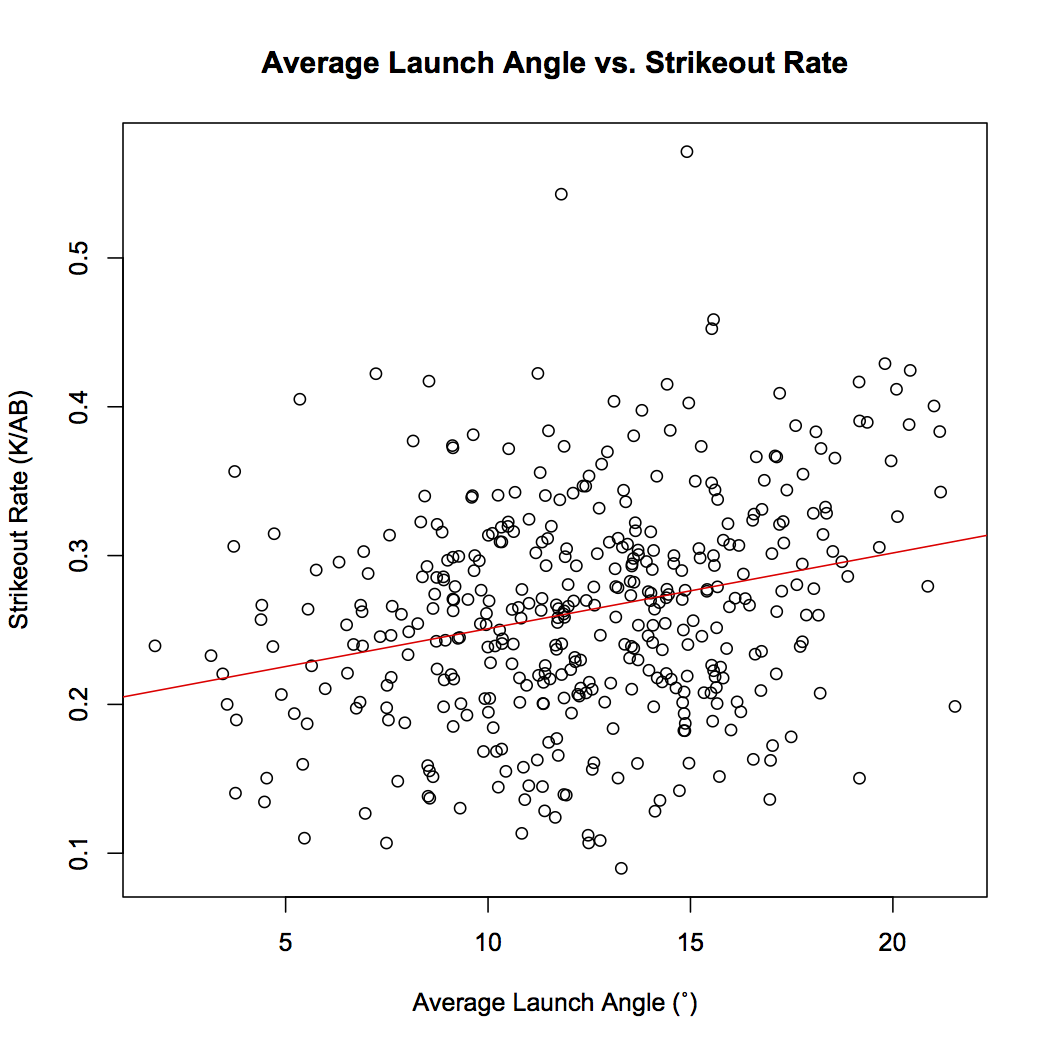
r = 0.260
There’s even less correlation than with exit velocity, and when I looked at the rate of “home-run launch angles” (25˚ – 30˚) the correlation went down even further to 0.093. While we’re on the subject, I checked the correlation for the rate of balls in play that both had an exit velocity of at least 95 mph and a launch angle between 25˚ and 30˚ and got 0.323 — lower than both exit velocity-only correlations.
Perhaps distance will yield better results. Below is the correlation between average ball in play distance and strikeout rate.
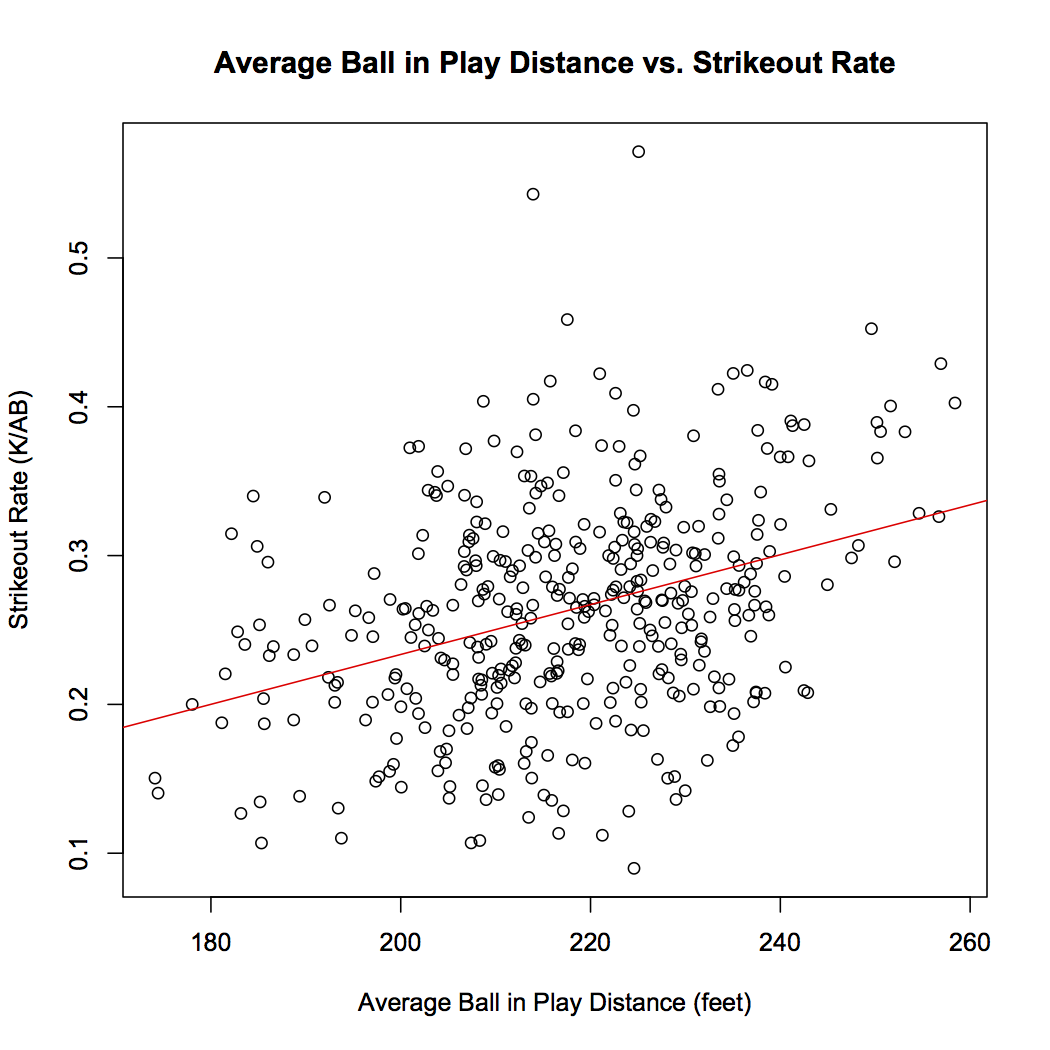
r = 0.353
Still not much correlation, but as with exit velocity it would make sense for the true sign of power to be high rates of balls in the 300 feet range rather than the exact distribution of balls hit 100/200 feet.
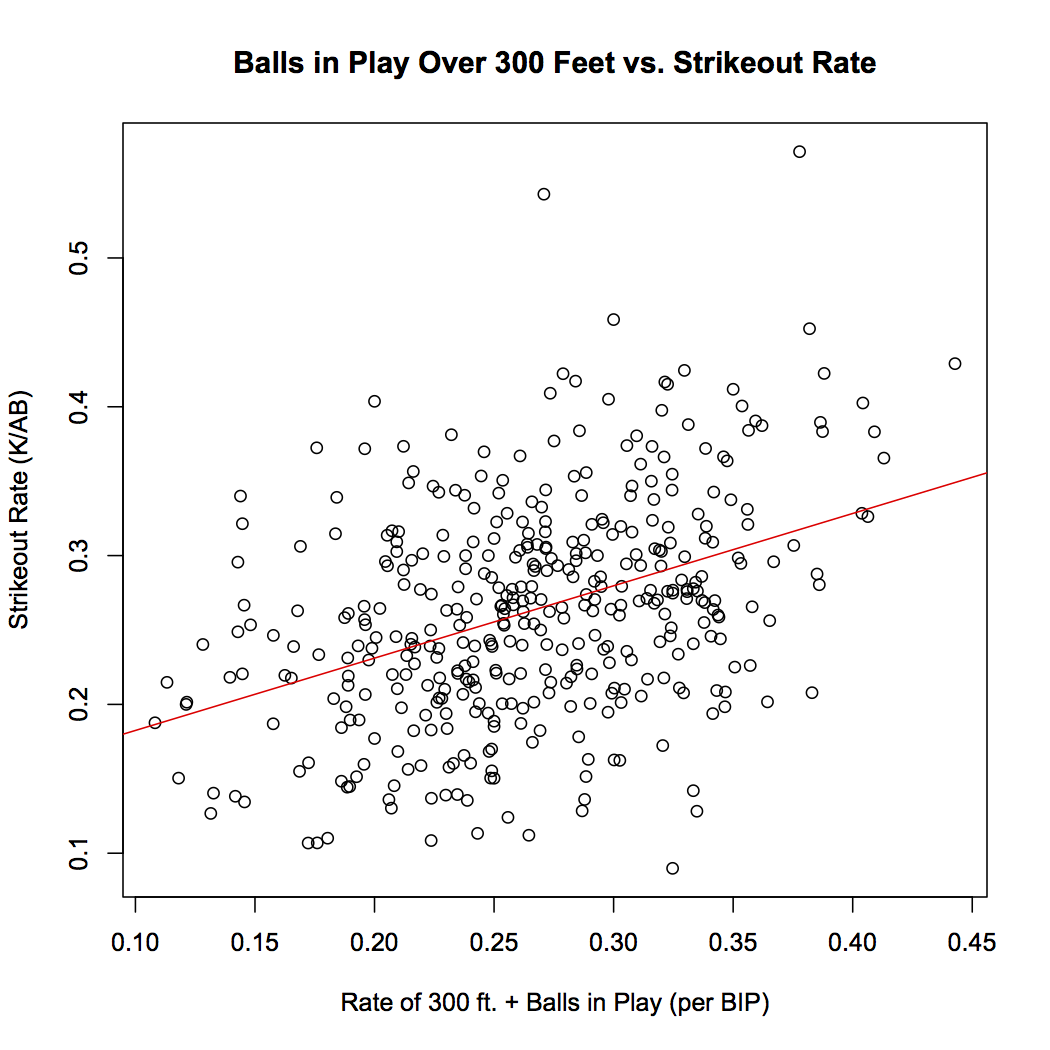
r = 0.398
So we see improved correlation, but 300 feet was a rather arbitrary number. Let’s try 350 feet.
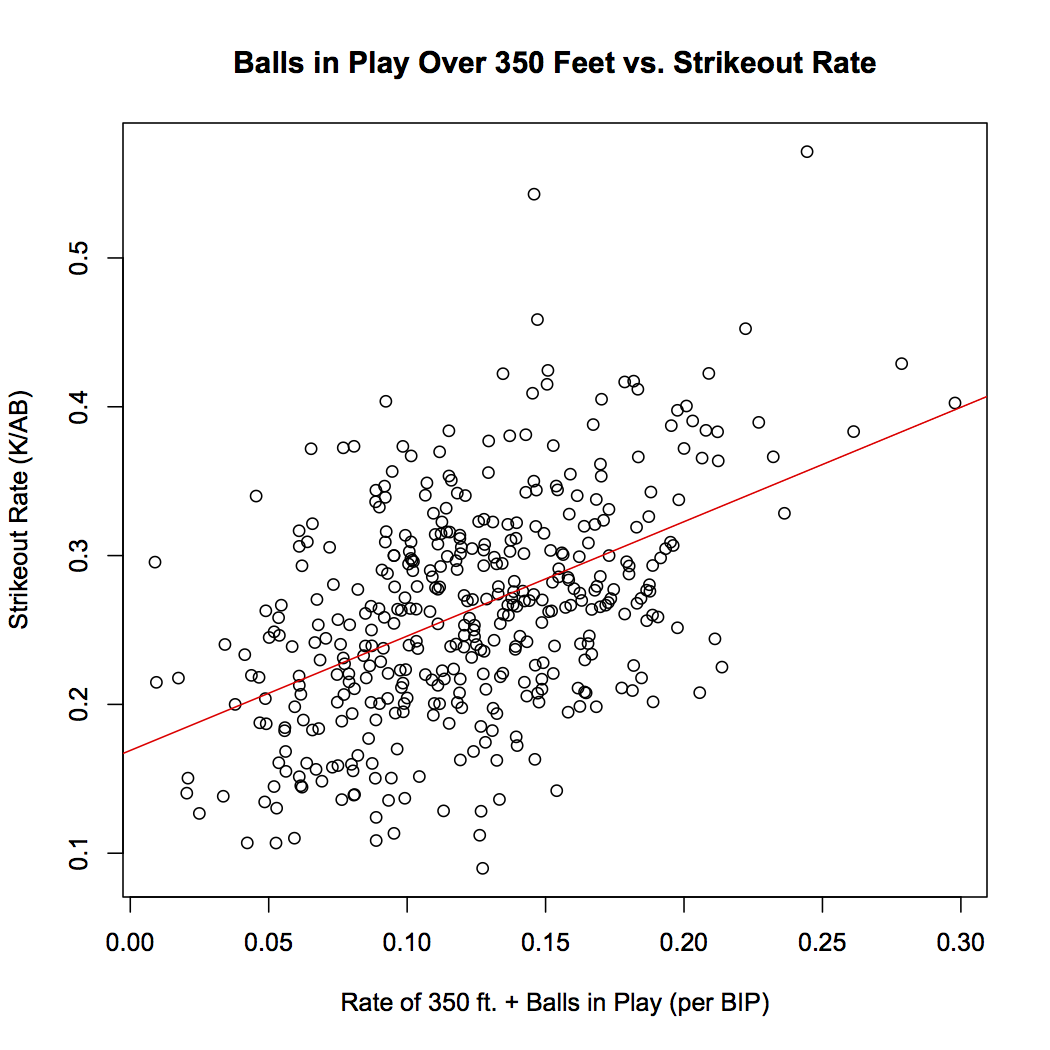
r = 0.481
There’s some decent correlation here, but maybe we’ve made a mistake in lumping together distances to all parts of the field. Here’s what happens when we redo the previous two graphs but only count balls hit to center field that went an extra 50 feet.
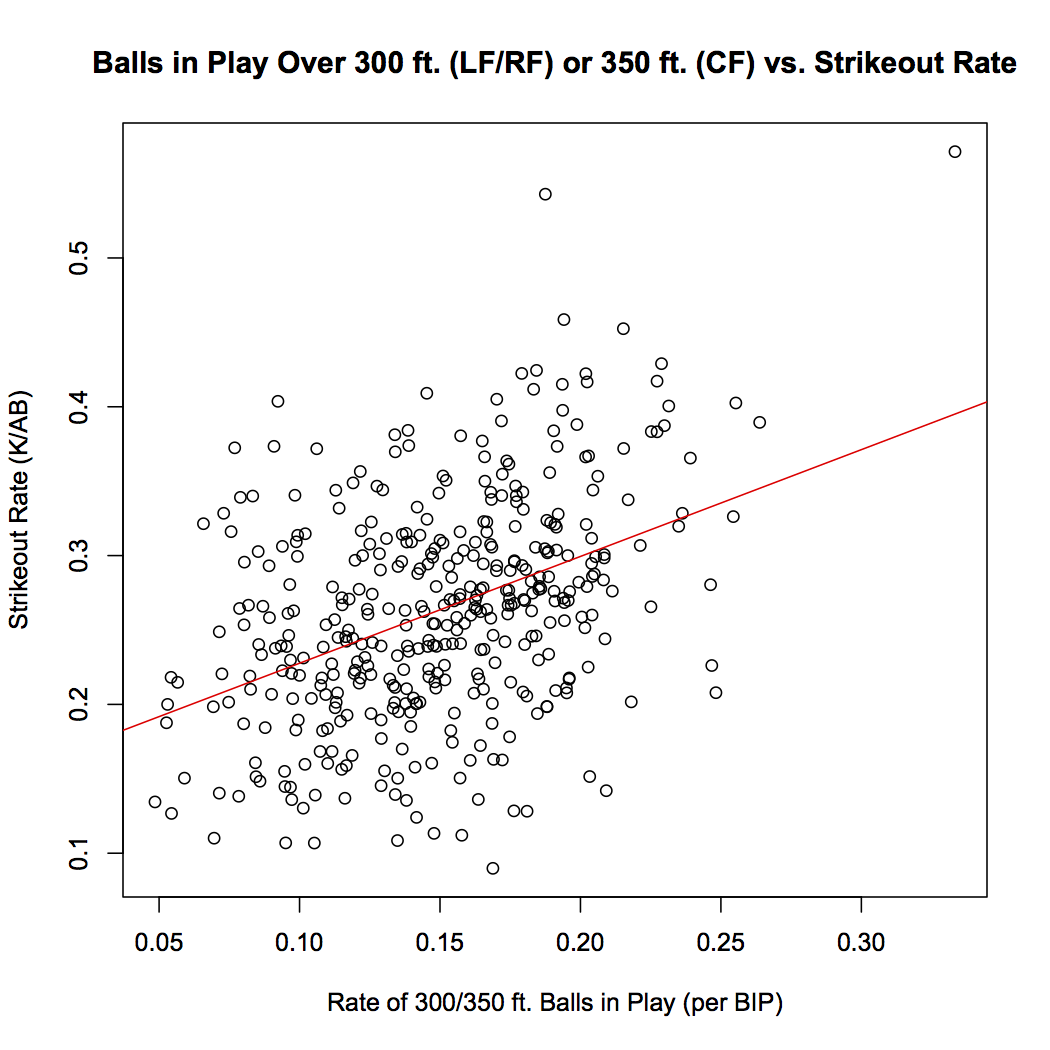
r = 0.416
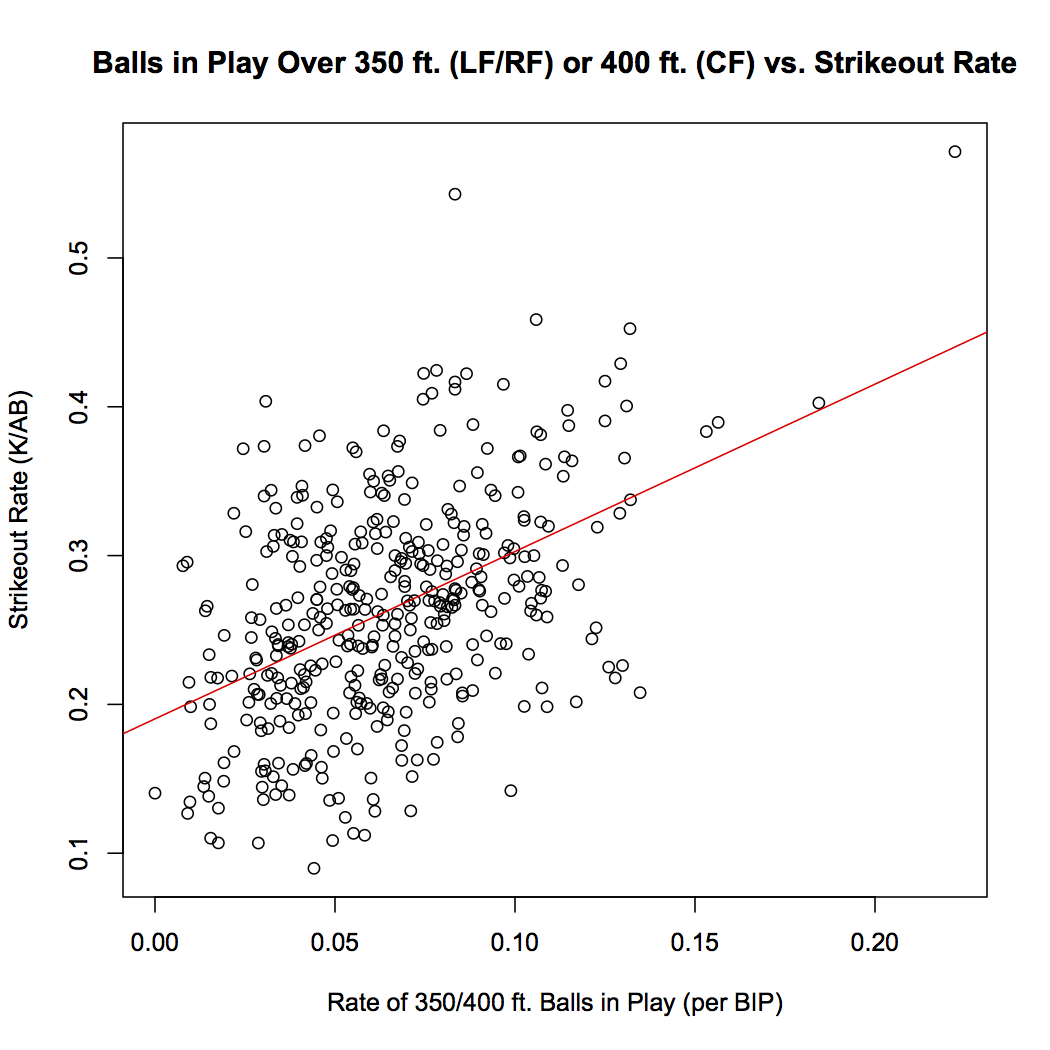
r = 0.463
The correlation went up from 300 to 300/350 and down from 350 to 350/400 (interestingly both by .018). This brings up an interesting question: Does power manifest itself more or less on balls in play in different parts of the field? In looking at this I organized players by their handedness — dividing balls in play by pull/center/opposite field not LF/CF/RF. (I omitted switch-hitters from this part and looked only at balls hit to the outfield.) Rather than show 21 graphs, I made a table below with the correlation coefficients.
| Location | Avg. Exit Velocity | Avg. Launch Angle | Avg. Distance | HR Range Exit Velocities | 300+ ft. | 350+ ft. | 400+ ft. |
| Pull | .306 | .433 | .399 | .327 | .386 | .442 | .293 |
| Center | .410 | .148 | .270 | .379 | .267 | .353 | .388 |
| Oppo | .336 | -.147 | 0.021 | .293 | .028 | .054 | .215 |
The last stat I’m going to look at is arc angle. Arc angle is a stat I created to evaluate a batted ball’s trajectory. You can find out more about it in my Hardball Times article. Just note that it’s only for balls hit in the air and lower angles are fly balls while higher angles are line drives.
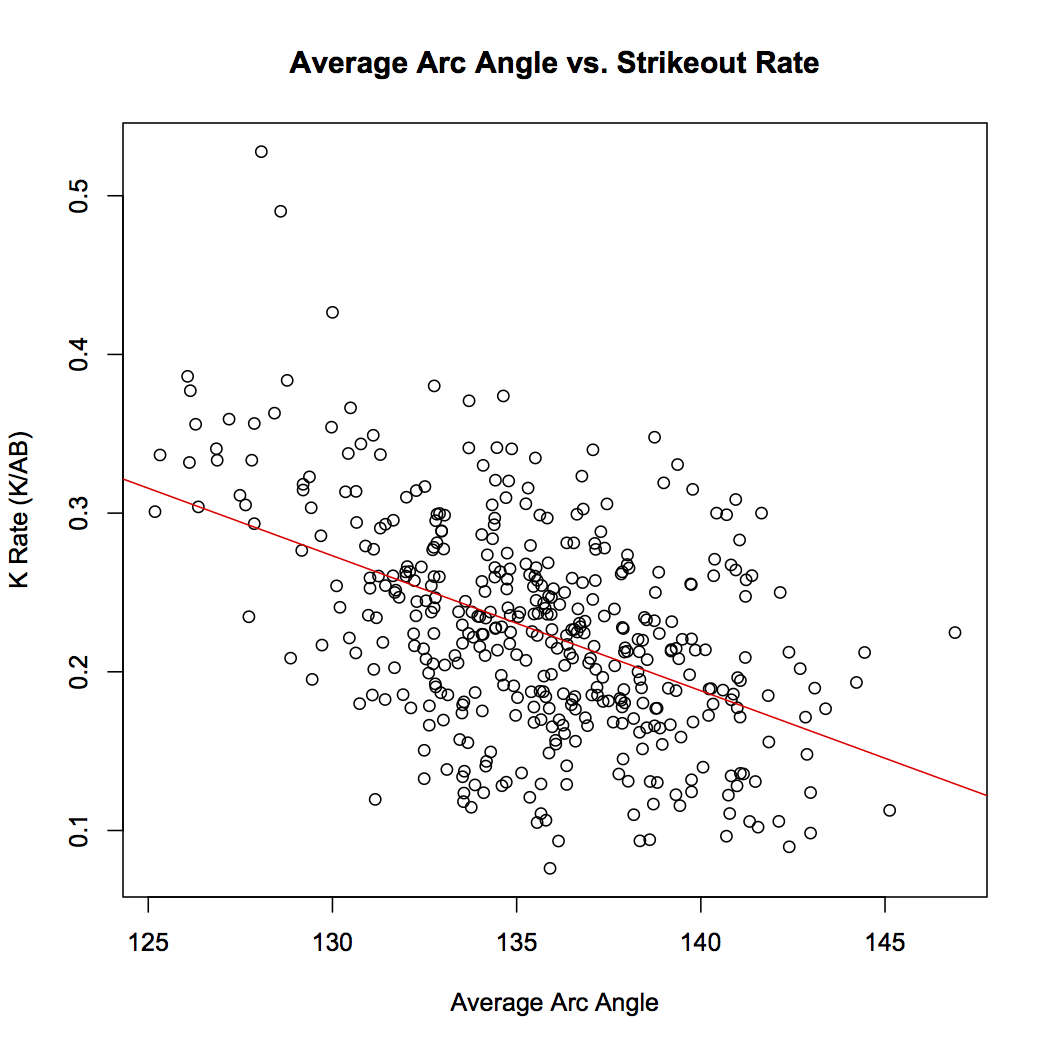
r = -0.474
So none of the Statcast stats yielded a correlation coefficient of 0.5 or more. As I said at the top this is likely — at least in part — a sample-size issue. I’ll update these numbers after the season to see what difference that makes.
Recap
That was a lot, so here’s a table of all the correlation coefficients and increase in strikeout rate per unit of the stat for the comparisons we made.
| Stat | Correlation Coefficient | Increase in K Rate per 1 Unit of Stat |
| Home Runs per AB | .527 | 2.16 |
| Extra Base Hits per AB | .427 | 1.40 |
| Home Runs per Hit | .609 | 0.63 |
| Extra Base Hits per Hit | .627 | 0.53 |
| Home Runs per Ball in Play | .634 | 1.85 |
| Extra Base Hits per Ball in Play | .669 | 1.44 |
| Isolated Power | .508 | 0.67 |
| Isolated Power per Hit | .642 | 0.21 |
| Isolated Power per Ball in Play | .673 | 0.61 |
| Average Exit Velocity | .338 | 0.01 |
| Home Run Exit Velocity Rate | .393 | 0.32 |
| Average Launch Angle | .260 | 0.01 |
| Average Ball in Play Distance | .353 | 0.002 |
| 300 + ft. Balls in Play Rate | .398 | 0.49 |
| 350 + ft. Balls in Play Rate | .481 | 0.77 |
| 300 + ft. LF/RF 350 + ft. CF Rate | .416 | 0.72 |
| 350 + ft. LF/RF 400 + ft. CF Rate | .463 | 1.12 |
| Average Arc Angle | -.474 | -0.01 |
| Location | Avg. Exit Velocity | Avg. Launch Angle | Avg. Distance | HR Range Exit Velocities | 300+ ft. | 350+ ft. | 400+ ft. |
| Pull | .306 | .433 | .399 | .327 | .386 | .442 | .293 |
| Center | .410 | .148 | .270 | .379 | .267 | .353 | .388 |
| Oppo | .336 | -.147 | 0.021 | .293 | .028 | .054 | .215 |
As to our initial question: Does power correlate with strikeouts? I think it’s pretty clear that yes, power correlates with strikeouts in some capacity. As for how much it correlates and what exactly power is? That’s not clear. Hopefully additional seasons of Statcast data will help.