The Most Predictable Hitters of 2013
I was watching the Twins game a few weeks ago when veteran Jamey Carroll effortlessly took an outside pitch to right field, as one might hope he would. The announcers were quick to praise his ability to “go with the pitch”. I’ve seen this play out time after time, often followed by praise for “going with the pitch” and “not trying to do too much”. That got me thinking, do some hitters go with the pitch better than others? Is this a desirable skill or does it leave the hitter vulnerable? Can a defense exploit this trait with a defensive shift much like we see shifts on straight pull hitters?
To dive into this I captured the angle of each hit ball since 2010 and displaced that against the angle that I expected the pitch to be hit. For example, an inside pitch on a right-handed batter could be expected to be hit near the left field line, while an outside pitch could be expected to be hit near the right field line. Everything in between would be evenly spread across the field, relative to the pitch’s location across the plate.
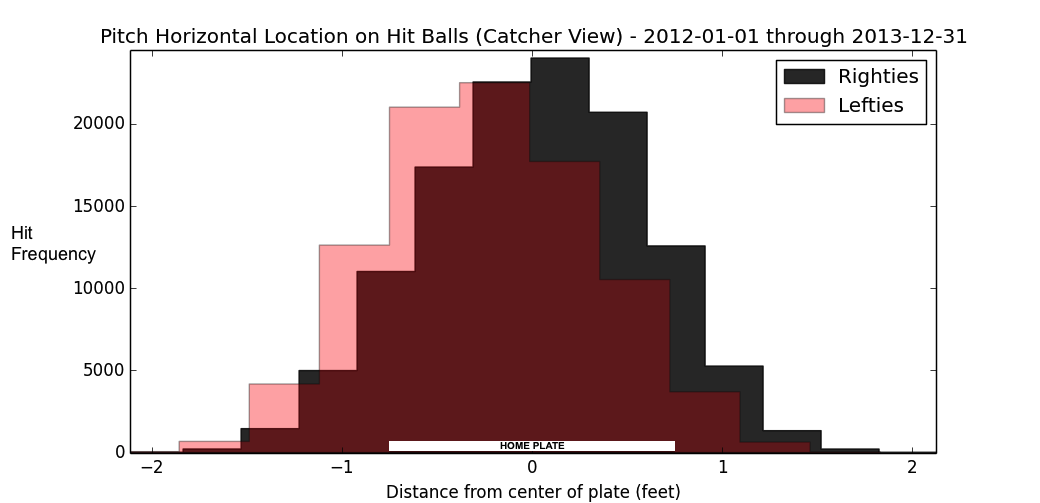
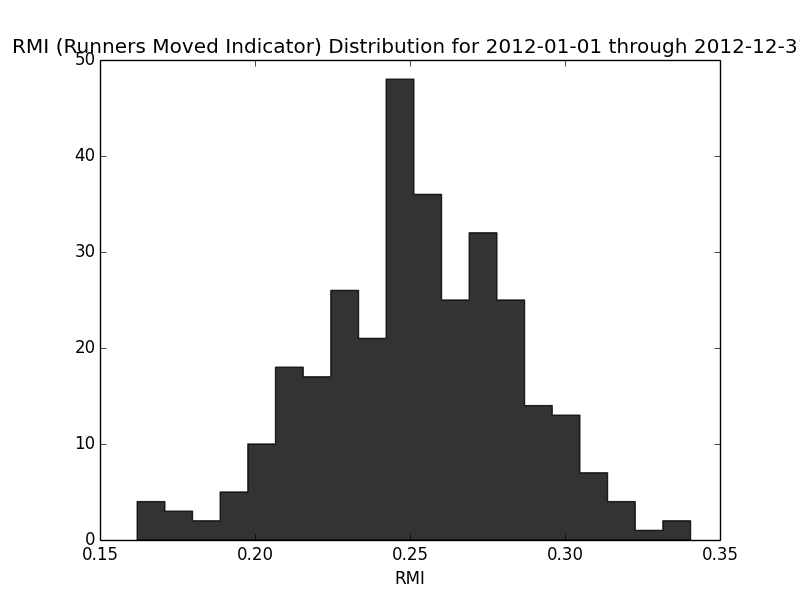
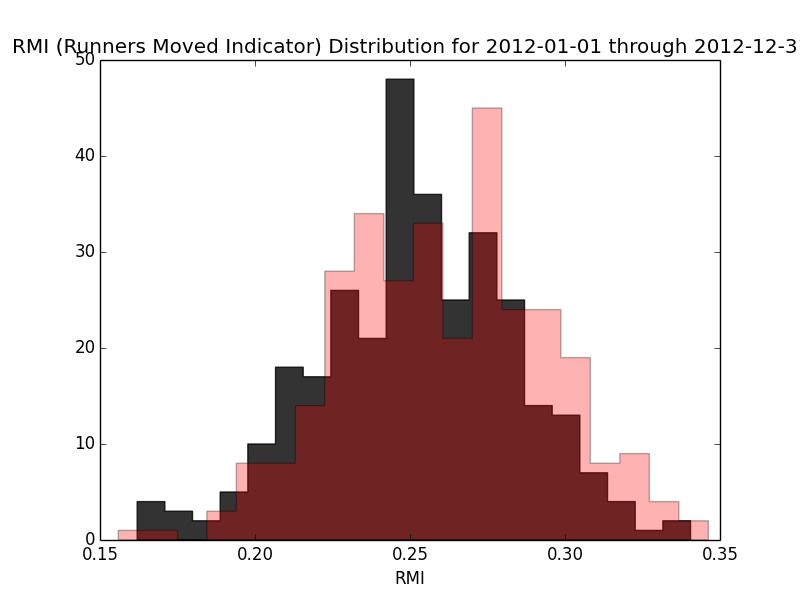
To make it a little more accurate for right-handed hitters vs left-handed hitters, I analyzed the actual pitch placement for pitches that become hit balls. As you can see below, all hitters prefer the ball just a touch on the outside part of the plate. I took two standard deviations of the hit pitches and considered that the spectrum that we’ll map to the field, with unique values for right or left handed hitters. We’ll call this our hit zone.
The players that made it to the top of the data below are the ones that tend to go with the pitch. That is, they take the outside pitch to the opposite field, they pull an inside pitch, and they take a pitch down the middle of the plate straight through center field. They are less random and more predictable.
With that, here are the most predictable hitters of 2013 through August 10th.
|
Batter |
Average Absolute Angle Difference |
Mean Angle Difference (Pull Tendency) |
Standard Deviation |
Hit Balls |
|
Melky Cabrera |
17.77 |
2.59 |
22.10 |
291 |
|
Pete Kozma |
18.43 |
2.08 |
22.13 |
253 |
|
Marco Scutaro |
18.43 |
0.25 |
23.05 |
361 |
|
Everth Cabrera |
18.43 |
-0.32 |
23.25 |
319 |
|
Chris Stewart |
18.76 |
6.81 |
21.97 |
182 |
|
Jamey Carroll |
19.06 |
-2.93 |
23.02 |
153 |
|
Martin Prado |
19.17 |
-5.35 |
23.90 |
392 |
|
Elvis Andrus |
19.19 |
-4.59 |
24.42 |
387 |
|
Lorenzo Cain |
19.21 |
0.09 |
24.23 |
266 |
For comparison sake, here are the 10 least predictable hitters.
|
Batter |
Average Absolute Angle Difference |
Mean Angle Difference (Pull Tendency) |
Standard Deviation |
Hit Balls |
|
Carlos Santana |
26.73 |
17.38 |
27.47 |
299 |
|
Howie Kendrick |
26.73 |
-10.40 |
31.03 |
347 |
|
Juan Francisco |
26.74 |
7.08 |
31.39 |
169 |
|
Yasiel Puig |
27.08 |
-1.71 |
32.62 |
167 |
|
Jimmy Rollins |
27.11 |
16.51 |
26.98 |
369 |
|
Ryan Flaherty |
27.12 |
14.14 |
28.81 |
143 |
|
Pedro Alvarez |
27.20 |
13.90 |
29.69 |
254 |
|
Ryan Howard |
27.42 |
7.23 |
32.52 |
197 |
|
Chris Young |
29.81 |
16.39 |
31.33 |
165 |
|
Chris Heisey |
31.02 |
19.52 |
30.40 |
119 |
Let’s explain this data before we go any further.
First off, the field is 90 degrees and thus, the values are all in degrees.
- Average Absolute Angle Difference: If a pitch was on the inside of the plate on a right-handed hitter, and was determined it would be “properly” hit somewhere near the left field line, but was actually hit 20 degrees to the right of that expected spot, this number shows that difference, averaged across all hit balls.
- Mean Angle Difference: Some balls are pulled against their expected spot, others are not. Pulled balls show up as a positive angle (for both L or R hitters), while negative angles indicate the batter was behind the pitch. The Average Absolute Angle Difference does care either way, while this metric does. A higher positive value here indicates a pull tendency while a negative value indicates that a batter is more often than not behind the pitch. Those batters with a higher value from 0 indicate they could be a little more predictable to pull or push.
- Standard Deviation: This should give you an indicator as to what kind of angle you could expect ⅔ of a batter’s hit balls to be where you expect them to be. For example, Chris Stewart has a standard deviation of 21.97 degrees. Given a very outside pitch that you’d expect to be hit down the right field line, you can expect that Stewart will usually hit that ball down the line or at most 20 degrees to the left or foul.
Looking at the data back to 2010 I found these players continually near the top. It seems for them, they have always hit this way, and can be expected to continue to hit this way.
- Marco Scutaro
- Ryan Hanigan
- Jamey Carroll
- Denard Span
- Elvis Andrus
Now, what can we do with this knowledge? Can a defense use the left-handed shift on a right-handed hitter? To look at this we’ll look at spray charts, but with a very important distinction from a standard spray chart – we’ll limit the hit balls to those hit on pitches on the outside of the hit zone.
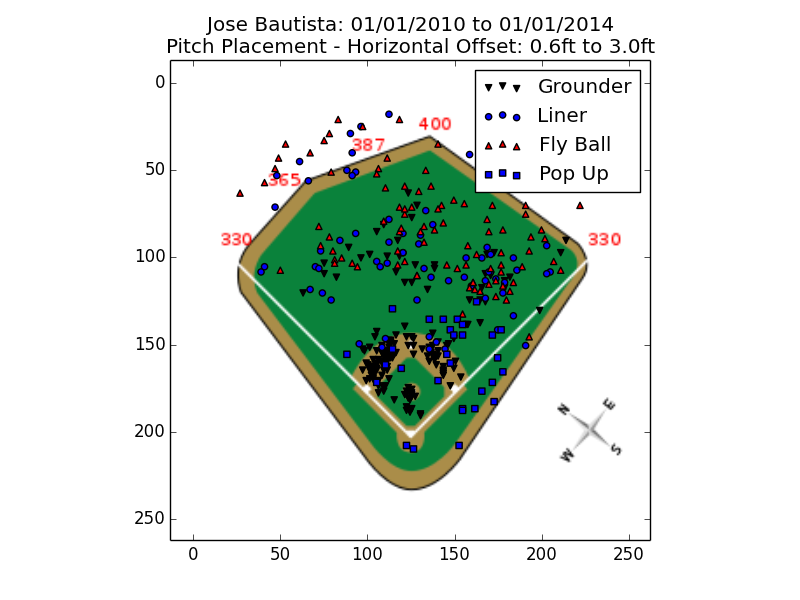
I’ll start you off with a spray chart for someone not on our list – Jose Bautista. This chart shows where he hits outside pitches. He looks like a good spray hitter when you look at only the outside pitches. As a defense, you wouldn’t shift on Bautista AND pitch him outside.
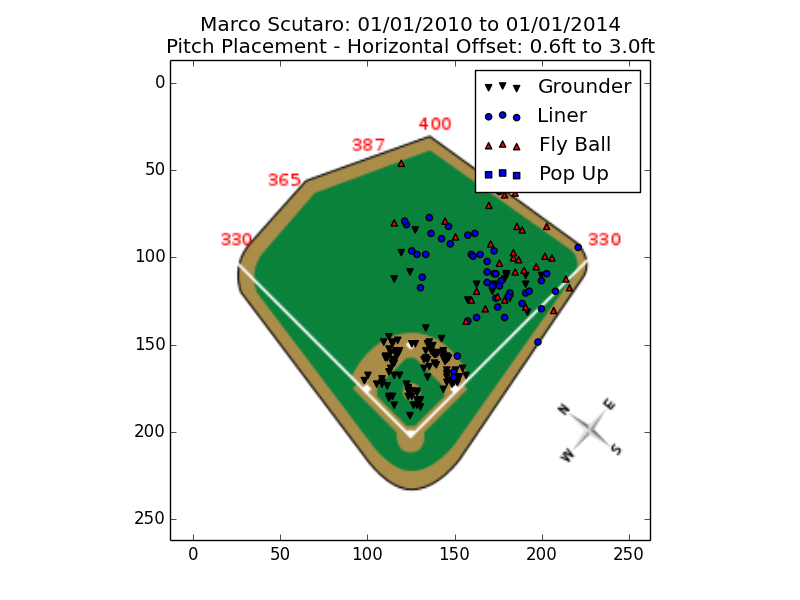
Let’s move on to someone who was continually at the top of our list, Marco Scutaro. You’ll see Scutaro reliably hits balls on the outer third of the hit zone to the right side. He still hits a fair number of ground balls across the infield, so an infield shift wouldn’t be advised. But liners and fly balls in the outfield are heavily weighted to the right. Using a control pitcher, pitching on the outside ⅓ of the hit zone, you could reliably shade the outfield to right field.
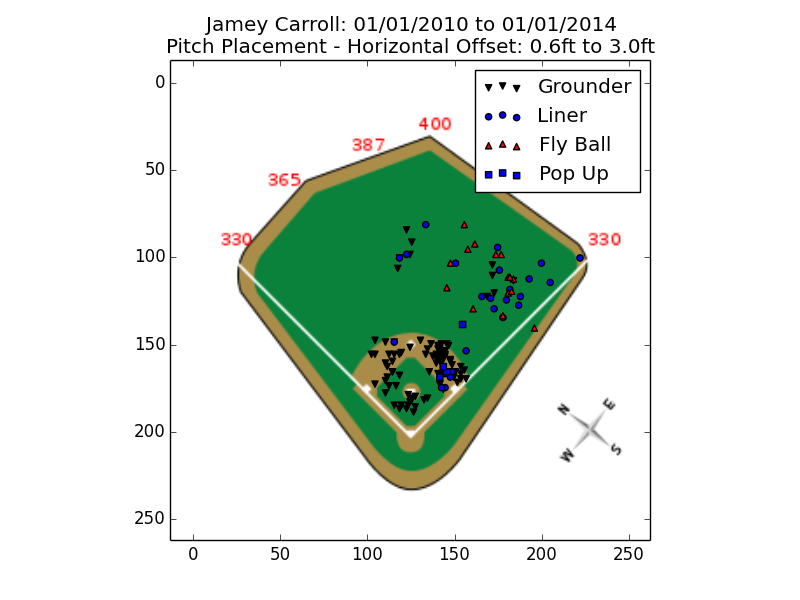
The same applies for Jamey Carroll, another player who, like Scutaro, shows up on our list year after year.
Takeaways
I’ve found that the tendency of pushing the ball on outside pitches to be much more predictable with our leaders than pulling the ball on an inside pitch. There’s surely more to be gleaned from this data, but the outfield shift on these predictable push hitters is definitely the most interesting.
Data Collection & Mining Techniques
The metrics for all hitters, year-by-year back to 2010 can be found here: https://docs.google.com/spreadsheet/ccc?key=0AtERgAQ83pATdDItUzAxXzhMZm41cGFPRjgxOEdZa0E&usp=sharing
All of the data used in this post was loaded from MLB’s gameday servers into a MongoDB database using my atbat-mongodb project. This project is open source code that anybody can use, modify, contribute to, etc. Fork me please!
https://github.com/kruser/atbat-mongodb
The following programs were used to mine and plot the data from the mlbatbat MongoDB database.
 *
* *
* *
*