Author Archive

The Folly of Pitching to Contact

‘Pitching to contact’ and ‘throwing ground balls’ are classic baseball buzzwords. Twins pitching coach Rick Anderson has essentially built a career around this philosophy. It seems like every time a young pitching phenom arrives and starts striking hitters out, people start talking about how he needs to pitch to contact. The strategy has been around since this guy played, and while Kirk Rueter pitched in his last game in 2005, Kevin Correia is still hanging around and Jeremy Guthrie signed a three-year deal last offseason. And, lest we forget, Aaron Sele got a Hall of Fame vote. To take a more in-depth look at the merits of pitching to contact I grouped all 394 starting pitchers from 2002 onward (the batted ball era) who had thrown 200 or more innings, and organized them by Contact% into eight groups. The following spreadsheet details the results of my study. Groups 1-4 are classified as contact pitchers, while groups 5-8 are strikeout pitchers.

Group Contact range xFIP- ERA- WAR/200 IP RA9-WAR/200 IP GB% K% BB% HR% BABIP FB velo FB% Pitches/IP
MLB 80.0—82.2 101 103 2.4 2.3 43.0 16.8 7.9 2.8 0.295 90.3 59.3 16.2
Group 1 85.2—89.9 109 112 1.7 1.5 44.7 11.8 6.8 2.9 0.299 89.2 64.3 15.8
Group 2 84.0—85.2 106 110 2.1 2.0 43.7 13.8 7.2 2.8 0.300 89.6 61.7 16.0
Group 3 83.1—84.0 106 112 2.0 1.7 44.0 14.6 7.3 2.8 0.295 89.3 59.0 15.9
Group 4 82.1—83.1 105 110 2.4 2.0 42.4 15.6 7.6 2.8 0.299 89.4 60.1 16.2
Group 5 81.0—82.0 105 106 2.3 2.3 42.4 16.8 8.3 2.7 0.290 90.0 60.3 16.4
Group 6 79.7—80.9 100 101 3.0 3.0 43.2 18.4 7.5 2.7 0.292 90.5 59.0 16.0
Group 7 78.0—79.6 98 98 3.0 3.1 43.1 19.5 8.2 2.6 0.290 91.1 58.8 16.2
Group 8 71.3—77.8 89 90 3.8 3.7 42.1 22.7 8.2 2.5 0.290 91.9 58.5 16.2

Of the Group 1 pitchers, only 5 had an xFIP- better than the league average, and only 6 had an ERA- better than league average.  Two of these were posted by aging control artists Rick Reed and David Wells, who had success on the strength of their walk rates of 4.0% and 3.7%, respectively. Chien-Ming Wang rode his 59.5 GB% to a 98 xFIP- and 99 ERA-. Overall, Nate Cornejo was more typical of the group than these three. xFIP- went down with decreasing contact, and except for a small blip between groups 2 and 3 (both contact groups), so did ERA-.

There is a strong connection here between fastball velocity and contact rates, but there is also a strong connection between fastball usage and contact rates. Group 1 had both the slowest average fastballs and the highest use of fastballs. As anyone watching Gerrit Cole and the Pirates can tell, contact rate has almost as much to do with fastball usage as fastball velocity.

Though the contact pitchers had lower walk rates than the strikeout groups, their strikeout rates were far below average. The separation between strikeout and walk rates was better for the strikeout pitchers, with an average separation of 11.3, compared to 6.7 for the contact pitchers. In terms of K/BB, the strikeout pitchers posted a 2.4 K/BB, and the contact pitchers were at 1.9 K/BB. The old adage that groundball pitchers prevent home runs did not bear out. While the contact pitchers had a groundball rate of 43.7% compared to 42.7% for the strikeout pitchers, the contact pitchers had a HR% of 2.8, and the strikeout pitchers had a HR% of 2.6. Home runs are connected to contact.

The contact pitchers also slightly underachieved their peripherals. The ERA- for the contact groups was an average of 4.5 points higher than their xFIP-, while the ERA- for the strikeout groups was on average less than 1 point higher. The contact pitchers had an average BABIP of .298 compared to the .291 for the strikeout pitchers. High strikeout pitchers can often sustain slightly lower BABIP than their counterparts.

The connection between contact and efficiency is slight. The difference in Pitches/IP was the biggest between group 1 and group 5. The difference of 0.6 Pitches/IP translates to only 120 pitches per 200 IP. While the pitch count and innings limit debate has overtaken the nature of starting pitching, pitching to contact does not seem to be the answer. Teams and pitching coaches that are advocating pitching to contact as a means to pitch longer in games are essentially sacrificing a lot of quality for a tiny amount of quantity. And with 12 or 13 man pitching staffs being the rule of the day, this strategy seems absurd.

Despite mounting evidence that pitching to contact is a futile strategy, teams keep encouraging their young pitchers to stash away their strikeout stuff in the name of efficiency. Young pitchers Nathan Eovaldi and Gerrit Cole currently own the 3rd and 4th fastest fastballs among starting pitchers. Both of them, and Cole in particular, posted very high strikeout rates in the minor leagues. Yet both of them own strikeout rates well below the NL average, and Cole and Eovaldi’s respective xFIP- rates of 99 and 101 are decidedly average.  I know, almost anybody with a good fastball can rack up a lot of strikeouts in the minors, and Eovaldi in particular has a limited repertoire that may keep him from reaching his potential. But shouldn’t young pitchers focus on developing strikeout pitches rather than trying to get ground balls? After all, fastball velocity peaks early and Cole and Eovaldi will probably have a tougher time getting outs on contact when they aren’t throwing 96. While Mike Pelfrey has carved out a decent career for himself, I’m sure most teams hope for more out of their top pitching prospects.


In Defense of Striking Out: Ideal Strikeout Rates for Hitters

Strikeout rates have climbed since 2006, while league wOBA has dropped.  Responses to ballooning strikeout rates have been mixed. One response is to trade one of your best hitters, while another is to lead the MLB in home runs. Some clubs are more averse to strikeouts than others.

It’s no secret that Diamondbacks GM Kevin Towers hates strikeouts. Since taking over in 2010, Towers has discarded every Diamondbacks player who struck out 100 times or more from the 2010 club that set the major-league record for strikeouts in a season by striking out 24.7% of the time. His 2013 squad’s 18.5% strikeout rate is 10th-lowest in the majors. However, the decreased strikeout rate has not resulted in increased offense. The 2010 D-Backs scored 4.40 runs per game, posting a .325 wOBA and 93 wRC+, a shade better than that of the more contact-driven 2013 Diamondbacks who currently average 4.17 runs per game with a .313 wOBA and 92 wRC+. While the 2010 team had the 4th-best walk rate at 9.5%, the 2013 Diamondbacks are just 13th at 8.1%. Though the 2010 Diamondbacks struck out more, they also walked more, and made more quality contact, as shown by a .312 BABIP% and .166 ISO which were 2nd and 4th in the majors, respectively. The 2013 team has a .301 BABIP% and .135 ISO, good for 10th and 23rd in the majors. A look at the plate discipline numbers shows that the 2013 Diamondbacks swing at more pitches out of the strike zone and make more contact on those swings than the 2010 team.

2010 O-Swing% Z-Swing% Swing% O-Contact% Z-Contact% Contact% Zone% F-Strike% SwStr%
Diamondbacks 27.6% 64.7% 44.6% 57.9% 84.2% 75.4% 45.8% 58.5% 10.6%
2013 O-Swing% Z-Swing% Swing% O-Contact% Z-Contact% Contact% Zone% F-Strike% SwStr%
Diamondbacks 31.4% 64.8% 46.4% 68.6% 87.8% 80.6% 44.9% 59.9% 8.7%

If a hitter can cut his strikeout rate while maintaining his walk rate and power production, that is special. However, there is usually a tradeoff between power/walks and contact. After all, not everyone can be vintage Albert Pujols. To dig deeper into the balance between power and contact, I separated MLB hitters by strikeout percentage into five groups, with 30 hitters per group. I limited the study to qualified hitters, to eliminate the presence of pitchers and small sample size hitters. Not surprisingly, the first group was the clear leader in home run rate.

MLB K% BB% HR% wOBA BABIP% WAR Total PA
  19.7 7.9 2.6 0.313 0.296  
Group 1 K% BB% HR% wOBA BABIP% WAR Total PA
  27.2 8.7 4.4 0.336 0.305 61.7 13008
Group 2 K% BB% HR% wOBA BABIP% WAR Total PA
  20.7 8.6 2.5 0.337 0.323 65.9 12962
Group 3 K% BB% HR% wOBA BABIP% WAR Total PA
  17.1 8.1 3.0 0.342 0.313 68.9 13510
Group 4 K% BB% HR% wOBA BABIP% WAR Total PA
  14.3 8.5 2.4 0.342 0.313 71.5 13895
Group 5 K% BB% HR% wOBA BABIP% WAR Total PA
  10.4 7.0 2.1 0.317 0.284 51.9 13187

I included WAR even though it includes defensive and baserunning values because I thought that the contact-heavy hitters in group 5 might make up for their offensive deficiencies by being better defenders or baserunners. However, the total WAR for each group tracked offensive production for the most part. The first four groups are very close together with regards to wOBA. As I expected, the most strikeout-heavy group owned the highest walk and home run rates. Group 2 made up for its lower home run rate with a higher BABIP%. The rates of doubles were very close in all groups, ranging from 4.5% in group 5 to 5.2% in group 3. Group 5 had the lowest homerun and walk rates. Despite group 5’s ability to put the ball in play, the contact generated was of a lesser quality due to higher contact rates on pitches out of the zone. With the exception of Edwin Encarnacion, Adrian Beltre, and Buster Posey, none of the hitters in group 5 had more than 20 weighted runs above average (wRAA). The group average was 0.9 wRAA. Though group 5 had the lowest WAR of any group by a wide margin, they had the 3rd most plate appearances.

As the above table shows, there is not a significant negative connection between higher strikeout rates and offensive production. In fact, the most contact-heavy hitters are far less productive offensively than their more strikeout-prone counterparts. Of course, the plate approach of Chris Davis would not work for Marco Scutaro and vice versa. The idea of an ideal groundball rate for individual hitters has been posited. I would suggest that there is also an ideal strikeout rate for individual hitters. The following is a list of five hitters who I believe would benefit from a more or less contact-friendly approach.

Matt Holliday has trimmed his strikeout rate from 19.2% in 2012 to 14.4% this year. However, he has also trimmed his wRC+ from 141 to 137. His BABIP% is down from .337 to .312, but this is likely due to a less formidable batted ball profile, as his xBABIP% has dropped from .328 to .304. His Line Drive/Infield Fly ratio is down from 89/11 to 58/16. Furthermore, his home runs on contact has dropped from 5.7% to 4.8% and his overall homerun rate has dropped from 4.9% to 3.5%. His flyball distance has decreased from 305.15 to 294.66. A look at the PITCHf/x data shows that Holliday is swinging more and making more contact on those swings. His Swing% has jumped from 47.2 to 49.9 and his Contact% has gone from 78.5 to 81.8. His O-contact% has gone from 65.0 to 66.1 and his Z-contact from 86.1 to 89.0. While Holliday is striking out less while walking at the same rate, his swings have been noticeably less aggressive, and his overall offensive production is down.

Mike Moustakas has reduced his strikeouts even more than Matt Holliday, going from 20.2% in 2012 to 13.6% in 2012 while essentially maintaining his walk rate. However, his offensive production is down significantly, from 90 wRC+ to 79 wRC+. His home run rate has dropped from 3.3% to 2.6%, and his home runs on contact is a paltry 3.3% compared to 4.5% in 2012. His fly ball distance has dropped to 279.2 to 274.6. Moustakas’ increased contact rate has come largely from swings on balls outside of the zone, as he has seen as increase in O-Contact% from 63.7 to 74.3. During GM Dayton Moore’s tenure, the Royals have had an emphasis on putting the ball into play. Their 16.4 K% since 2007 is the lowest in the league over that time frame. However, they have only a 92 wRC+ over that span, good for 21st in the league and their BB% of 7.0 is dead last. While the Royals’ emphasis on contact appears to have helped Eric Hosmer, its application to Moustakas has had a negative impact on his production.

Adrian Gonzalez has undergone a significant change since being traded from the Padres. While playing in the spacious Petco Park Gonzalez posted home run rates between 3.8-5.9% and walk rates of 8.2-17.5%. His wRC+ numbers ranged from 123 to 156. His home run rate dipped to 3.8% in his first year at Fenway, his lowest since his first full season, but a still solid walk rate of 10.3% and a .380 BABIP% led him to an excellent 154 wRC+. Since then, his ability to draw walks and hit for power have plummeted. From 2012 to the present, Gonzalez has a 2.9 HR% and a 6.7 BB%. While Gonzalez has posted his three best contact rates since 2011, his O-Contact% has been between 70.1 and 75.9, well above his career rate of 67.1. Though Gonzalez has slightly improved his power production from 2012, his 126 wRC+ remains a far cry from his peak years. In Gonzalez’ best years, he had strikeout rates in the 17-20% range. He can still be a productive player, but the make-contact approach has taken away much of his power and walks.

Asdrubal Cabrera is posting career high strikeout and fly-ball rates in 2013. Unfortunately for him, this approach has not led to an increased power output, as his home runs on contact, average fly ball distance, and ISO are virtually unchanged from 2012. The 22.0% strikeout rate has conspired to cut his wRC+ from 113 to 91. In an effort to hit for more power, Cabrera’s contact rate has gone from 84.0% to 78.6%, a career-low figure, and his walk rate has dropped from 8.4% to 5.8%, also a career low. Though Cabrera’s BABIP%  has dropped from .303 to .286, his xBABIP% is up from .319 to .334, suggesting that he can be productive when he puts the ball in play. Not yet 28, it is time for the Indians shortstop to go back to the plate approach that made him a productive hitter in 2009-12, controlling the strike zone with a more level swing. In picture form, here is a swing from 2011 when Cabrera had a K% of 17.8 and a 119 wRC+.

 Yoenis Cespedes has improved his home runs on contact from 5.9% in 2012 to 6.4% in 2013. However, because of the jump in his strikeout rate from 18.9% to 23.9% his overall home-run rate remains at 4.3% and his ISO is basically the same. His wRC+ is only 96, compared to 136 in his debut season. Cespedes is hitting more fly balls at 47.7% compared to 39.9%, and their average distance is the same, but those fly balls have come at the expense of line drives and ground balls, which has caused his xBABIP% to sink from .305 to .279 and his actual BABIP% to go from .326 to .255. Because Cespedes is relatively new to the league, I wanted to see if pitchers are attacking him differently. However, Cespedes has been pitched to in largely the same fashion as 2012, but with slightly more fastballs and less changeups. Cespedes has been less able to hit those fastballs, as he is only 0.37 runs above average per 100 fastballs, compared to 1.71 last year. Cespedes has been seeing slightly more pitches out of the zone, as his Zone% has decreased from 46.2% to 45.1%, but his O-Zone Swing% is mostly the same. For the most part, Cespedes has been getting beat in the strike zone, as his Z-Contact% down from 84.2% to 81.0%. Because Cespedes’ raw power and athleticism are so impressive, there is a temptation to be overaggressive at the plate. He will likely always be an aggressive hitter, but if he can cut his strikeout rate to his 2012 level, it will be worth the decrease in home runs on contact.

Unlike many people, I do not think that strikeouts are inherently bad. For some hitters, the increased strikeouts are the cost of home runs and walks. Other hitters would be well served to put more balls in play while suffering a loss of power. However, start implementing a one-size fits all approach of strikeout avoidance and you’ll end up like the Royals.


What if Jeff Locke and Rick Porcello were Traded for Each Other?

Jeff Locke and Rick Porcello are two pitchers with large gaps between their xFIP and ERA. How you value them depends largely on your faith in defense-independent pitching theory. Porcello sports a 3.27 xFIP but a 4.28 ERA. While his ERA- is a pedestrian 105, his xFIP- is an excellent 82. Porcello ranks 42nd among qualified pitchers in FIP WAR at 2.1 while his RA9 WAR ranks 57th at 1.5. Locke on the other hand has posted an unsightly 4.09 xFIP but a sparkling 2.47 ERA. His ERA- is a sterling 68 while his FIP- is 101. Based on FIP WAR, Locke ranks 58th at 1.4 while RA9 WAR puts him at 13th with 3.9. RA9 or “actual run prevention” says Locke is a real ace, the 5th best pitcher in his league, and Porcello is a slightly below average pitcher. xFIP says Porcello is an excellent pitcher, while Locke is merely a middling arm.

In order to understand the difference between Porcello and Locke, I dug deeper into their peripheral stats. Both have similar strikeout rates, with Locke at 18.1% and Porcello, who does not have the luxury of facing his own kind, at 17.8%. While Porcello has a 5.1% walk rate, Locke’s 11.3% is well above the MLB average of 8.0%. Porcello has been victimized by the long ball, as his 13.5% HR/FB rate is the highest since his rookie year, and two full points above his career average of 11.5%. On the other hand, Locke has managed to suppress home runs, as he has posted a 6.8% HR/FB rate. Some of this can be attributed to their respective home fields, as Comerica has a home run factor of 101, while PNC Park’s home run factor of 92 makes it the 3rd most difficult park to hit a home run. I would be wary of attributing any home run avoidance skills to Locke, as he allowed 9 home runs in 51 innings with the Pirates over 2011-12. ZiPs has him projected for a 9.9% HR/FB rate over the remainder of the season. Locke has also enjoyed an excellent LOB%, as his 82.2% is currently 5th in the majors among qualified starters while Porcello’s 69.5% is 74th. MLB average LOB% is 73.3. While Locke’s LOB% seems destined for regression (ZiPS projects it to be 69.0% ROS), a below-average LOB% may be part of Porcello’s profile, as his 69.5% is actually a career-best number.

However, the biggest reason for the ERA separation between Porcello and Locke is the defense behind them. Both Porcello and Locke are groundball pitchers, and their higher than average contact rates make them heavily dependent on their fielders. Porcello’s GB% of 57.2 is 2nd highest in the MLB, while Locke’s 53.3% is 8th highest. The Tigers have a team BABIP% against of .300 which ranks 6th highest in the MLB, while the Pirates are 2nd lowest at .271. Porcello’s BABIP of .313 is 13th highest among qualified starting pitchers, while Locke’s .261 is 75th. The following hand-picked GIFs illustrate the difference.

Porcello works with this:

  (muckracker)

(He doesn’t actually but I imagine the Tigers’ ballboy was inspired by their defense)

And Locke has this:

Jordy Mercer defense (From Forbes to Federal)

The difference in their defenses has contributed to the Tigers’ pitchers underachieving their xFIP, and the Pirates beating their xFIP. While the Tigers pitching staff has a league-best 3.38 xFIP, their team ERA is 6th-best at 3.57.  The Pirates have the 5th-best xFIP at 3.67, but a team ERA of 3.09 that leads the league by a wide margin, with the Braves next at 3.24. Put in other terms, the Tigers ERA is 106% of their team xFIP, while the Pirates ERA is 84% of their team ERA. Rick Porcello’s ERA is 131% of his xFIP, while Jeff Locke’s ERA is 60% of his xFIP.

After an analysis of the Locke and Porcello’s defense-independent stats and their defense-dependent stats, I thought it would be interesting to see what combining the best and worst of both worlds would be. The following chart is Porcello’s actual ERA and then his ERA calculated by multiplying his xFIP by the “Pirates Factor.”

ERA xFIP Pirates Factor “What if” ERA
4.28 3.27 0.84 2.75

And this chart shows Locke’s actual ERA and then his ERA calculated by multiplying his xFIP by the “Tigers Factor.”

ERA xFIP Tigers Factor “What if” ERA
2.47 4.09 1.06 4.34

I know, it’s a back-of-the-napkin calculation. xFIP doesn’t adjust for park and league factors, and Porcello’s LOB% probably wouldn’t jump to the Pirates’ team average of 77.1%.  Nevertheless,  its an interesting example of the difference that defense, park, league, and luck factors can have on a pitcher’s ERA over the course of a season. If Porcello pitched for the Pirates, he would probably be widely recognized as a very good pitcher, while if Locke pitched for the Tigers, he would most likely look average or worse. A change of scenery could have a big impact on either pitcher. But hey, who knows, maybe the recent acquisition of this guy can help Porcello look a little better.

Iglesias09.03.12


Where have Jarrod Saltalamacchia’s Fly Balls Gone?

Besides having a great last name, Jarrod Saltalamacchia has been a productive hitter for the Red Sox. Since 2011, he has increased his wRC+ each year, posting a 94,96, and 110 wRC+ the last three years, respectively. Despite Saltalamacchia’s career-high .340 wOBA, his ISO stands at .186, a drop from the .215 and .232 numbers he posted in 2011 and 2012. After leading the Red Sox in homeruns with 25 a year ago, Salty has only 10 homeruns this year. His PA/HR  has fallen from 17.9 in 2012 to 34.0 in 2013.

Last year, 20% of Saltalamacchia’s fly balls left the park, a career-high average. This year, only 12.3% of Saltalamacchia’s fly balls have reached the seats, his lowest number since joining the Sox, and below his career 13.5%. However, a look at baseballheatmaps shows that Salty is 15th in average fly ball distance at 303.8 feet, only a little behind teammate David Ortiz who at 305.5 enjoys an 18.1% HR/FB ratio. Salty’s fly ball distance is ahead of notable AL home run leaders such as Edwin Encarnacion, Jose Bautista, Mark Trumbo, Adrian Beltre, Adam Jones, and Raul Ibanez. While Fenway is tied with Chase Field for the 3rd-most hitter-friendly park with a park factor of 105, Fenway slightly suppresses home runs. Fenway’s 97 home run factor is tied for 17th. Digging further, we find that Fenway’s home run factor for left-handed hitters is 92, the 6th lowest in baseball. The switch-hitting Saltalamacchia has generated more power from the left side of the plate, as only 7 of his 51 homeruns in a Red Sox uniform have come from the right side of the plate despite experiencing 23% of his plate appearances from that side. However Fenway’s quirky dimensions do not appear to be swallowing up Salty’s flyballs, as his HR/FB ratio is 17.4% at home, compared to a paltry 5.7% on the road. Chalk this up to randomness, and expect Salty’s HR/FB ratio to move closer to 15%.

A further explanation for Saltalamacchia’s decreased power lies in a changed plate approach. While Saltalamacchia’s home run to fly ball ratio is low, his BABIP is very high, at .376, a huge increase from last year’s .265. Much of the increase can be attributed to a line drive rate of 28.6%, a jump from the 22.8% he posted in 2012. The line drives have come partly at the expense of fly balls, as Salty’s fly-ball rate has fallen from 46.6% in 2012 to 40.7% in 2013. All this has combined to produce an xBABIP of .344.  The graphs below illustrate Saltalamacchia’s uptick in line drives and decrease in fly balls and the corresponding change in BABIP%.

Jarrod Saltalamacchia GB/FB/LD : Season Stats Graph


Jarrod Saltalamacchia BABIP : Season Stats Graph


Looking at these charts, it appears that Saltalamacchia has gone to a more BABIP-friendly approach by trading fly balls for line drives. While this has resulted in a decrease in his ISO from .232 to .186, his overall offensive production has increased. His wRC+ climbed from 96 in 2012 to 110 in 2013.  For catchers with at least 250 PA, Salty’s wRC+ rose from 21st in 2012 to 8th in 2013. Though Saltalamacchia’s line-drive approach has reaped dividends, expecting a .376 BABIP the rest of the way is being unrealistic. Most likely, the BABIP will regress some, but the HR/FB ratio should improve. Saltalamacchia will likely maintain a similar level of production the rest of the way, but it will likely come in the form of a decreased batting average and increased ISO.


Pawtucket Red Sox Prospect Review

This Saturday and Sunday I caught the Pawtucket Red Sox on the road against the Buffalo Bisons. The matchup of the Red Sox and Blue Jays AAA affiliates featured several of the top prospects in the Red Sox organization with the following members of Marc Hulet’s preseason Top 15 Red Sox prospects on the Pawtucket roster: #1 Xander Bogaerts, #3 Jackie Bradley Jr., #4 Allen Webster, #10 Brandon Workman, #12 Bryce Brentz and #14 Anthony Ranaudo. Additionally, 2012 #2 Will Middlebrooks manned the hot corner for Pawtucket. Bogaerts at #2, JBJ at #38, and Ranaudo at #49 also appeared on Hulet’s 2013 midseason top 50 list.

I offer the following (perhaps voluminous) review for your reading pleasure. Furthermore, I included the following images and GIFs for your viewing pleasure.

  (Image from Milb.com)

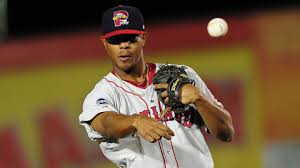
Xander Bogaerts: The Red Sox wisely held onto Bogaerts this trade deadline, the crown jewel of their farm system, and the consensus top shortstop prospect in baseball. The 20 year-old has thrived following a promotion to AAA, with a .282/.378.477 line in 47 games along with a .387 wOBA and 139 wRC+, despite a BABIP% of .311, 31 points lower than his minor league career average. Impressively, the youngster has posted a 12.4 BB%, and has actually cut his strikeout rate from 21.6% to 16.9% after being promoted from AA to AAA. Bogaerts has excellent bat speed and real power, and hit a couple balls hard the other way, including a fly ball to the wall in right-center. While Bogaerts appeared to recognize off-speed pitches well, he swung through several breaking balls, including three straight in one poor at-bat. Improved patience will be key for Bogaerts to realize his full potential at the next level.

Tall and lean at 6’3 and 185 pounds, Bogaerts looked smooth at the shortstop position. He flashed some nice range making a sliding backhand play and putting plenty on the throw to first. While he may eventually outgrow the position his defense is sufficient for the major-league level. In the best-case scenario, Bogaerts provides elite-level offense combined with solid defense from the shortstop position a la Troy Tulowitzki or a young Nomar Garciaparra. Bogaerts may have the opportunity to make a Manny Machado-like impact as a late-season call-up. With Stephen Drew being a free agent this offseason, Bogaerts will likely have the opportunity to win the Red Sox starting shortstop job in 2014, which would be his age-21 season. Nomar Garciaparra, the last great Sox shortstop, took over the position full-time in his age-23 season.

Jbj-hr (overthemonster)

Jackie Bradley Jr.: An outstanding spring earned Bradley Jr. a starting spot in left field for the Red Sox.  He then promptly reminded fans how little spring stats mean, as he has posted a .155/.258/.310 slash line, with a .259 wOBA and 54 wRC+, compiling a -0.4 fWAR in 23 games. A 30.3 K% hampered him in 66 PA with the Sox. Fortunately, his minor league stats have shown much more promise, as he is currently at .278/.378/.489 with a .388 wOBA and 140 wRC+ with Pawtucket. Bradley Jr. has also exhibited good patience with a 12.3 BB%. Plate discipline has been a strength of Bradley Jr’s. game, as he has posted a 14.0 BB% and a 16.7 K% over his minor league career. While his career minor league BABIP% of .350 will likely fall some at the big league level, it will certainly be higher than the .194 this year, with his true talent likely being in the .310 range. Though Bradley is only 31/46 in stolen bases for his professional career, scouts have noted his base running chops. Additionally, his speed, range, throwing arm and instincts give him the potential to be a plus defender. With the likely departure of Jacoby Ellsbury this offseason, JBJ will have every chance to win a starting spot in 2014.

Middlebrooks-dickey-homer-1_medium (GIF from SBNation)

Will Middlebrooks: Middlebrooks burst onto the scene last year, offering a bright spot for the Red Sox during a mostly dismal 2012 campaign. He slashed his way to .288/.325/.509 with a .357 wOBA and 122 wRC+ compiling 1.9 fWAR before a broken bone in his hand ended his season after 75 games. These numbers may have obscured his plate-discipline issues, as his strikeout and walk percentages were 24.5% and 4.5%, respectively. However, 2013 has not been so kind to Middlebrooks, who was sent down on June 25. At the time of his demotion, he was .192/.228/.389 with a woeful .266 wOBA and 60 wRC+, posting a -0.6 fWAR. His K% increased to 27.8%, with his BB% at 4.2%. A major culprit of his struggles are BABIP-related.  In 2012 his xBABIP% was .336, and his actual BABIP% was .335.  This neat symmetry has been dashed in 2013 as his xBABIP% is .327, a far cry from the .221 he has experienced. Furthermore, his struggles have been compounded by a HR/FB % that has dropped from 21.4 to 15.0 despite his average fly ball distance experiencing a small increase from 278.9 to 280.4. Middlebrooks’ batted ball profile suggests that his poor offensive numbers are due for a positive correction. In 40 AAA games Middlebrooks has shown improved contact skills, posting a K% of 18.8% with a BB% of 8.0%, improvements on his career minor league rates of 25.6% and 7.5%. He showed more patience at the plate when I saw him, laying off several breaking balls, and pouncing on a hanger. His BABIP% of .281, compared to his minor league career average of .346, has limited him to a solid but unspectacular .339 wOBA and 107 wRC+. Middlebrooks showed a strong arm and good athleticism and footwork at third, but he occasionally gets sloppy on his throws and his range to his left could be improved.

While Middlebrooks’ stock may have fallen with his struggles in the majors this year, and less than great AAA results, Red Sox fans should not lose faith. His stellar results in 75 games in 2012 may have caused some fans/personnel to gloss over his raw plate approach. While pitchers seemed to do a better job of exploiting that weakness before Middlebrooks’ demotion in 2013, at least some of his poor results can be attributed to a .221 BABIP. His contact rate in AAA has been an improvement on his career minor-league numbers, and despite fewer of those balls in play going for hits, he has managed decent numbers. If Middlebrooks can hold a K% and BB% around 20% and 6-7% at the next level, he should be a very productive player for the Red Sox, as his BABIP% will likely undergo positive regression to go along with his excellent power.


 (Image from overthemonster)

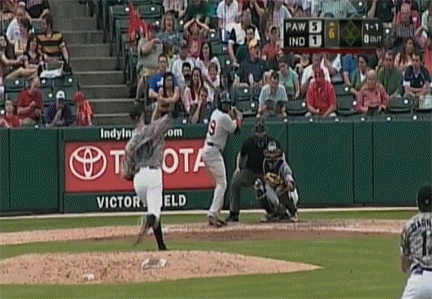
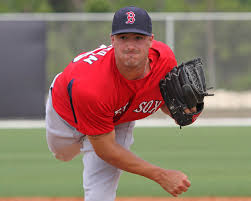
Allen Webster: Webster had a rough go of it over six starts at the big-league level, as the 23-year-old right-hander posting a 9.57 ERA in 26.1 innings with 21 strikeouts and 14 walks and a whopping 7 home runs. While his DIPS numbers were less awful, his 6.57 FIP and 5.07 xFIP earned him a -0.3 fWAR. Nevertheless, Webster showed some promise. Despite a strikeout rate of only 16.4%, Webster’s contact rate was only 71%, well below the MLB average of 78%. When I saw Webster June 28 against Toronto, I was impressed by his fastball, which ranged from 92-97 with sinking action that produced lots of ground balls. In six starts his GB% is 41.8. For the season, his fastball has averaged 94.1 mph, which is 18th highest among pitchers with 20 or more innings. His changeup, which he throws 26.8% of the time is his favorite secondary offering. At an average of 85.3 mph there is good separation from the fastball, and it showed good depth and tilt. His slider, which he throws only 9.8% of the time looked promising, with some late bite. It averages 84.5 mph. He mixed in a couple curveballs at 77mph, but this looked like more of a show-me pitch than something Webster can feature. Generally Webster had a smooth, clean delivery, and his 6’3 frame allowed him to get a good plane on his pitches. His release point faltered as he tired in the 5th and 6th innings. Webster’s control and command will have to progress to realize his potential as a starting pitcher, as his professional walk rate of 10% is on the high side. If Webster can lower his walks and import his minor league 22.3 K% and 3.09 FIP, he could be the Red Sox #2/3 pitcher. If not, his fastball velocity will likely slot him into a high-leverage relief role.

Anthony_ranaudo_curveball_4_27_13_medium (GIF from SBNation)

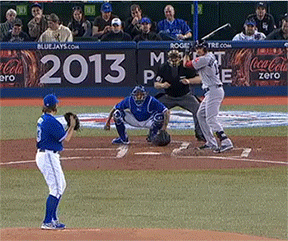
Anthony Ranaudo: The 6’7 225 right-hander from LSU was the 39th overall pick for the Sox in 2010. After posting a 2.95 ERA, 3.51 FIP, 24.0 K%, and 9.7 BB% in 109.2 AA innings, he earned a promotion to AAA.  I caught Ranaudo’s first AAA start, and he went 6 shutout innings with 5 strikeouts and no walks, throwing 85 pitches, 56 for strikes. His fastball was in the 89-92 range, and gets up to 94. It had good sink and a downward plane and produced lots of ground balls. He features a curveball at 75-79 with good downward break as this grainy GIF shows. His changeup could develop into above-average pitch, but is currently an inconsistent offering. Ranaudo’s stock has risen significantly after a lackluster 2012 in AA where he walked 27 hitters in 37.2 innings before having his season shut down due to injuries. If his shoulder and elbow hold up, Ranaudo could be a solid #3 starter at the next level.

 (Image from mlblogs.com)

Brandon Workman: The tall right-hander was optioned to Pawtucket following the acquisition of Jake Peavy. In 4 appearances at the big-league level (3 starts) and 20.1 innings, Workman posted a 3.54 ERA with a 2.75 FIP and 3.11 xFIP, accumulating 0.7 fWAR. Additionally, Workman had stellar strikeout and walk rates at 26.8% and 4.9%, respectively. His repertoire consists of a fastball which has averaged 91.8 mph, and a cutter, curveball, and changeup, which have improved to become average to above-average pitches. Workman has had consistent success throughout the minors, with a 23.4 K%, 6.9 BB% and 3.33 FIP. Moreover, he has been durable, throwing nearly 400 professional innings over 2+ seasons. While Workman will be pitching out of the bullpen in Pawtucket with the possibility of returning to the majors in that role down the stretch, long term he projects as a quality back-end innings eater. At his worst he is probably a lower-leverage bullpen arm.

 (Image from randombaseballstuff)

Bryce Brentz: A power-hitting outfield prospect for the Sox, Brentz is likely to miss the remainder of the season following right-knee surgery to repair a torn meniscus suffered on a slide into second base July 5th. Brentz also missed spring training in 2013 after accidentally shooting himself in the leg. Prior to the knee injury Brentz had a slash line of .272/.321/.487 with a .359 wOBA and 120 wRC+. Brentz’s biggest weakness is recognizing breaking balls, and he has posted 2013 strikeout and walk rates of 23.5% and 5.9%, respectively. His impressive minor-league stats are fueled in part by a career .332 BABIP, which is likely to fall to the .260 range at the major-league level. Brentz is not a great runner, and the knee surgery will likely affect his slightly below-average range. A former two-way player, Brentz does feature a very strong arm which resulted in 10 outfield assists in 87 games in 2012. Brentz is unlikely to post high walk rates, so future big league success will depend heavily on tapping into his impressive raw power while keeping his strikeout rate from ballooning above the 20-25% range.

Stats provided by Baseball-Reference, FanGraphs, and baseballheatmaps.com. Thanks to Marc Hulet’s prospect rankings for additional insights.