Predicting the Playoffs
By Dr. Gregory Wood and David Marmor
Among the sabermetric community, the baseball postseason has the reputation of being random. In the past 20 years from 1996-2015, the predicted winner — i.e. the team with the best season record — won the World Series only four times. This raises the question as to what specific skills and performances of a team during a season have a meaningful, if any, correlation with postseason success. This study analyzed data from every playoff team from 1996-2015 to search for significant relationships that could be used to predict postseason wins.
The first method that I used was looking for linear correlations between regular-season statistics and various measures of postseason success. If some statistics were more correlated to playoff success, they could be used to predict a team’s playoff performance.
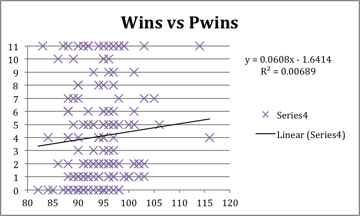
The most obvious place to start was regular-season wins. As I had expected, there was very little correlation between regular-season wins and postseason wins.
In the graph below, every playoff team’s regular-season wins has been plotted compared to their playoff wins. The data has an extremely low correlation coefficient and is not a good fit with the trend line. The correlation coefficient was 0.007, which is far below the usual significance level of 0.6 or higher. It appears that regular-season record is not a significant factor in post-season success. This explains why postseason success is considered random.
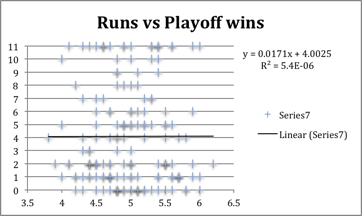
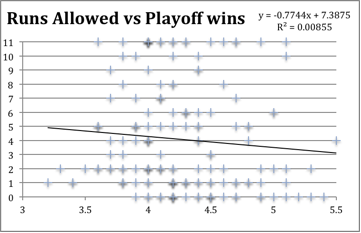
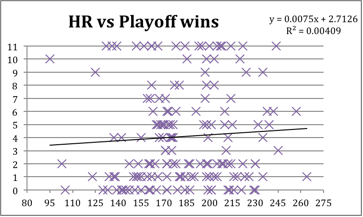
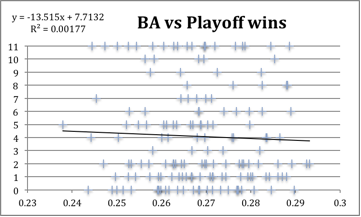
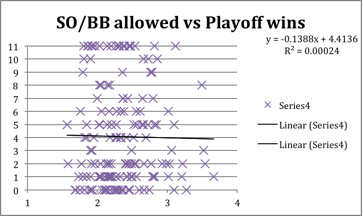
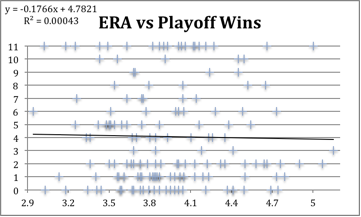
The goal was to find another statistic that had a significantly stronger correlation to playoff success. I studied many other statistics including runs, runs allowed, ERA, hits and hits allowed, home runs and home runs allowed, walks and walks allowed, strikeouts and strikeouts allowed, slugging percentage, and on-base percentage.
For each one I plotted the correlation chart and found the coefficient of correlation assuming a linear correlation. However the R-squared term was always very small no matter what I tried. This was true even with statistics that are vital to regular-season success, like ERA, OBP, runs and runs allowed.
I looked at both the actual totals as well as the totals adjusted for that year’s league average. That way I could account for the fact that the total runs scored has varied quite a bit over the 20 years.
I also tried defining playoff success in three different ways: playoff wins, playoff series won, and playoff winning percentage. However, I got similar results no matter which method I used. None of them had correlations that were significant either way. The statistic that correlated best to playoff wins was run differential, but even it was too weak a correlation to be meaningful.
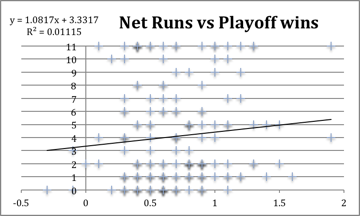
The R-squared is still very small, so run differential is not a good predictor of post-season success. This method seems to suggest that the playoffs are in fact random. However, while each statistic individually was not strongly tied to playoff success, maybe combinations of them were.
To find combinations that might be meaningful, I tried using linear modeling. I used a computer program to find the best-fit line between playoff success and the regular-season statistics I was using. The model adjusted the weight given to the different factors to try and find results that were closest to what actually happened by minimizing its chi-squared term. The advantage of this method was that it could combine several factors at once. That way it could determine if there were certain factors that were important in playoff play.
The program was designed to run thousands of simulations at a time to try and improve on its previous best result by minimizing its error compared to the actual results. For each run I selected which statistics would be used. I could give the simulation different starting assumptions and set ranges for how much weight each category could be given. When the initial conditions were changed, the simulation would return different results. However, it was never able to find a result that was statistically significant. The best coefficient of correlation I found was 0.063, far below the level that implies correlation.
It seems that the sabermetric community is correct. Playoff performance is random and not predictable by regular-season performance. Therefore, teams should attempt to build the best regular-season team they can and hope to then get lucky in the playoffs, as opposed to trying to plan specifically for the playoffs.
Appendix