Introducing Shape+: A Mixed Effects Take on Pitch Modeling

In late February, I decided to try my hand at building out my own pitch model similar to Stuff+. I had no coding or modeling experience, and outside of my overall baseball knowledge I was starting from scratch. However, with the help of Bradley Woodrum, a former Miami Marlins analyst and FanGraphs contributor, and AI, I was able to learn what I needed and develop Shape+ in R over the course of about six weeks.
Shape+ is a location independent, layered mixed effects model that aims to quantify the relationship between pitch shape and run prevention. It uses its layered model approach to isolate physical pitch characteristics and predict their expected impact on run value (xRV), producing standardized scores that are both descriptive and predictive of a pitcher’s performance.
No real outcomes were used in the training of the model. Validation was done using 2023 Shape+ scores and 2024 wOBA, xERA, and ERA. Shape+ is normally distributed, with a standard deviation of 35. This scale can be easily adjusted without affecting the performance of the model.
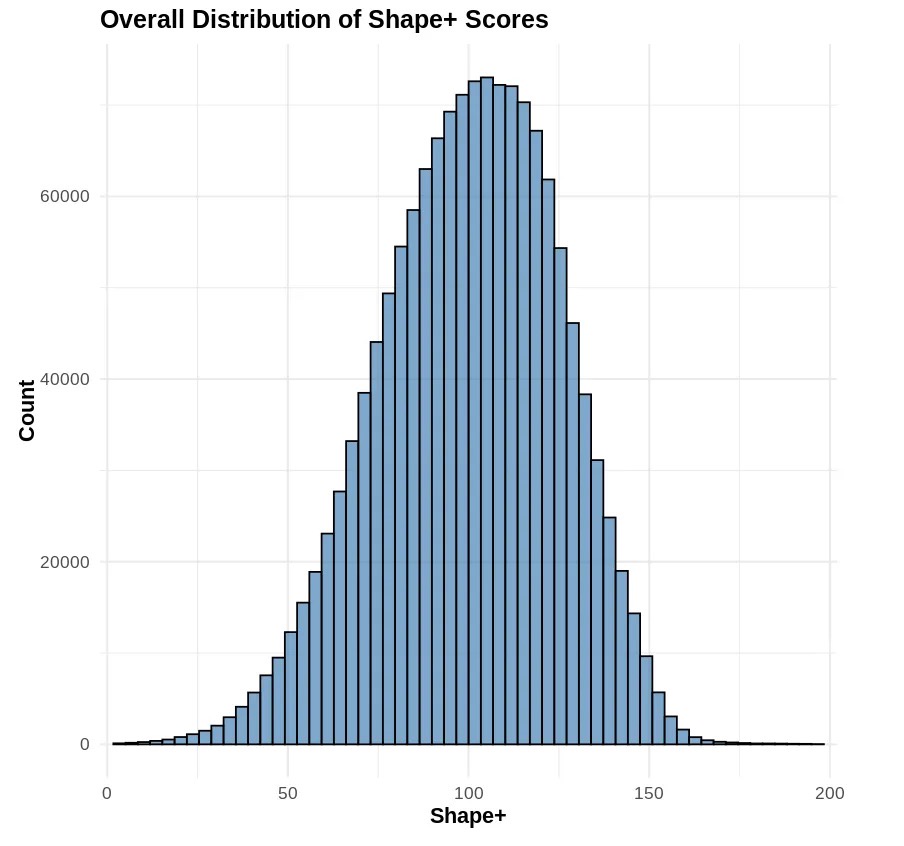
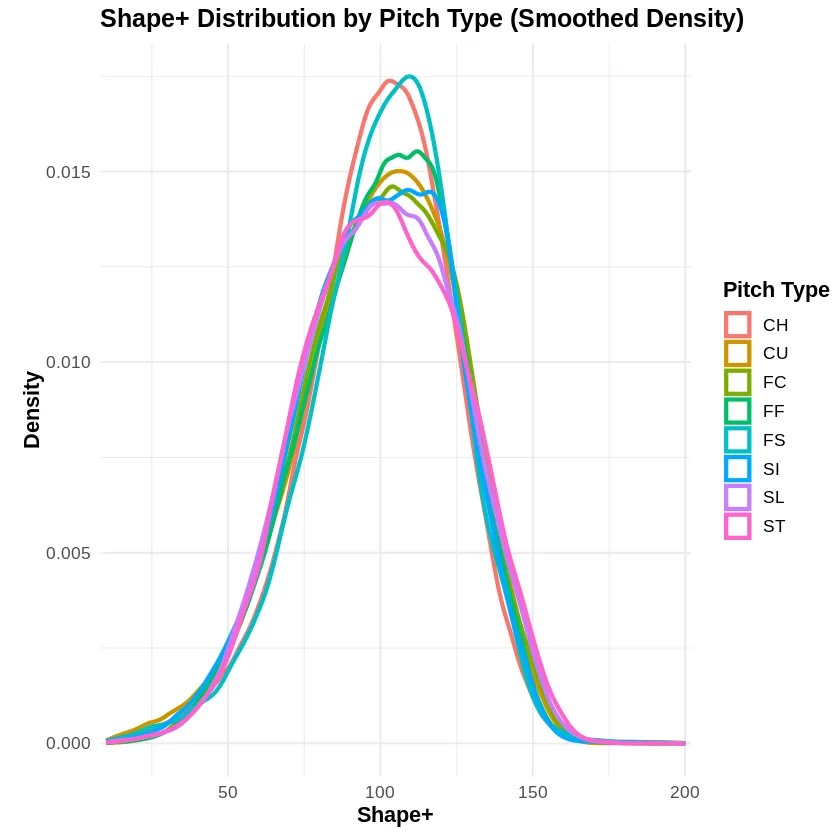
Note: The high median score for forkballs in 2023 is due to limited sample size — primarily Kodai Senga.
Data Processing
I used 2023 and 2024 MLB Statcast data for training my model — downloaded using the baseballr package. To prepare the data for modeling, the following preprocessing steps were executed:
• Filtering out all fastballs below 80 mph.
• Assigning a “game_year” column to each pitch (2023 or 2024).
• Standardizing pitch type labels.
• Assigning a platoon advantage binary indicator for batter handedness.
• Calculating IVB, VAA, and HAA, none of which are not explicitly included in standard Statcast data.
• Bucketing all batted balls by Hard Hit (≥ 95 mph), Soft GB, Soft LD, Soft FB, Soft Pop, and Not in Play.
After processing, I used the bucketed batted balls and fixed values for non-BIP to generate a run expectancy chart based on the average runs scored by bucket. Each pitch is now assigned a run value based on the chart, and the data are ready for modeling.
Model Structure
Shape+ is built using a layered mixed effects modeling framework. The modeling process consists of four sequential stages.
Model 1: xRV by Location
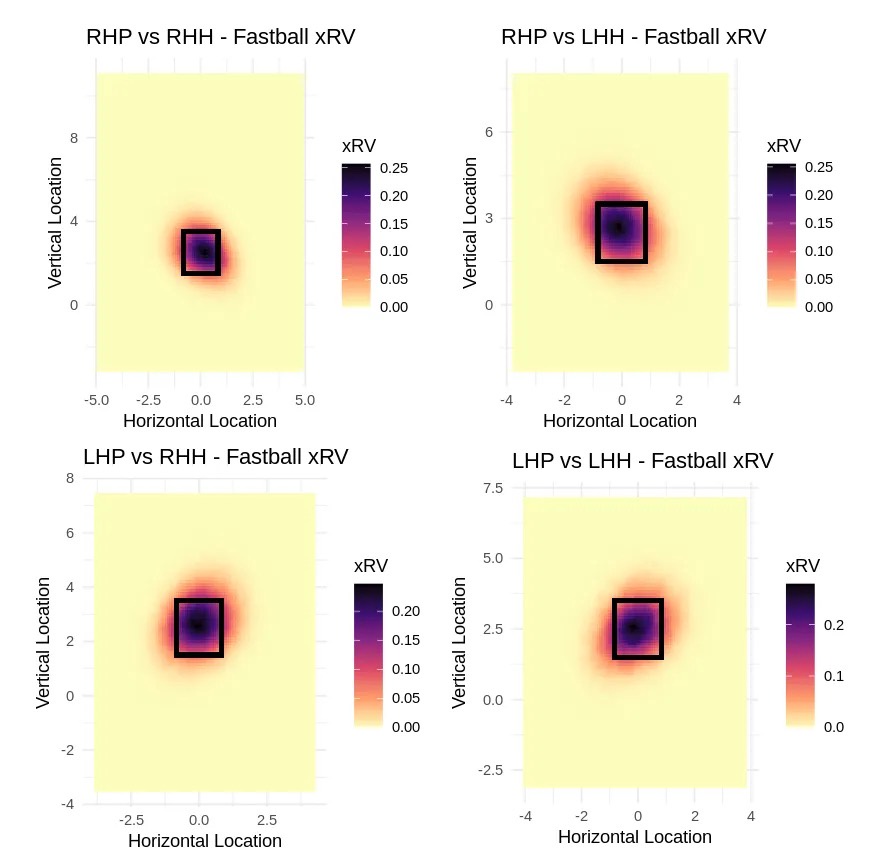
Model 1 is a large mixed effects model that is designed to predict expected run value (xRV) based on pitch type, location, platoon advantage, and count alone. The plate is sliced into a 150×150 grid to capture location effects at a granular level. Pitch types are bucketed into fastballs, changeups, and breaking balls to allow group-specific location interactions. Model 1’s goal is to quantify the value of pitch location, independent of actual outcomes or physical pitch shape.
Below are heatmaps I generated based on Model 1’s output:
Model 2: GAM Smoothing
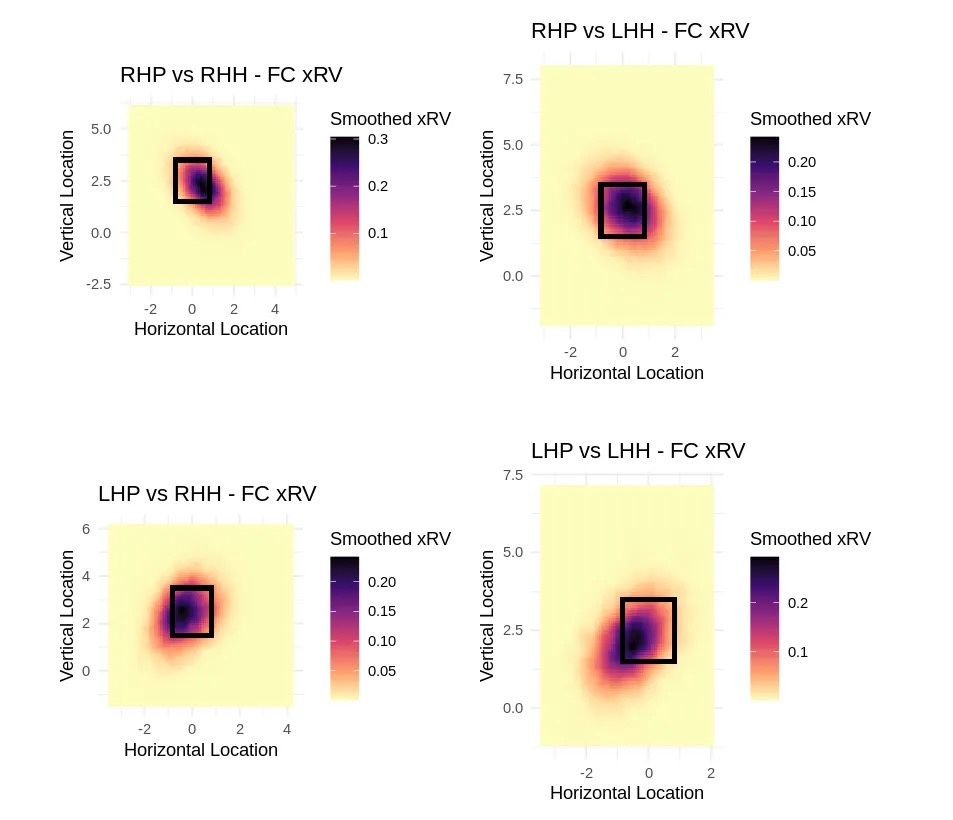
Model 2 utilizes a Generalized Additive Model (GAM) to the Model 1 outputs, smoothing the xRV surface to reduce noise and stabilize estimates across the strike zone. In doing so, I am able to retain meaningful and important patterns while eliminating spikes caused by outliers.
The smoothed Model 2 output is used as the training target for Model 3 (xRV by Physical Characteristics), isolating pitch location from the physical characteristics. As depicted in the smoothed heatmaps below, the model is flexible enough to capture nuance by individual pitch type, such as cutters.
Model 3: xRV by Physical Characteristics
Model 3 is a linear mixed effects model that utilizes polynomial, quadratic, and interaction terms to capture non-linear relationships between pitch characteristics and xRV. It uses both fixed effects and random effects.
Fixed effects capture the impact of measurable pitch characteristics (velocity, spin, IVB, etc) across all pitchers. Random effects — implemented as ((1 | PitcherID)) — account for the unobserved, pitcher-specific variations (deception, mechanics consistency).
Model 3 is trained exclusively on the smoothed xRV output from Model 2. It includes no location or outcome based variables, effectively isolating the value of the physical characteristics of a pitch. Variables included in Model 3 are as follows:
Physical Characteristics
• Velocity, standardized to create z-scores
• Induced Vertical Break
• Vertical Approach Angle
• Horizontal Approach Angle
• Horizontal Break
• Spin Rate
• Extension
• Release Height
Categorical Variables
• Pitch Group (Fastball, Breaking Ball, Changeup)
• Pitcher Throws (R/L)
• Batter Side (R/L)
• PitcherID
Model 4: Final Shape+ Output
The final step of the modeling pipeline is Model 4, converting the outputs of Model 2 and Model 3 into a standardized and interpretable Shape+ score. It subtracts Model 3’s predicted xRV (based on physical characteristics) from Model 2’s smoothed xRV (based on location). The result, arbitrarily called stuffimpact, reflects how much pitch shape alone contributes to run prevention.
Stuffimpact is then scaled and standardized, producing typical Shape+ values between 50 and 150 to improve interpretability.
Performance and Validation
Shape+ performs exceptionally well both descriptively and predictively. After conducting both in-sample and out-of-sample validation, I found that Shape+ scores correlate strongly with both current-season and next-season wOBA and xERA. I obtained validation data by downloading xERA, ERA, and wOBA numbers for 2024 from Baseball Savant.
Descriptive Correlations
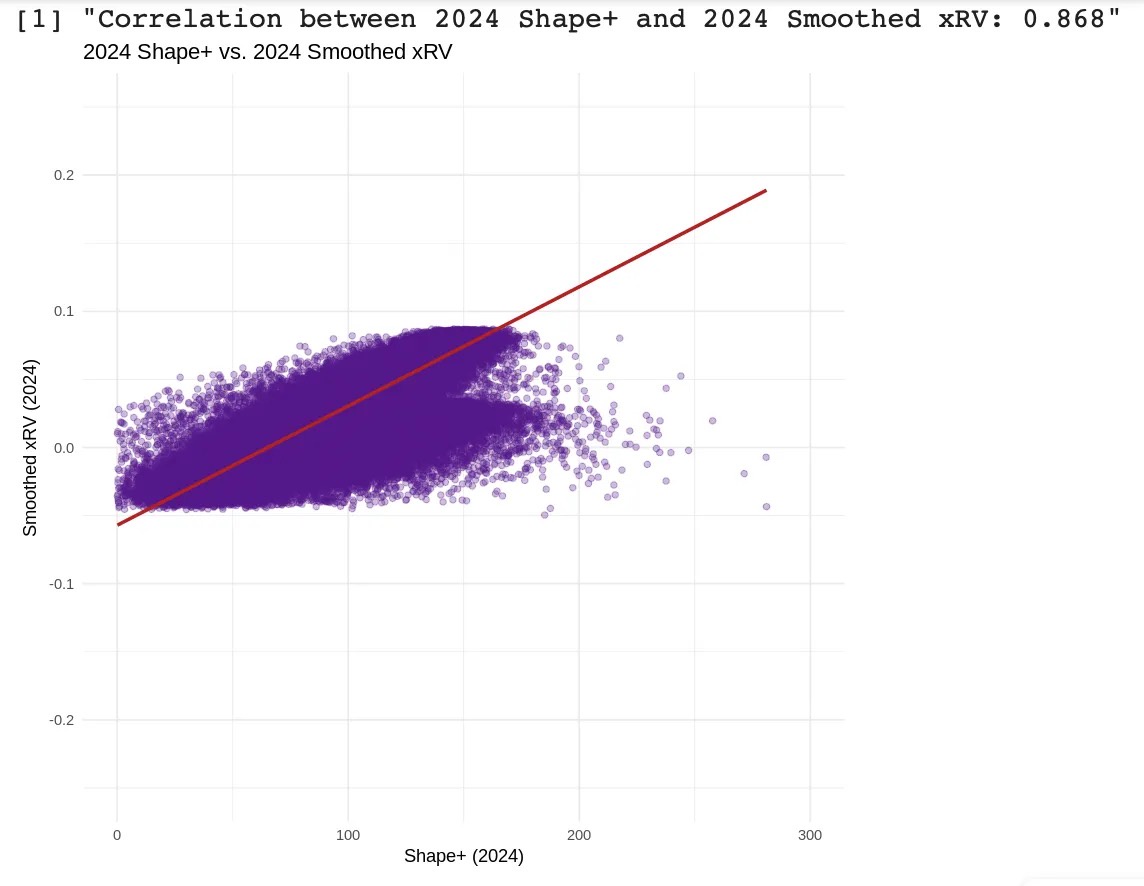
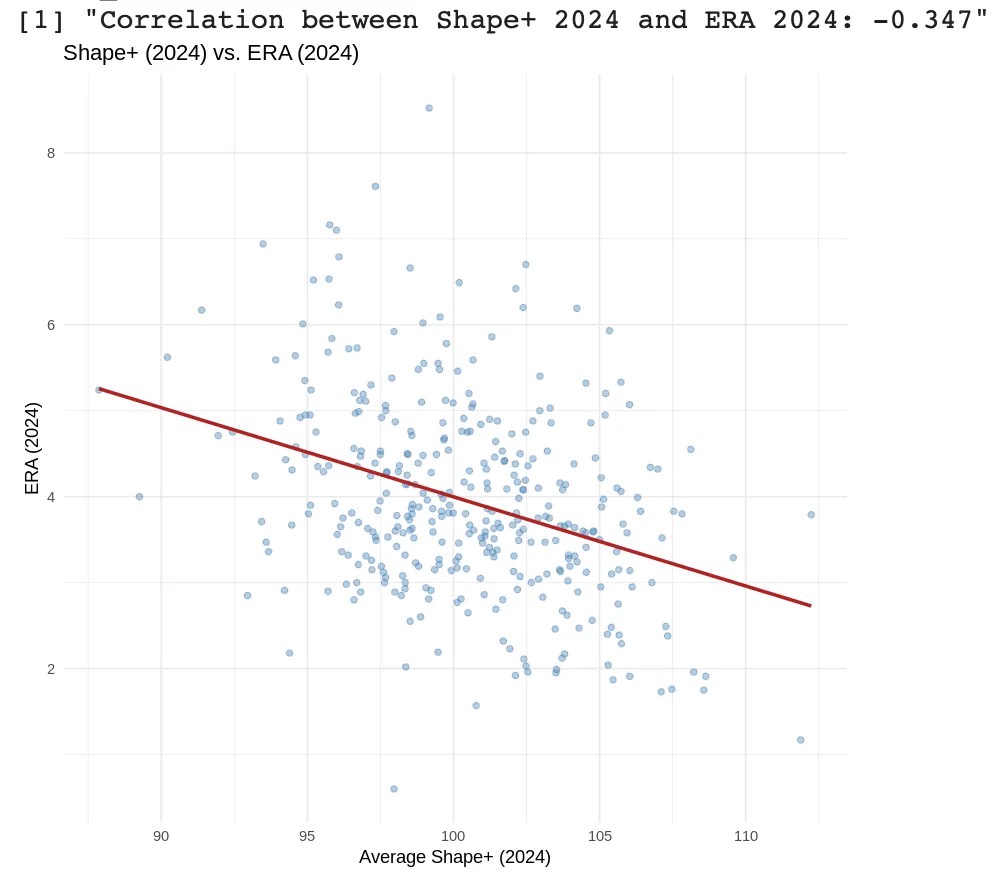
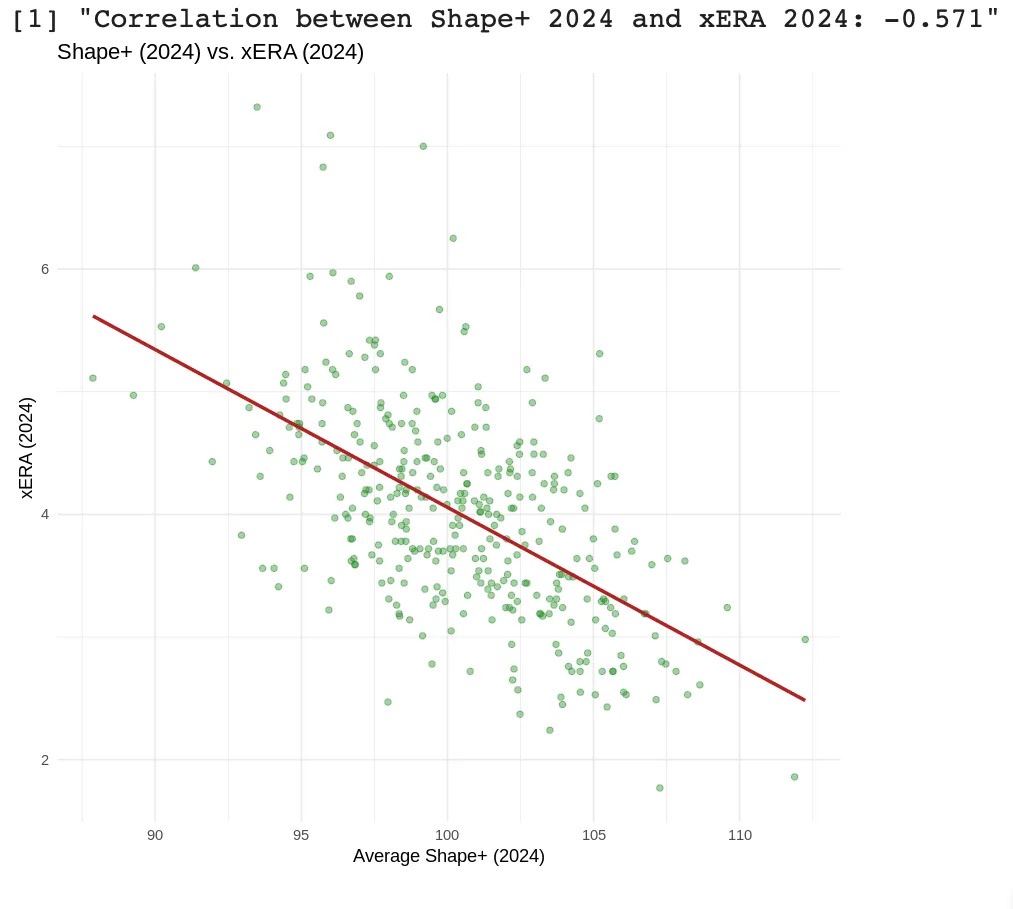
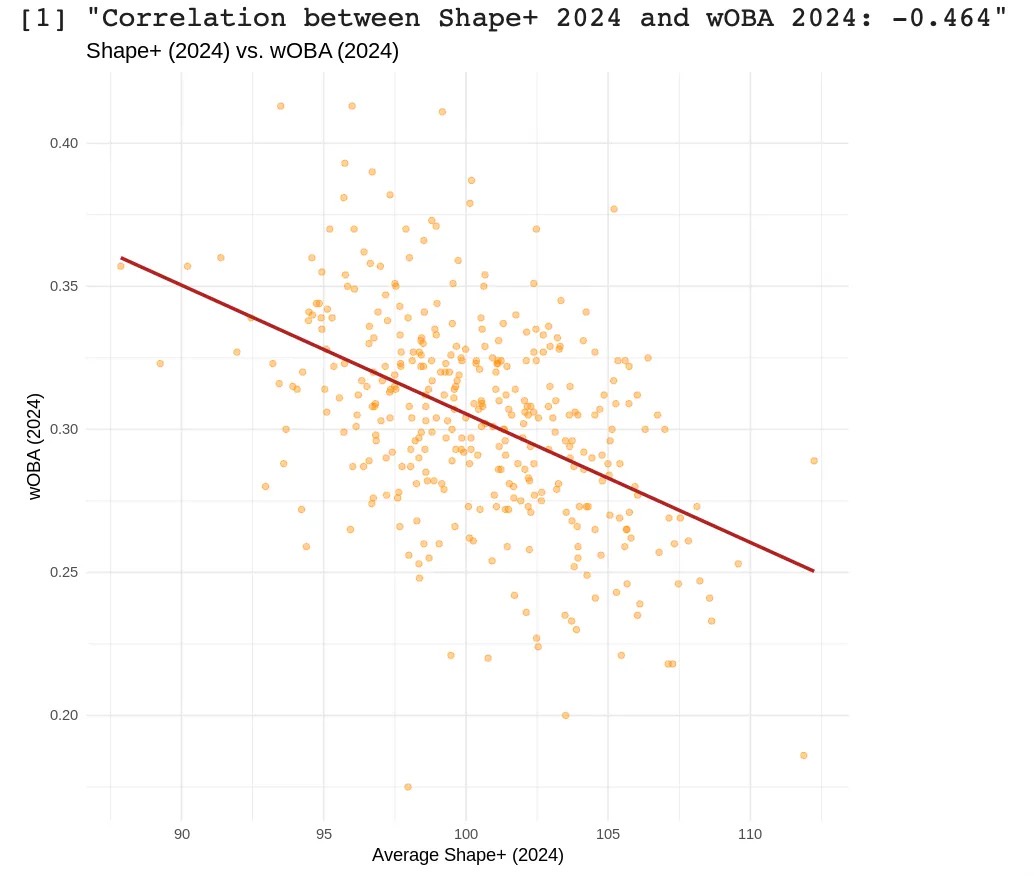
In-sample validation testing was conducted using 2024 data, evaluating how well Shape+ scores aligned with real-world metrics such as xRV, wOBA, ERA, and xERA over the same season. These correlations can been seen below:
• 0.868 (2024 xRV and 2024 Shape+)
• -0.347 (2024 ERA and 2024 Shape+)
• -0.571 (2024 xERA and 2024 Shape+)
• -0.464 (2024 wOBA and 2024 Shape+)
The particularly strong correlation with xRV — the model’s training target — demonstrates excellent internal validity. In addition to this, these strong to moderate-strong correlations demonstrate that Shape+ accurately captures the quality of contact that pitchers are inducing in real time, confirming its descriptive power. The four scatterplots below depict the four descriptive correlations.
Predictive Correlations
Shape+ shows strong year-to-year consistency, reinforcing its reliability as a forecasting metric. The correlation between 2023 and 2024 Shape+ scores is 0.801, indicating a high degree of stickiness and model stability.
When used predictively, Shape+ correlates strongly with next-season performance metrics like xERA and wOBA. This suggests that Shape+ not only describes current pitch effectiveness, but that it also effectively anticipates future run prevention ability, making it a potential tool for forward-looking evaluation.
• -0.342 (2023 Shape+ and 2024 ERA)
• -0.590 (2023 Shape+ and 2024 xERA)
• -0.451 (2023 Shape+ and 2024 wOBA)
Below, I’ve included the three predictive correlation scatterplots:
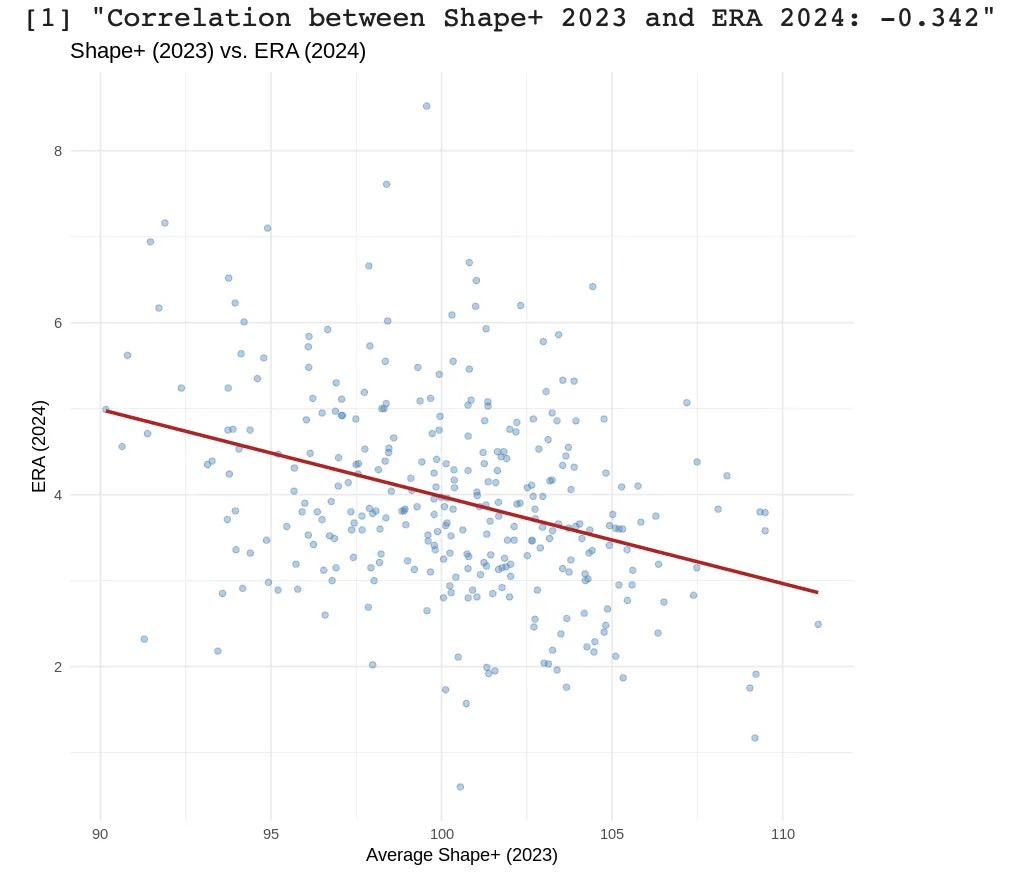
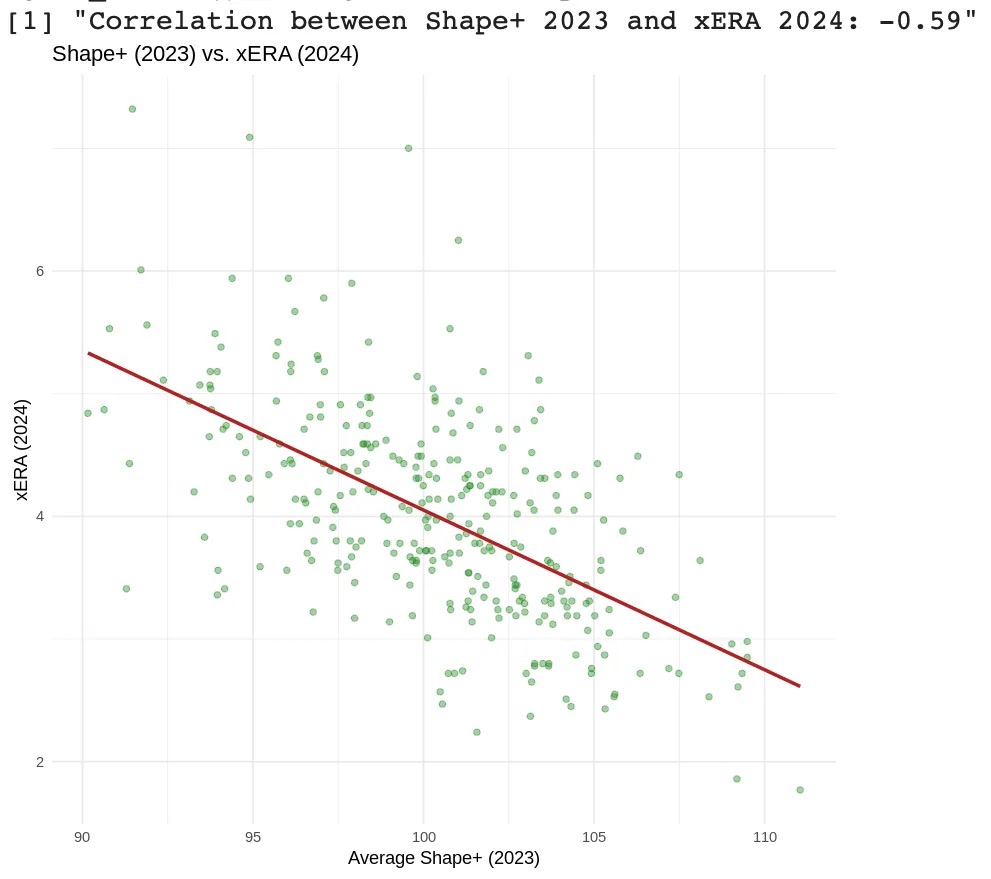
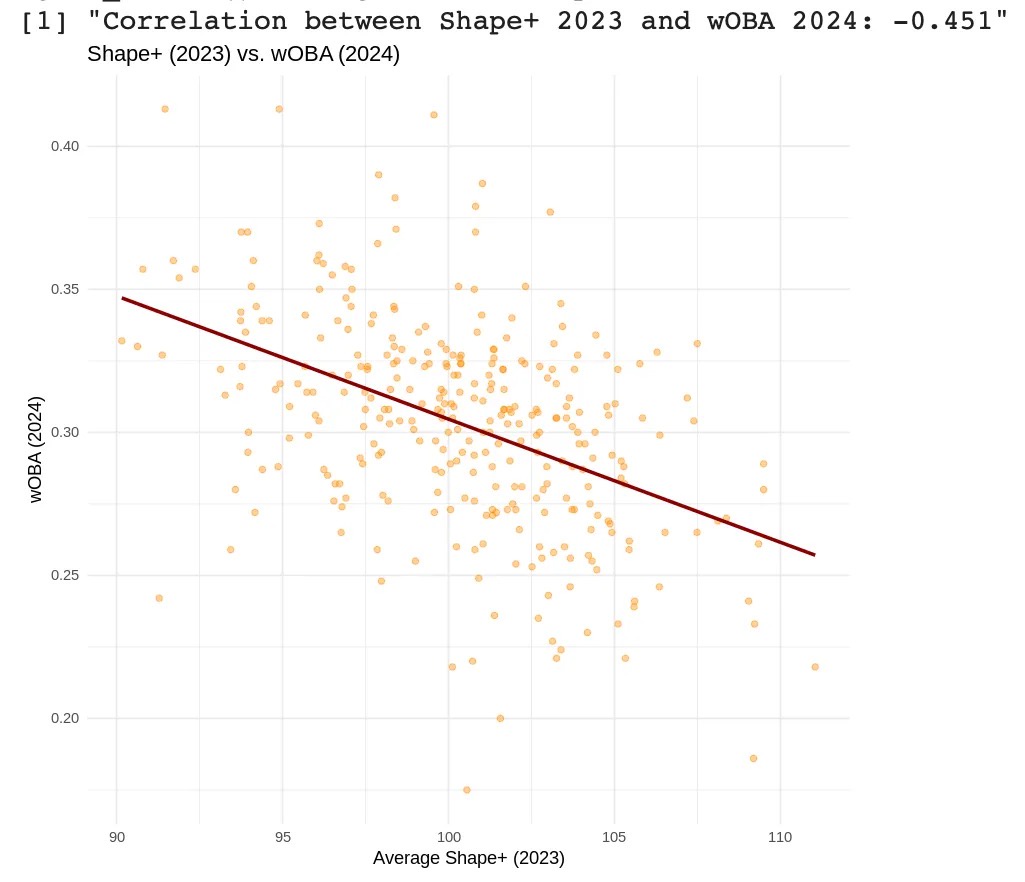
I should note here that ERA is a noisy and context-dependent metric, heavily influenced by factors outside a pitcher’s control, such as defense, park effects, and weather. As a result, it is not a reliable target for evaluating pure pitch quality. Shape+, by contrast, is specifically designed to isolate and quantify the components that a pitcher can control. Metrics like xERA serve as better validation tools for this purpose, as they focus solely on outcomes driven by the pitcher’s own skillset.
Residuals and Error
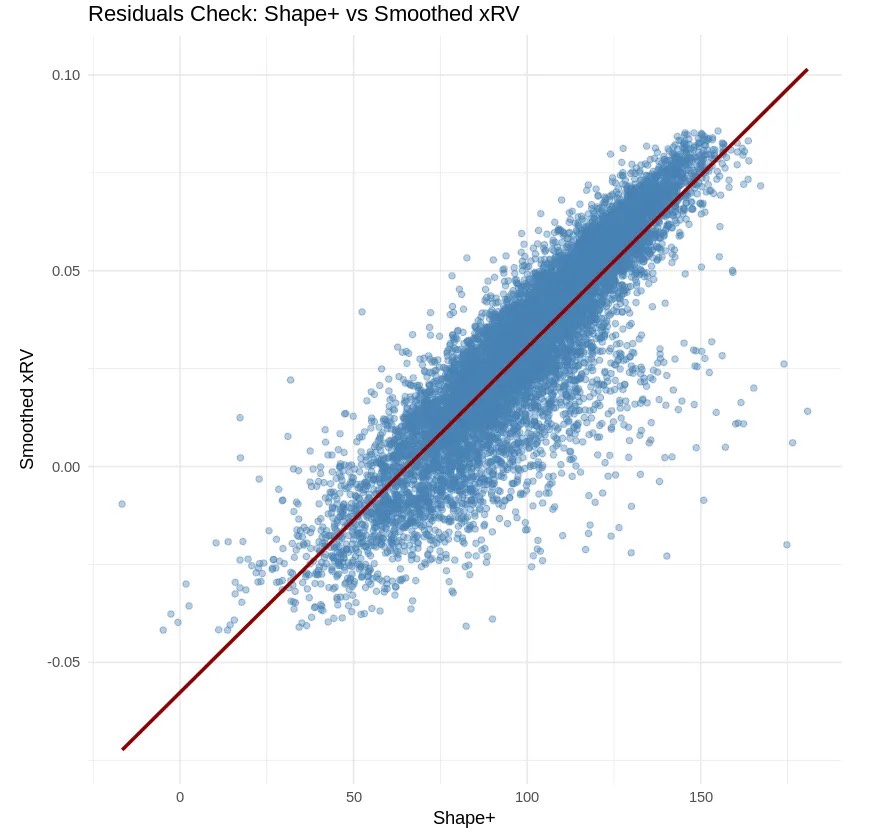
Shape+ demonstrates excellent alignment with the values it is targeting, confirmed by strong error metrics and stable residuals.
• RMSE: 0.022
• MAE: 0.018
These low values indicate that predictions from the model are consistently close to the actual smoothed xRV values, verifying the model’s precision.
Residuals show a tight linear relationship with minimal spread and few outliers. They are evenly distributed across the Shape+ scale, indicating low bias and overall consistency. Taking both the RMSE/MAE and residuals plot into account, we can confirm that Shape+ reliably quantifies pitch-level run prevention.
Pitcher Cases
Shape+ can be easily applied to individual pitchers to evaluate the shape-based effectiveness of their arsenals. Using a few lines of code I can pull the 2024 Shape+ score for a given pitcher’s arsenal.
Robert Suarez, RHP, San Diego Padres

Josh Hader, LHP, Houston Astros:

Cole Ragans, LHP, Kansas City Royals:
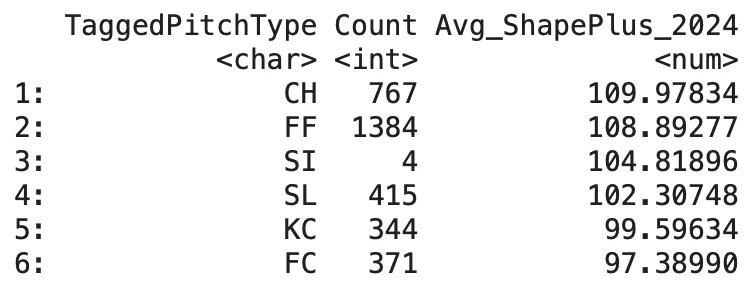
MacKenzie Gore, LHP, Washington Nationals:

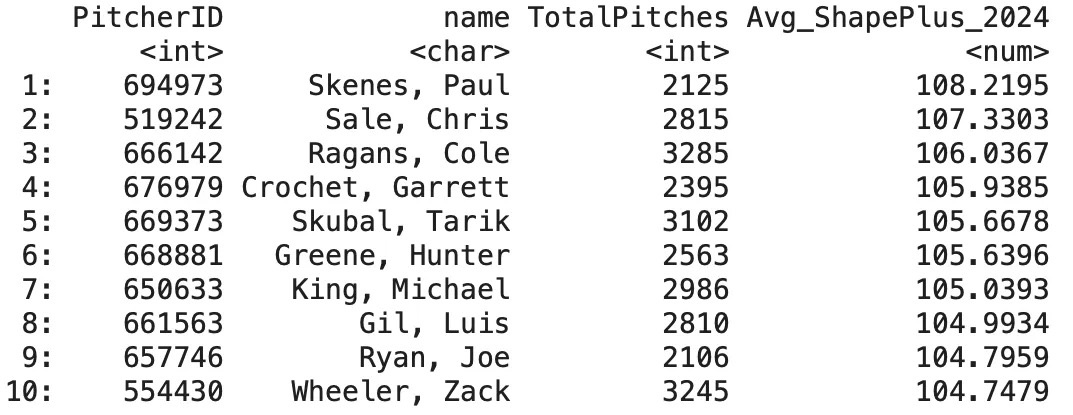
We can also pull the top 10 pitchers by Shape+ in 2024 (min. 1,800 pitches):
Conclusion
Shape+ is a location-independent model that quantifies the relationship between pitch shape and run prevention. By combining a layered modeling framework — including location modeling, GAM smoothing, and physical attribute regression — Shape+ aims to provide a robust and interpretable evaluation of pitch effectiveness.
Shape+ demonstrates both strong descriptive and predictive performance, and compares favorably to existing public models — particularly in its ability to forecast next-season xERA and wOBA.
Cade Cavin is the Assistant Director of Analytics for Point Loma Nazarene University in San Diego.