A Different Way to Look at Strikeout Ability
Mike Podhorzer has looked into the relationship of a batters’ average fly ball distance as it relates to their HR/FB ratio, and has found results that will allow others to more accurately project a hitter’s home run totals from year to year.
This got me thinking. Which can be a good or bad, but in this case, the authors’ labor produced a fruitful return. While a hitters’ HR/FB ratio can fluctuate indiscriminately from year to year, Podhorzer has proven a batters’ average fly ball distance is a better indication of a player’s true talent power production. In the same light, my study looks at how a player’s swinging strike rate (SwStr%) is a better indication of a pitcher’s strikeout potential than K/9.
My assumption was that K/9 and SwStr% have a strong relationship. But, how strong of a relationship is it? To find this out, I took all qualified starter seasons from 2003 to 2013, which gave me a sample size of 933 pitchers, and ran a correlation between their SwSTR% and their K/9. The results showed that there is an exceedingly positive correlation between SwSTR% and K/9, to the tune of a .807 correlation coefficient and a .65 R2.
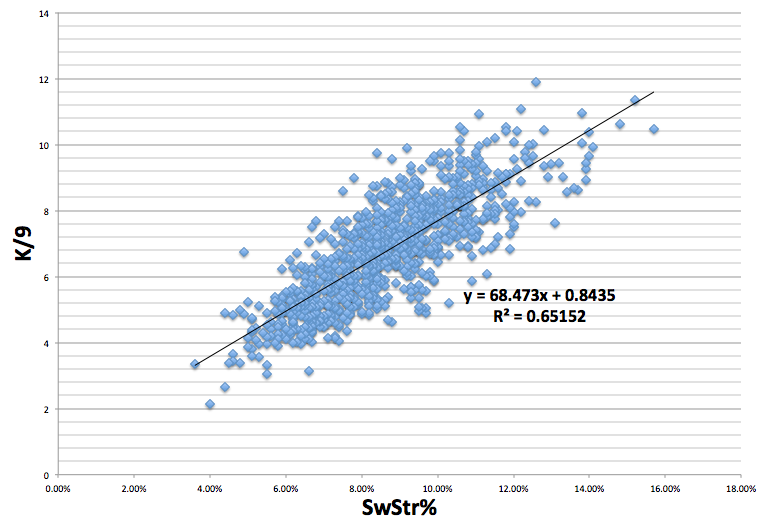
What is important to note is that there are very few pitchers present in the sample with a SwStr% above 13%, which may be symptomatic of something larger. Getting batters to swing and miss is difficult. The more often you can get a batter to swing and miss, the more valuable you are as a pitcher. As a result, the higher the SwStr%, the smaller the sample size becomes. For example, Johan Santana (2004) and Kerry Wood (2003) are the two lone dots to the farthest right on the graph with SwStr% of over 15: wow.
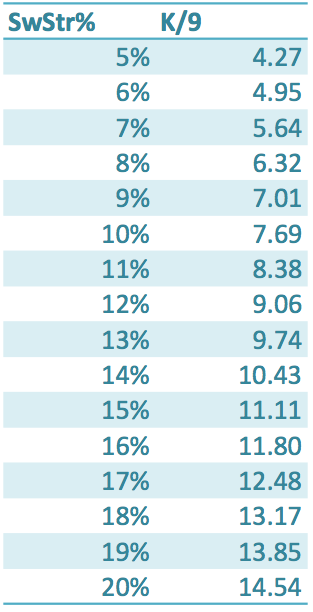
After the relationship between SwStr% and K/9 ratio became unmistakable, I calculated what a particular SwSTR%s translates into, as far as K/9, with the formula Y=68.473*x+0.8435, and got this chart:
The next step is to take what we have discovered and apply it to a sample. The chart below shows each qualified pitcher for 2013, their SwStr%, xK/9, K/9, and K/9-xK/9. xK/9 is what we would expect a pitcher’s K/9 to be based off of their SwStr%, and K/9-xK/9 shows us how much a pitcher over-performed or under-performed their SwStr% and xK/9.The first set of ten names are the pitchers who outperformed their xK/9 the most, and the second list of ten names are the players who underperformed their xK/9 the most.
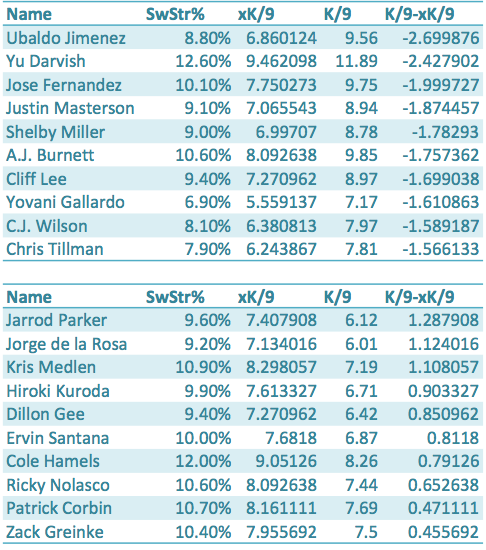
The results show that Ubaldo Jimenez, Yu Darvish, and Jose Fernandez are the pitchers who have outperformed their xK/9 the most in 2013. These three pitchers also have great a great amount of deception and/or command (deception in Jimenez’s case: because, no one has ever called Ubaldo a control artist). And, while they may have outperformed their true talent in 2013 to an extent—they all had remarkable years—maybe that deception and control, which SwStr% does not take into account, leads to less swings by batters and more pitches taken for strikes, as opposed to swung at for strikes.
Perhaps xK/9 is more helpful when we look at pitchers who underperformed their SwStr%, like Jarrod Parker and Kris Medlen. Both of these pitchers had down years compared to what their projections suggested, but their xK/9s seem to be optimistic about their futures. Parker showed a .18 improvement in his K/9 from the first half to the second half of the season, while Medlen showed almost a full point improvement going from a 6.81 K/9 in the first half to a 7.67 K/9 in the second half.
While xK/9 may miss something—deception and command—when it comes to pitchers that outperform their SwStr%, xK/9 seems to find a reason to be optimistic when it comes to pitchers like Kris Medlen and Jarrod Parker who have underperformed their SwStr% and strikeout potential.
Devon Jordan is obsessed with statistical analysis, non-fiction literature, and electronic music. If you enjoyed reading him, follow him on Twitter @devonjjordan.
Nice article. The big question that remains unanswered (at least from my perspective): is xK/9 a better predictor from year to year than K/9 is?
Why would you use K/9 instead of K%? K/9 is inferior due to the per inning basis.
Great read. I like K/9 for this.
Podhorzer developed an equation to forecast %, which he explained
earlier this year
It seems like having a high SwStr% probably means you have a good slider or splitter rather than having a high K%, necessarily. Different pitch types have different swing rates, but that doesn’t necessarily mean that guys who use those pitches are going to be more successful than guys who don’t.