Archive for August, 2010

Mark Reynolds’ Whiffs by Pitch Type

Mark Reynolds is perhaps one of the more interesting power hitters heading into his prime this season. He has led the entire league in strikeouts since 2008, holding the all-time record for most strikeouts in a season with 223 K’s last season.

This year, he leads the league once again in strikeouts, as well as perennial leader in swinging strike percentage. He has whiffed on 17.3% of all pitches this season, second place being Ryan Howard at 14.4%. Interestingly, Reynolds does not actually swing at everything a la Jeff Francoeur (60.7% swing percentage) and is barely in the top 50 in percentage of pitches he swings at with 46.8%. This makes it even more amazing that Reynolds leads the league in strikeouts and swinging strike percentage regularly without even taking that many swings. That’s a lot of whiffing going on, and I do suppose that the rare times he does connect the bat to the ball, he hits it hard.

I wanted to know more about Mark Reynolds’ swinging strike percentages to see how he fares against certain pitch types by handedness. Of the five main pitch types, fastballs, sliders, cutters, curveballs, and changeups, Mark Reynolds has seen cutters less than 200 times since his debut, 139 cutters from right-handed pitchers and 41 cutters from left-handed pitchers. He has seen at least 200 pitches for the other pitch types for right-handed pitchers or left-handed pitchers. Ignoring cutters due to small sample size, I will take a look at Reynolds’ swinging strike percentages against four-seam fastballs, sliders, curveballs, and changeups.

Let’s take a look at Mark Reynolds’ swinging strike percentages against four-seam fastballs split by RHP and LHP (1435 pitches from RHP, 468 pitches from LHP):

Four-seam fastballs

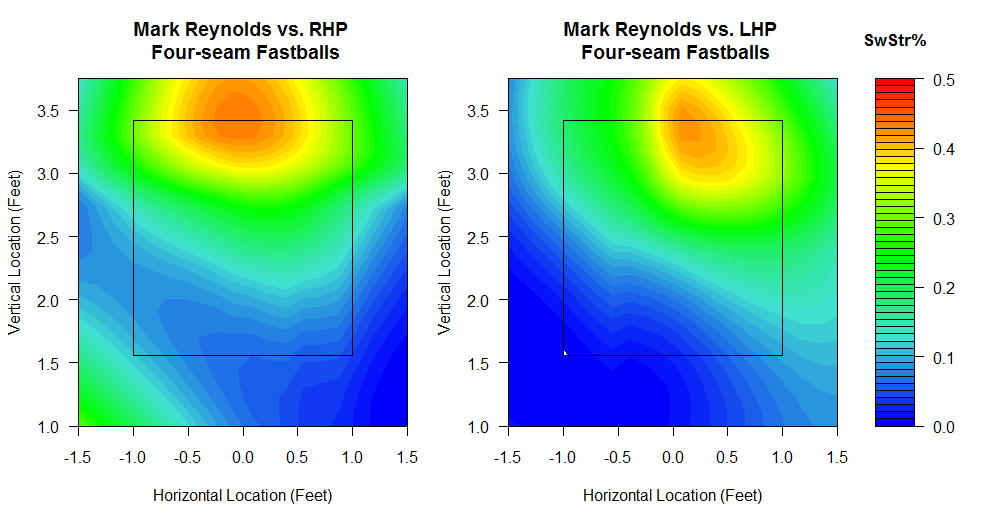
Here, it looks like Reynolds falls victim to high fastballs from both right-handers and left-handers. For Reynolds, he whiffs on the outside fastball from LHP stick out as well as the low and inside fastball from RHP.

Here’s a look at Reynolds against sliders (1542 from RHP, 224 from LHP):

Sliders

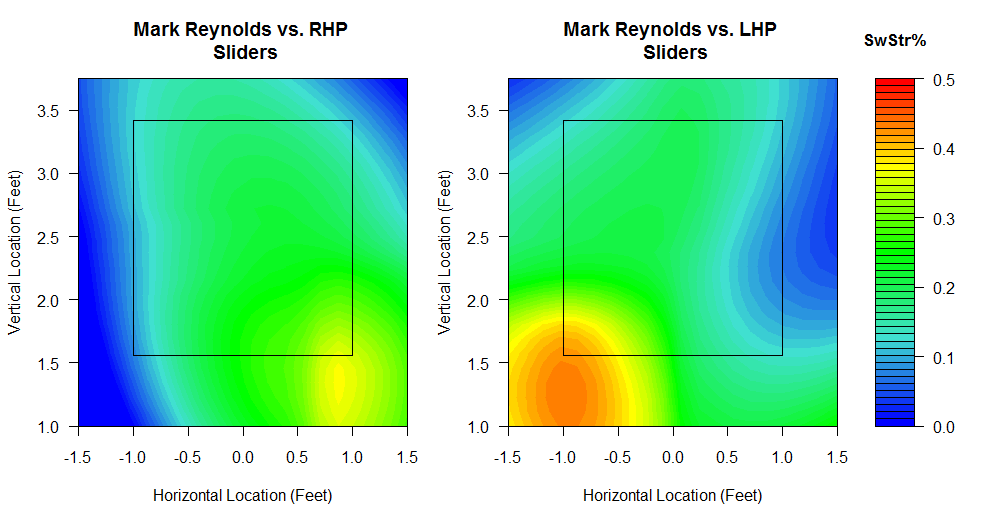
This is interesting. Reynolds strikes out far more against right-handed pitchers than against left-handed pitchers, but he tends to swing at (and miss) sliders coming from LHP more than he does from RHP. LHP sliders come low and inside while RHP sliders go low and outside, but even LHP sliders coming in from low and outside are swung at and missed by Reynolds.

Curveballs against Reynolds are a whole different story (567 from RHP, 228 from LHP):

Curveballs

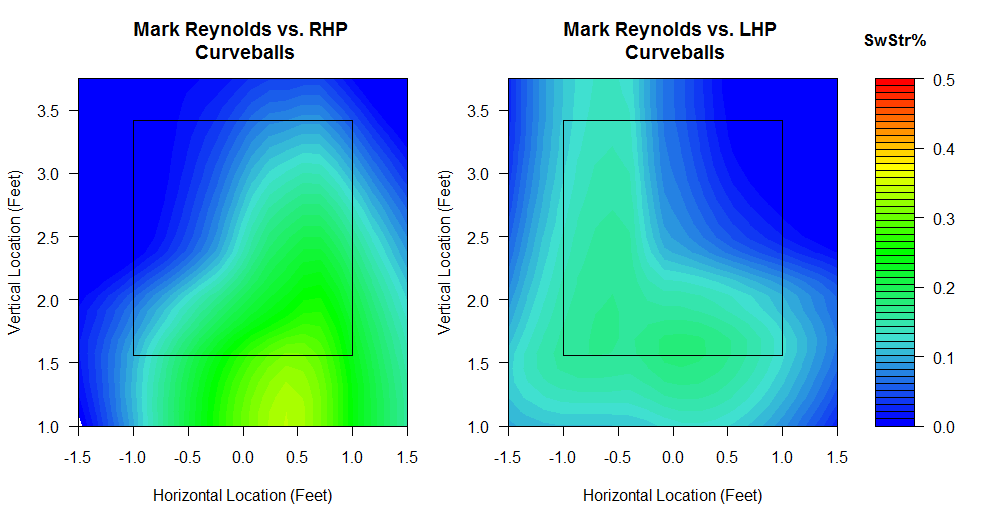
Here, Reynolds clearly struggles at connecting on curveballs from right-handed pitchers, some in the strikezone and most low and outside the strikezone. Curveballs from LHP also get Reynolds to whiff sometimes on the inside part of the plate as well as the lower part.

Finally, here’s a look at Reynolds against changeups, which look like his greatest weakness when it comes to missing pitches (430 from RHP, 338 from LHP):

Changeups

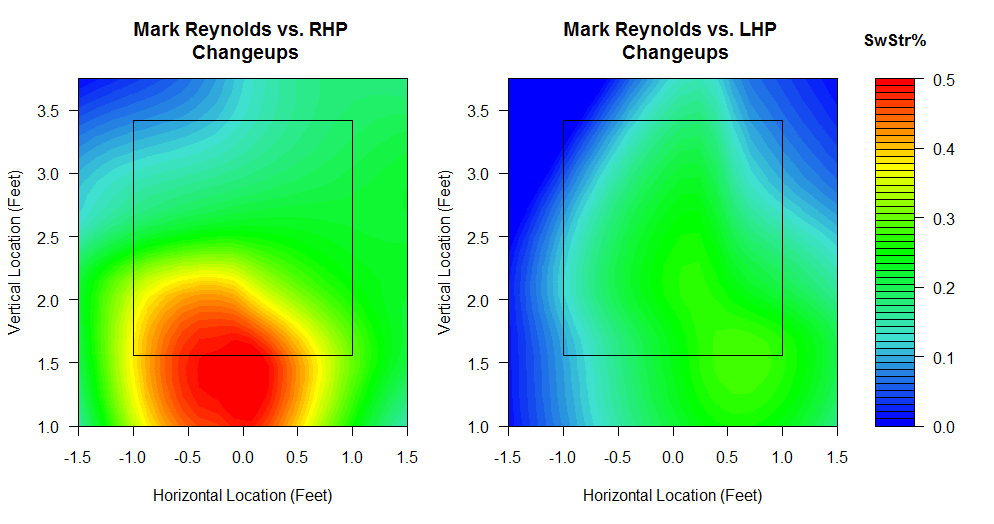
This is very telling. The splits against changeups are very different, as Reynolds whiffs on over 50% of changeups from right-handers that are located on the edge of the strikezone at the bottom. This is much different from LHP changeups, where any spot doesn’t look to cross over 30% whiff rate, except the lower righthand corner of the zone. What’s also crazy about this is that when you look at Reynolds against changeups in general, he misses at around 20% of nearly all changeups low outside and nearly all areas within the strikezone as well.

From these plots, there are characteristics of Reynolds’ swinging strikes that are similar to conventional thought and common knowledge, such as chasing high fastballs or low breaking balls. But the key to exploiting Reynolds’ weakness at missing the ball when swinging is definitely throwing timely changeups, especially from right-handed pitchers, while it seems that Reynolds is less prone to whiff against LHP curveballs the most.

This article was originally posted at Think Blue Crew, a blog dedicated to data visualization of baseball, basketball, and football statistics. Check it out for more f/x visualizations like this.


Cesar Izturis’ Inexplicable Continued Employment

As far as value goes, being a +5.8 WAR player is generally considered quite an accomplishment. After all, only three players have accrued that much value this season (Josh Hamilton, Cliff Lee, and Roy Halladay) and the list of those who topped the mark last year is a roll call of stars.

Why, then, is it with a contemptuous sneer that I note that Cesar Izturis is a +5.8 WAR player? Because that’s his career mark. As shocking (or not, if you happen to be an Orioles fan) as this may be, four months of 2010 Josh Hamilton has been more valuable than an entire decade of Cesar Izturis.

And because direct numerical comparisons are always an exhilarating exercise, why don’t we look at the career WAR marks of some other shortstops? Luminaries who have surpassed the “Izturis Line” include Bobby Crosby (in 1,342 fewer plate appearances), Alexei Ramirez (in a whopping 2,637 fewer PA), the significantly-less-than-immortal Damian Jackson (in 1,676 fewer PA), and Pokey Reese (in 1,047 fewer PA). These are but a few members of the list of unspectacular shortstops who were more valuable in fewer plate appearances than Cesar.

In light of this staggering performance, I think the two main points to investigate are why he has been so awful (given his rep as a serviceable option) and what has compelled MLB teams to run him out there on a daily basis since just after George W. Bush took office the first time.

Considering that during every one of my visits to Camden Yards this year I’ve played a mental game of “Is Cesar’s ISO above or below 0.040?” (it currently sits at a tied-for-MLB-worst 0.038), it seems like his prodigious lack of power is a good place to start. Despite posting a very reasonable strikeout rate (9.7%), an OK walk rate (4.9%), and a mediocre but not crippling BABIP (.281) in his career, Izturis boasts a meager .276 lifetime wOBA, a direct result of an equally abysmal .068 career ISO. Never in a full season has he produced an ISO above .100, although he did give the Blue Jays a (comparatively) robust .119 ISO in 46 games in his rookie year in 2001. All of this ineptitude translates to an insane -169.9 batting runs over 4,185 PA spanning the past decade.

But, you argue, he’s not known for his bat. It isn’t fair, hypothetical you argues, to judge him without looking at the superior defense he provides. This segues nicely into my second question, which is why MLB teams continue to pay him to play every day.

As nearly as I can tell, Izturis’ rep among baseball media and traditional fans is that he’s a superb fielder and a decent overall player. After all, you can certainly do worse than a Gold Glove winner at short, right? Unfortunately for anyone who espouses this belief (I’m looking at you, Gary Thorne and Jim Palmer), it just isn’t true.

No matter how much you want to complain about UZR or DRS as defensive metrics, I’m willing to believe that over the course of 8,300+ career innings they paint a fairly accurate picture of Izturis’ true talent level defensively. UZR has him at +6.7 per 150 games at SS (+45.6 runs total among all positions) while DRS has him at 48 career runs saved, so the metrics agree. At that +6-8 runs per season level, Cesar has been above-average but certainly not elite with the glove.

Is this a case of MLB teams overvaluing defensive contributions at the expense of offense? After all, even the two-year, $5 million deal the Orioles gave him prior to the ’09 season has been more than the Venezuelan has been worth (+0.8 WAR during his time with the O’s). Perhaps teams let their scouting departments and Izturis’ hardware (’04 Gold Glove winner) cloud their judgment, or perhaps there just aren’t any other near-replacement-level shortstops out there. Although I’m skeptical about that last possibility.

And yet, for a guy who has hit 15 career home runs (or as many as Jose Bautista has hit since Independence Day), topped the +0.2 WAR mark just thrice in his career, and averaged a paltry +0.4 WAR since 2004, Izturis is certainly doing pretty well for himself. After all, he gets to start every day for a major league team.

Nathan Biemiller is a junior at Franklin and Marshall College who writes regularly for nothing but his college newspaper. If you would like to offer him a place to write consistently (gratis!) or if you just have questions or comments, you can e-mail him at nbiemill@fandm.edu.


xBABIP Experiment: Mark Kotsay

I am tired of Mark Kotsay. I am tired of his automatic 4-3 ground outs. I am tired of his lazy fly balls to left center. I am tired of his .190 batting average with runners in scoring position. I am tired of his .688 OPS. But most of all, I am tired of people in the White Sox organization defending Mark Kotsay. From Ozzie Guillen to Hawk Harrelson and Chris Rongey, the excuses are coming from every corner of the organization. And as an objective White Sox fan, the constant excuses are getting tiring. Luck or no luck, Mark Kotsay is a bad baseball player, that much is for certain.

Kotsay does nothing well and he contributes nothing on the field to this White Sox team, as shown by Mark Kotsay’s -0.6 WAR, good for the fourth worst in all of Major League Baseball amongst players who have at least 280 plate appearances. This shouldn’t come as a surprise, as of this moment, Mark Kotsay is hitting .228. Yet you have Ozzie Guillen saying things like, “Personally, the numbers out there for Kotsay [are not what] he deserves.” Followed by…“You can ask his teammates, you can ask [hitting coach] Greg Walker. He should have better numbers than what he has.”

You can ask any average White Sox fan or anybody in the White Sox organization and they will say that Kotsay has been unlucky or he “deserves” better. However, just how much better? Fortunately for us, the great people in the sabermetric community have come up with something that tries to battle this thing called luck. I think everybody knows of BABIP by now, but there is something better, something more contextual: xBABIP (Expected Batting Average on Balls In Play) . The concept is simple, take the mean batting average of line drives, ground balls, and fly balls that are not home runs, then create a BABIP based on those averages.

So what if Kotsay wasn’t lucky or unlucky? What if this was a perfect world where the average always happens? For the record, Mark Kotsay is a good player for this little experiment since his career offensive numbers are about as average as you can get. Currently, Mark Kotsay’s xBABIP is .269. This is more or less based on his line drive rate of 15.9%. His actual BABIP is .239. So as you see, he has been pretty unfortunate as that’s a 30 point disparity. Now let’s take this a step further, let’s say that .269 xBABIP is his actual BABIP. Mark Kotsay has hit 222 balls into the field of play (this does not include home runs), if he gets hits 26.9% of the time on those 222 balls, he would have 60 hits. Add his 7 home runs to those 60 hits and you have 67 hits in 258 at bats, which comes out to a .259 Batting Average. What about his On Base Percentage? Taking those 67 hits while adding his 30 walks divided by his 286 plate appearances, we would get an OBP of .336. So far so good right? Looks like Mark Kotsay would be a decent ballplayer if it wasn’t for those “hang wiffums” right?

Hold on just a second here, we can also apply this to his Slugging Percentage. We can play the rate game, which is a dangerous game to play, but we’ll do it anyways. Of the 53  hits Mark Kotsay has put in play, 38 have been singles, 13 have been doubles, and 2 have been triples. So from this, we can see that 71% of Kotsay’s non-home run hits have been singles, 25% have been doubles, and 4% have been triples. As I said before, this is a dangerous game to play, almost a fallacy, but since Kotsay does have an appropriate sample size here, it might be safer than usual. So taking these new numbers to his 60 expected hits, his new hit figures are 43 singles, 14 doubles, and 2 triples. This would result in a Slugging Percentage of .414. By adding Kotsay’s expected OBP and SLG together we come up with a .750 Expected On Base Plus Slugging or OPS, which is just about average.

Alright, so how do these new expected rates affect Mark Kotsay’s value? If we calculated an expected wOBA from these newly calculated values, Mark Kotsay would have a .329 Expected wOBA,  just about average. We can then calculate this into a run value to produce a new expected WAR. In this case, Kotsay would have produced -0.99 batting runs (without ballpark adjustment) in comparison to the average replacement player, much better than his previous rate of -6.2. So in this case, Kotsay’s WAR goes from -0.6 to -.08. A half win difference can go a long way at times.

So what does this tell us? Well first off, it says that Kotsay is a very average hitter in a luck-isolated world and average hitters should not be DHing 1/3 of the games for a team that already has issues scoring runs.  It also tells us is that Mark Kotsay has no place on this current White Sox team. He is a replacement level player who is only capable of DHing and playing 1B and that’s even if he hit like the “deserved” to hit. With Mark Teahen coming back and Brent Lillibridge already on the team, this team could be incredibly versatile. Isn’t that what Ozzie Guillen wanted? Isn’t that why Ozzie said no to Jim Thome, who is clubbing the ball for the rival Twins and is also a great clubhouse guy? This love affair with Mark Kotsay has gone too far. He is in fact costing this team on the offensive side of the ball. I would have no problem if Kotsay stays on this team as a pinch hitter and starts maybe once a week; he’s apparently a good guy in the clubhouse (as is his wife, I imagine). But the fact that this replacement level player has played 3/4 of this team’s games is disturbing. With the way that this situation has been tended to, you’d think the White Sox’ new slogan would be something along the lines of “White Sox Baseball: Here to Make Friends, Not to Win”.


Cleaning Up Kenny Williams’ Mess

In spite of a questionable off-season approach to their designated hitter situation and a deadline deal that didn’t fill that vortex of suck, the Chicago White Sox are in first place on the backs of Alex Rios, Alexei Ramirez, Paul Konerko, and most of the pitching staff. After facing Baltimore for one more tonight, they will be going into a critical 3 game series against division rival Minnesota. It doesn’t get us anywhere to look at the past, so the question is what can the White Sox do to maximize the value of the players they have going forward?

The most glaring weakness is still the DH spot. Mark Kotsay has received the majority of the playing time here, and he has also been the team’s least valuable hitter. Kotsay has posted a slash line of .228/.305/.378, with a wOBA of .299. Kotsay’s –0.7 WAR is not only the worst on the team, but tied for fourth worst in the MLB among players with 280 or more PAs. It’s clear that Kotsay isn’t getting the job done, but who is the most viable choice to replace him?

Young Cuban slugger Dayan Viciedo is an interesting option. He’s posting a .361 wOBA (.310/.310/.521) in his first 71 PAs. On the surface, that looks great, but his .333 BABIP is unsustainable for someone as… um… husky as Viciedo. Also, his walk rate of 0% is going to be exploited soon enough (Viciedo’s already swinging at 39.8% of balls outside of the strike zone). It’s clear that even with his incredible power, he’s just not ready for the Majors, and would likely be eaten alive in the playoffs.

Mark Teahen is nearing the completion of his rehab stint in Charlotte, and could be back with the club in the next week. The .255/.340/.387 (.317 wOBA) line he put up while starting at third base isn’t the most stunning, but against RHP he’s hitting .287/.376/.444 (.363 wOBA).

Andruw Jones has played in the DH role some, while also serving as the fourth outfielder. Andruw’s .204/.312/.444 line gives him a .336 wOBA, placing him in the neighborhood of being a league average hitter. Jones benefits from facing lefties, against whom he posts a line of .235/.350/.515 (.376 wOBA).

So based on those numbers, the answer to the DH scenario appears to be a Teahen/Jones platoon, right?

Wrong.

Well, half right. The White Sox currently have a right fielder who, while being a good hitter, is just terrible defensively. I’m of course referring to Jermaine Dye Carlos Quentin. Quentin’s line of .232/.328/.488 (.352 wOBA) is solid in it’s own right, but Quentin’s a great candidate to improve that line, thanks to the impending regression of his .213 BABIP. Quentin’s defense in the past two seasons has been quantifiably terrible. Back to back UZR/150s of –25.2 and –34.2 (the former in LF) have shown that Quentin can’t get the job done, and that he’s a DH (or maybe a first baseman, but that’s a discussion for 2011).

Teahen, meanwhile, has a UZR/150 of just –2.0 in 261 games in right. Jones, in 42 games this year, has a UZR/150 of 8.6. A platoon of these two players also would help the oft-injured Quentin stay healthy, keeping his dangerous bat in the lineup.

The White Sox are in a position that most didn’t think they could be in after the first two months of the season. The team has had some breaks, but if they’re going to compete with a very good Twins team, they have to utilize their players effectively. Getting Quentin out of the outfield and Mark Kotsay out of the lineup? Well, that’s just smart baseball.


Keeping Up With the Musials

It’s safe to say that Andruw Jones has been one of the most disappointing baseball players in recent memory. Just five years ago, Jones was in the middle of a fantastic season wherein he hit 51 homers with a .922 OPS (despite a .240 BABIP) and was worth 8.3 WAR. As recently as 2007, he slammed 26 long balls while driving in 94 and accumulating 3.8 WAR.

Then disaster struck. In 2008, after signing a two-year, $36 million with the Dodgers, Jones absolutely tanked, hitting just .158 with three homers and a .505 OPS; he struck out in more than a third of his at-bats and his once prodigious power disappeared, as evidenced by his Michael Bourn-esque .091 ISO.

In the 160 games Jones has played with the Rangers and White Sox in 2009-10, he’s regained some of his lost power, bashing 32 homers with a .244 ISO in just under 600 plate appearances. However, those numbers don’t seem particularly special for a guy who’s spent the majority of his time at first base and DH, especially when combined with a putrid .209 batting average. No one’s mistaking him for an All-Star.

And yet, there is no doubt that Andruw Jones belongs in the National Baseball Hall of Fame.

Wait, what?

For starters, let’s not be too hasty and dismiss his earlier offensive accomplishments. In 12 years with the Braves, he averaged 33 homers and 98 RBI per 162 games with an .824 OPS. He hit the 20/20 club three times, including his 31/27 season in 1998.

His 403 career homers put him 46th all-time — ahead of current Cooperstown residents Al Kaline (399), Jim Rice (382), Ralph Kiner (369), and Albert Pujols (okay, so he’s not in the Hall of Fame yet, but I’m sure they’re already planning out his plaque). And while 31 was a tad on the young side for a complete collapse, don’t forget that he had established himself as a key part of the Braves’ outfield before he was old enough to drink. But all of that is just icing on the cake.

Forget everything he did at the plate, on the basepaths, or in the dugout; if for no other reason, Andruw Jones deserves to be enshrined because of what he did in center field. Jones isn’t just one of the best defensive outfielders of his generation — he’s arguably the best-fielding outfielder of all time, and surely ranks among the top glovesmen in baseball history at any position.

Jones won 10 consecutive Gold Gloves from 1998-2007. Even opening it up to players who were honored in multiple, nonconsecutive years, that beats Ichiro (nine), Torii Hunter (nine), Andre Dawson (eight), Jim Edmonds (eight), Larry Walker (seven), and Kenny Lofton (four). The only outfielders who have ever done better are Willie Mays and Roberto Clemente (12 apiece), but I’m sure you’ll join me in condoning Jones for not quite living up to their lofty standard.

Of course, you could argue that Gold Gloves are a popularity contest, and aren’t necessarily the best way to determine the game’s best defenders (see “Kemp, Matt” and “Jeter, Derek” last year). It’s true, they don’t accurately describe Jones’ accomplishments — they don’t do them justice.

According to TotalZone (used for seasons from 1954-2001) and Ultimate Zone Rating (2002-now), Jones has saved 274.3 runs in his career with his glove. Two-hundred seventy-four point-three runs. That’s about 28-wins worth of value for his career without taking into account anything he’s done with his bat.

If that number isn’t terribly impressive to you, perhaps you should consider the context: it’s the best score of any outfielder in baseball history, and a look at the Top 10 shows that it’s not particularly close:

1. Andruw Jones 274.3
2. Roberto Clemente 204.0
3. Barry Bonds 187.7
4. Willie Mays 185.0
5. Carl Yastrzemski 185.0
6. Paul Blair 174.0
7. Jesse Barfield 162.0
8. Al Kaline 156.0
9. Jim Piersall 156.0
10. Brian Jordan 148.0

These statistics are far from perfect, and there’s definitely an argument to be made that the older numbers are particularly flawed. But even if we can’t use it to compare players of different eras (could the margin of error really be more than 70 runs?), we can see just how amazing Jones has been by comparing him to his contemporaries. If you noticed that the only other names of those 10 who played at the same time as Jones were Bonds (whose days as a serviceable fielder were numbered by the time Jones made his debut) and the woefully unappreciated Jordan, you can probably see where this is going.

Darin Erstad (146.6)? Ichiro (120.2)? Carl Crawford (119.8)? Lofton (114.5)? Mike Cameron (110.7)? Walker (86.0)? Edmonds (57.5)? None of them even come close. In fact, Jones’ score is better than any two of those names’ combined.

It’s not just outfielders, either. Jones’ TZR/UZR is the second best of all-time, behind only Brooks Robinson. Compare his 274.3 runs saved with Cal Ripken Jr.’s 181.0, Ivan Rodriguez’ 156.0, Luis Aparicio’s 149.0, and Omar Vizquel’s 136.4. He even beats true defensive legends like Joe Tinker (180.0), Honus Wagner (85.0), and the amazing Ozzie Smith (239.0). If you can go toe-to-toe with the “Wizard of Oz” in the field, you barely need a pulse offensively to deserve a place in Cooperstown.

Jones hasn’t had time to slowly build up his score by being a consistently solid fielder; instead, he grabbed the bull by the horns and has enjoyed some of the best individual defensive seasons in baseball history.

In 1998 — at age 21 — he was worth 35 runs in the field, which at the time was tied for the second-best defensive performance since tracking began in 1950. In 1999, he promptly went out and beat that, earning 36 TZR. All told, he appears on the Top 80 list for single-season Total Zone Rating five times. And that’s not including UZR, which has been kinder to him than TZR since 2003.

Will the BBWAA vote him in when his time comes? Probably not. Even assuming the voters have learned how to use the newfangled defensive metrics by then (far from a sure thing, given that a majority of NL Cy Young voters implicitly declared wins to be the most important pitching statistic last year), there are too many reasons for them to doubt his candidacy.

While TZR and UZR make sense and are great tools for getting a general idea of a player’s defensive prowess, they’re too inconsistent for fans to take as the word of God (though, in my opinion, a 70-run lead is more than enough to cancel out the margin of error). Aside from that, you’ve just got a free-swinging, power-hitting outfielder (a dime a dozen over the last 20 years) who fell off a cliff right before his 32nd birthday. He’d have to return to his younger form and maintain it for at least a few more years in order to have a realistic shot at Cooperstown.

But, as the Beatles once sang, “all you need is glove” (unless I heard that wrong), and that’s what Ozzie Smith proved when he got more than 90 percent of the vote for the Hall of Fame in 2002. Combine phenomenal defense with a solid bat (remember those 403 homers?) and there’s no question Andruw Jones deserves a spot in Cooperstown.

Lewie Pollis is a freshman at Brown University studying political science. He also contributes to BleacherReport.com, ManCaveSports.org, and Green Pages, the quarterly publication of the U.S. Green Party.


Year of the Pitcher?…Think Again

WASHINGTON D.C., August 10th – Five no-hitters.  Two of them perfect games.  A third perfecto lost.  And then there was Brandon Morrow, losing his no-hitter with two outs in the ninth.  The 2010 season has been branded as the Year of the Pitcher.  But statistical evidence points in a different direction.

RS RS/G Z-score Change Change% ABS %
2000 24971 10.28 3.34 N/A N/A N/A
2001 23199 9.55 0.72 -0.73 -7.10 7.10
2002 22408 9.22 0.46 -0.33 -3.46 3.46
2003 22978 9.46 0.40 0.24 2.60 2.60
2004 23375 9.62 0.97 0.16 1.69 1.69
2005 22326 9.19 0.57 -0.43 -4.47 4.47
2006 23599 9.71 1.30 0.52 5.66 5.66
2007 23322 9.60 0.90 -0.11 -1.13 1.13
2008 21939 9.03 1.14 -0.57 -5.94 5.94
2009 22419 9.23 0.43 0.20 2.21 2.21
2010 14813 8.88 1.69 -0.35 -3.79 3.79
STDEV 0.28 -0.14 -1.37 3.81
AVERAGE 9.35

This chart summarizes the runs-scored data for the 2000-2010 seasons.  While the runs scored per game figure for this season is clearly the lowest in the set, there are multiple available factors that determine that it’s a normal fluctuation.

The first is the basic standard deviation.  The average of the set is approximately 9.35 RS/G, and the standard deviation is approximately 0.28 RS/G.  The z-score column indicates a particular point’s distance from the mean in terms of the standard deviation.  Ninety-five percent of the time, a point is expected to be within two standard deviations from the mean, or have a z-score between 0 and 2.  As we can see from the chart, the 2010 season fits neatly into that range, with a z-score of approximately 1.7.

The second is the percentile change between each season’s RS/G figure.  If we take the absolute value of each percentile change, we find that each year, the runs-scored total differs from the previous year’s total by about 3.81% in one direction or the other.  This season hits that mark almost exactly, featuring a 3.79% drop from the previous year.

And there isn’t a definitive trend, either.  Of the ten points in the data sent for changes, six were drops from the previous year, and four were increases, leading to the basic average of -1.37%, which equals about -0.14 RS/G over the course of a season.

In conclusion, statistical factors point in the direction of this season being a normal fluctuation in terms of runs scored.  We’ve certainly seen dominance from the mound, and this could turn out as being the most pitching-heavy season in recent memory, but it’s well within normal, and could easily go right back the other way at the drop of a hat.


Gavin Floyd and xFIP

After getting shelled by the Texas Rangers on June 2nd, 2010 (2.2 IP, 6 earned) Gavin Floyd’s ERA weighed in at a rotund 6.64, to the uninitiated it would appear that he was having a terrible season, but what is the truth?  During Floyd’s early season struggles it was pretty clear that luck was not on his side as his BABIP in April was 369 and in May slightly better but still high at 343, while his strand rates during those months were 55.8% and 66.8 un-respectively.  Floyd is throwing harder (FB velocity 2009-91.8, 2010-92.4), missing just as many bats (2009 contact%-77.8, 2010-77.0) and even getting hitters to chase his pitches more often (2009 o-swing%-27.6, 2010-28.3).

Someone in my fantasy league made a comment regarding Floyd’s terrible season and I commented “outside of a brutal BABIP and low strand rate, Gavin Floyd has essentially been the same pitcher” to which I was basically ridiculed.  But as we can see from this chart, Gavin Floyd was and is the same pitcher and therein lays the beauty of advanced pitching metrics like FIP or xFIP and the use of the peripherals that help gather these stats (BABIP, strand rate, HR/FB etc).

  K/9 BB/9 BABIP LOB% AVG ERA xFIP
Apr 7.8 4.1 369 55.8 301 6.49 4.09
May 7.0 2.2 343 66.8 296 5.63 4.12
Jun 8.0 2.3 281 72.5 217 2.58 3.30
Jul 6.4 2.3 290 80.0 234 1.01 3.35
2010 7.4 2.7 320 67.9 261 3.87 3.69
2009 7.6 2.7 292 69.7 246 4.06 3.69


When we look at K/9, BB/9 and xFIP from April all the way through this year and even from last season’s totals we see what xFIP is attempting to do for us, take out all of the noise and some of the factors pitchers cannot control (such as what happens after the ball is put in play) and give us a real idea of how said pitcher is performing, relatively speaking.

Look at how steady the xFIP column is in particular, even when Floyd had a month in which his ERA was 6.49, his xFIP remained calm and cool at 4.09.  But just as important look at his unbelievable Bob Gibson-like 1.01 ERA from July, again his xFIP tempers this and brings us all back to planet earth as it checks in at 3.35.

This is simply breaking down who Gavin Floyd is as a pitcher and this is also a simple way to explain and show the value and usage of xFIP.  I think it also helps show how useless ERA really is when evaluating a pitchers overall value and performance. 

For those curious, since that June 2nd shellacking Floyd has gone on a hellacious run – 62.1 IPs, 45 hits, 14 BB – 52 K’s, good for a 1.74 ERA and 0.95 WHIP.  All things considered Floyd is having a career year, who would’ve guessed?


Liberating Liberated Fandom

Reading Joe Posnanski’s latest piece about the struggles of the Royals, in which he opines about the fact that they’re a bad offensive team despite leading the league in batting average and showing no desire to promote two of their more intriguing young players (Alex Gordon and Kila Ka’aihue), I kept being struck with two pervading thoughts: (a) it must be terrible to be a fan of the Royals and (b) why would anyone do it?

Posnanski, of course, has become something of a darling in the sabermetric world not only for his excellent and insightful writing but for his acceptance and use of some of the more involved stats that we use to measure ballplayers. As such, he’s able to look past the fact that his Royals are taking pride in leading the league in hitting and have no interest in advancing beyond using batting average to measure players. Walks to them are res non grata, Posnanski argues, and he does so in the sort of tone that suggests that he has come to believe that there is no hope for change on the horizon. Which, you know, as long as Dayton Moore’s in charge, that does seem to be the case. But in any event, that’s really what made me wonder why Posnanski – and the other fans of the (disproportionately well-represented on the internet) Royals – keep following a team that gives them nothing in return.

Now, I suppose that on the surface, it makes sense: you root for the team you root for, and if you don’t root for the team that you grew up near, then you’re destined to be labeled a fair-weather fan. Such is life. But, perhaps because I adopted the Braves as my favorite team when they were on TBS every day and the Cubs were terrible, I don’t understand why that has to the case. See, sports is entertainment; we watch them because we enjoy the athletic splendor and all, but mostly because we are entertained by our favorite players going out there and plying their trade – because it’s fun.

If I had my copy of FreeDarko’s Macrophenomenal Pro Basketball Almanac with me, I’d quote here from their bit about liberated fandom. As it is, though, there is this post (first two paragraphs being of especial relevance) that will have to suffice for the moment; essentially, it argues for the eschewing of The Home Team in favor of the players that we actually enjoy watching. Are you a Cubs fan, but can’t stand watching a team put runners on third base with fewer than two outs in the 9th 10th and 11th innings and not score them even though come on just hit a freaking sacrifice fly or at the very least try a suicide squeeze*? Don’t concern yourself with it; soak in the good times to be had in watching Carl Crawford steal bases or Vladimir Guerrero defy age or…oh, boy…or Albert Pujols beat down the doors to Cooperstown.

*I petitioned for this to happen in each of the three aforementioned innings. People say the triple is the most exciting play in baseball. People are wrong. The brief burst of drama and immediacy that a squeeze provides is unlike anything else in baseball. And it’s not for only that reason that I don’t understand why we don’t see more suicide squeezes, but also because it seems a really easy way to get a run, no? As long as bat hits ball, your chances of scoring a run are far higher than if you’re just letting the guy at the plate hit.

Two things: (1) Outs are almost always the dominant outcome of any game. Teams simply don’t put 27 men on base very often; they will always make enough outs (sometimes as few as 12; far more often 27) to finish a game. (2) Don’t think of batting average relativistically. Viz., think of them as percentages, not in the context of your baseball experience. A .330 hitter sounds like he’s really good at hitting…but ultimately, it means that he’s been getting hits in one-third of his at-bats and making outs nearly 70% of the time. If you’ve a guy on the team hitting .501, then, sure, let him swing away. But hits simply do not happen all that frequently; bunting is a much easier way to put the ball in play.

That’s the kind of suggestion I can make nowadays, what with the availability of MLB.tv and the internet making it easy to follow any team. During the World Cup – and immediately after – people loved to talk about how this would be the World Cup that got people into soccer. Now, they say this after nearly every Cup where the USMNT doesn’t get totally embarrassed, but this one was Different because we have the Internet and can keep track of our Nation’s Heroes as they play for Club Teams over in Foreign Lands. Similarly, though infinitely more effectively, people can follow any baseball team, or any selection of players, that they choose. At the risk of sounding like a shill for MLB, MLB.tv has a feature where you can select any player in the league, and they’ll alert you when he comes up to bat or in to pitch. I myself follow guys like B.J. Upton, Jay Bruce, Ichiro, Matt Wieters, Colby Rasmus and Pablo Sandoval that I wouldn’t be able to see otherwise – guys whose careers I enjoy more than, say, Melky Cabrera’s*.

*This is perhaps the wrong time for me to be writing this article, because this Braves team is probably the most enjoyable one to watch since Andruw Jones and the Baby Braves ruled the roost. Cabrera and Eric Hinske were the only two guys I could think to speak of derisively and I don’t hold any particular grudge against them. I guess Derek Lowe isn’t all that fun, but it doesn’t seem fair to pick on pitchers.

So why shouldn’t I just declare myself a fan of baseball, rather than the Braves? Everyone knows that Seinfeld bit about how having a favorite sports team is like rooting for laundry; what makes the Braves’ laundry so compelling that I should forego the pleasure of watching Jose Reyes and Hanley Ramirez and Chase Utley and Stephen Strasburg? I imagine the answer to this question is ‘it just is,’ or some similarly vague and far-reaching statement. Perhaps the tribal nature of fandom is so engrained in sports fans’ minds that there’s no turning away from it; perhaps people think there is a greater reward to be gleaned from “suffering”* through a team’s ups-and-downs and winning a championship.

*Y’know, for all the good there is in sports, it sure is a bastion of hyperbole. People love to throw around how Cleveland fans have “suffered” because they haven’t had a team in their city win a title in so long, and don’t have any real prospects of doing so in the near future. With the culture of superlatives that dominate sports, is it any wonder that Dwyane Wade dropped his 9/11 line? I’m going to stop there because the only thing more grating than that hyperbole is the moralizing and holier-than-thou attitude inherent in telling people that they’re not feeling real pain, and turn on the news if you want to see tragedy.

I don’t like that view. Sports isn’t life; sports is a diversion from life – it’s a forum for unparalleled conflict resolution (winners, losers, champions, meticulous documentation and quantified performance) and enjoyment of things we don’t see in everyday life (e.g. 450-foot home runs and diving catches and walkoff celebrations*).

*Though I do think this could (and should!) be brought into offices and schools. Say you just gave a really great presentation; you could have the audience cheering throughout your conclusion and hitting a crescendo as you nail the last syllable of ‘thank you,’ and then they vault over their tables and mob you and everyone jumps around. You could even rig the projector to drop company-color confetti. If this were commonplace I’d almost be excited to graduate soon.

So why do we arbitrarily bring unpleasantness into the equation? Why do we self-identify as fans of a team of guys that we may not like? Why do stat-minded guys like Rany Jazayerli and Rob Neyer and Joe Posnanski put themselves through the drudgery of a Royals team that couldn’t be more antithetical to their baseballing values? It is an inherently jingoistic, paleolithic process, a throwback to the days when the United States was a name and not a realized concept. I do think that there is a place for fandom in sports; I would argue that the incredibly fluid player movement in the NFL leaves fans rooting for teams as the only constants in a league of flux, and that watching a game where you don’t care for (or actively dislike) both teams is painful. But, with all due credit to those exceptions, I do not think that we need to subvert our enjoyment of sports and call ourselves ‘fans’ of a team. We don’t need to slog through inning after inning of uninspired baseball that’s not played to our liking when there are so many options out there. We can cast off the shackles of supporting a last place team and enjoy watching whomever fits our fancy; we can, or indeed should, be a fan of the game without being a fan of a team.